Detailed Marketing Analysis: Sony Curved TV Market Strategies
VerifiedAdded on 2020/03/07
|8
|1732
|301
Report
AI Summary
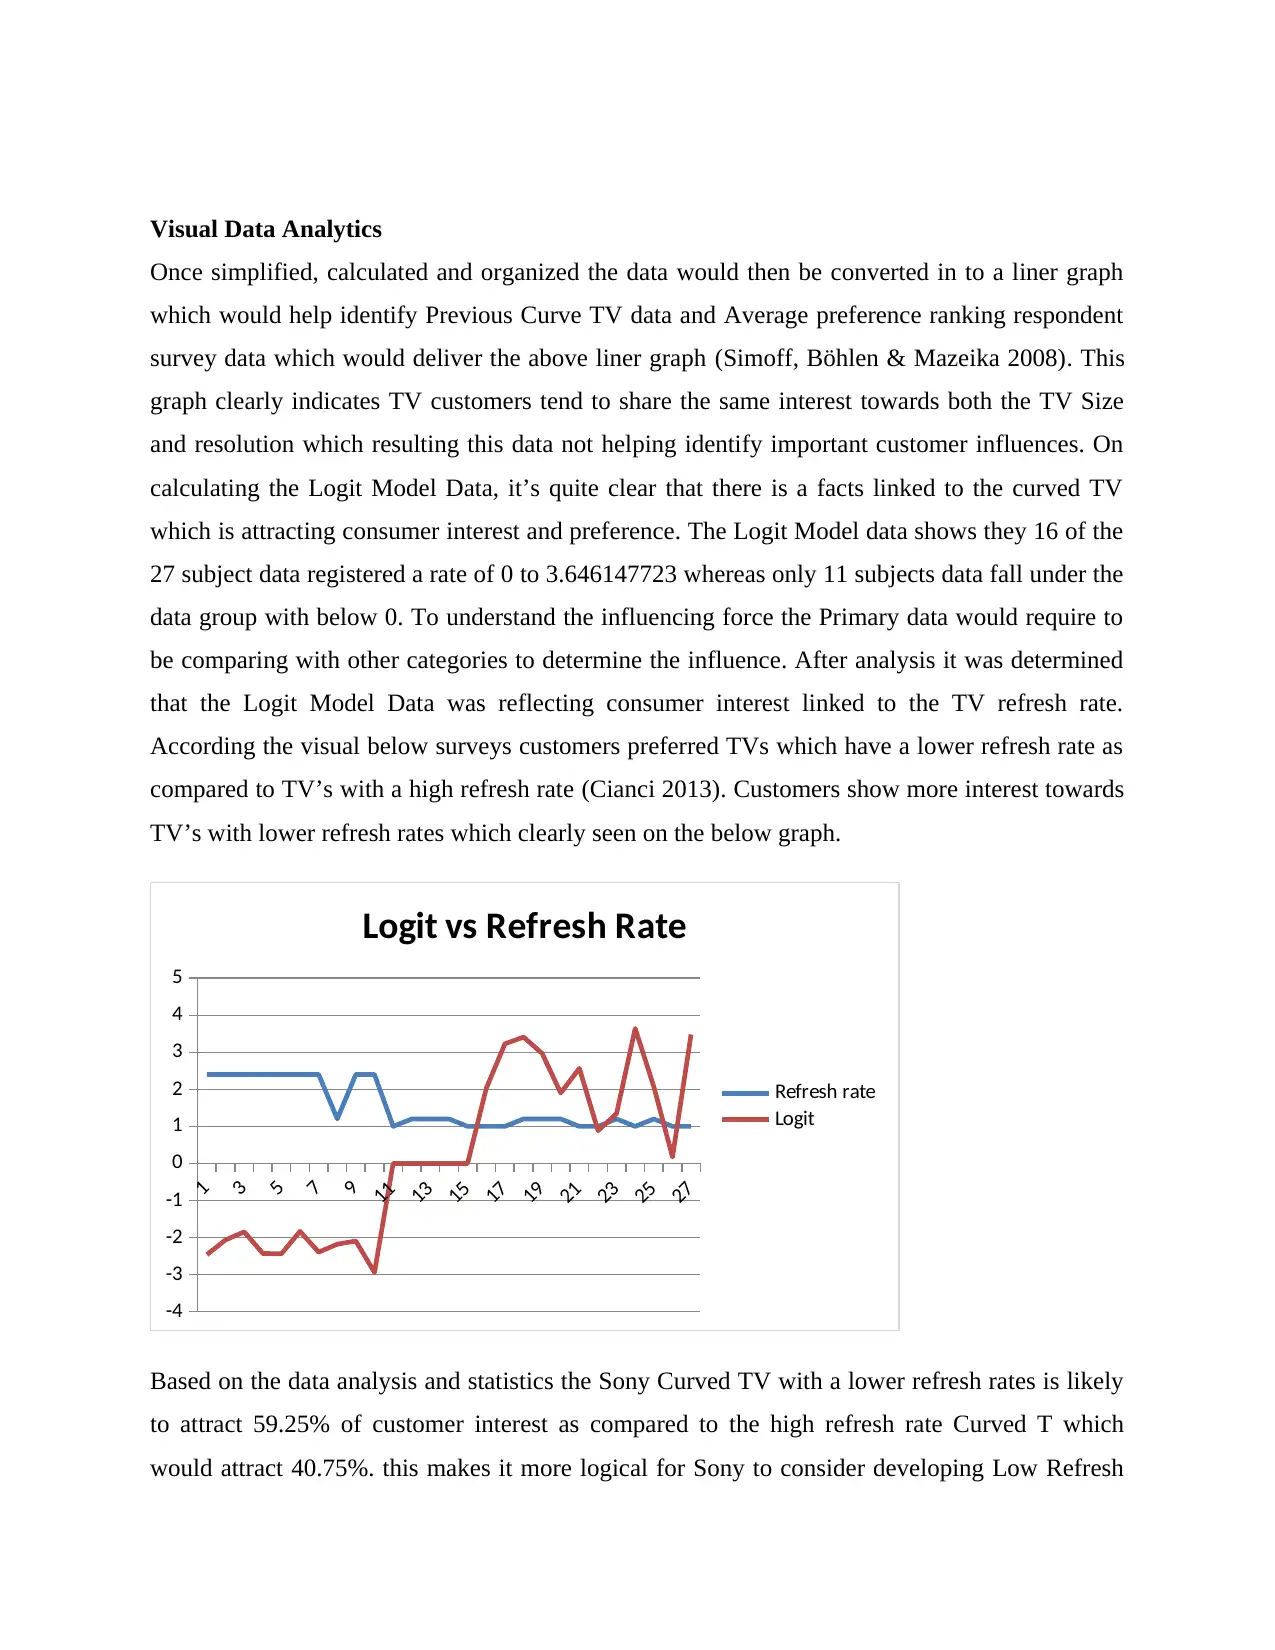
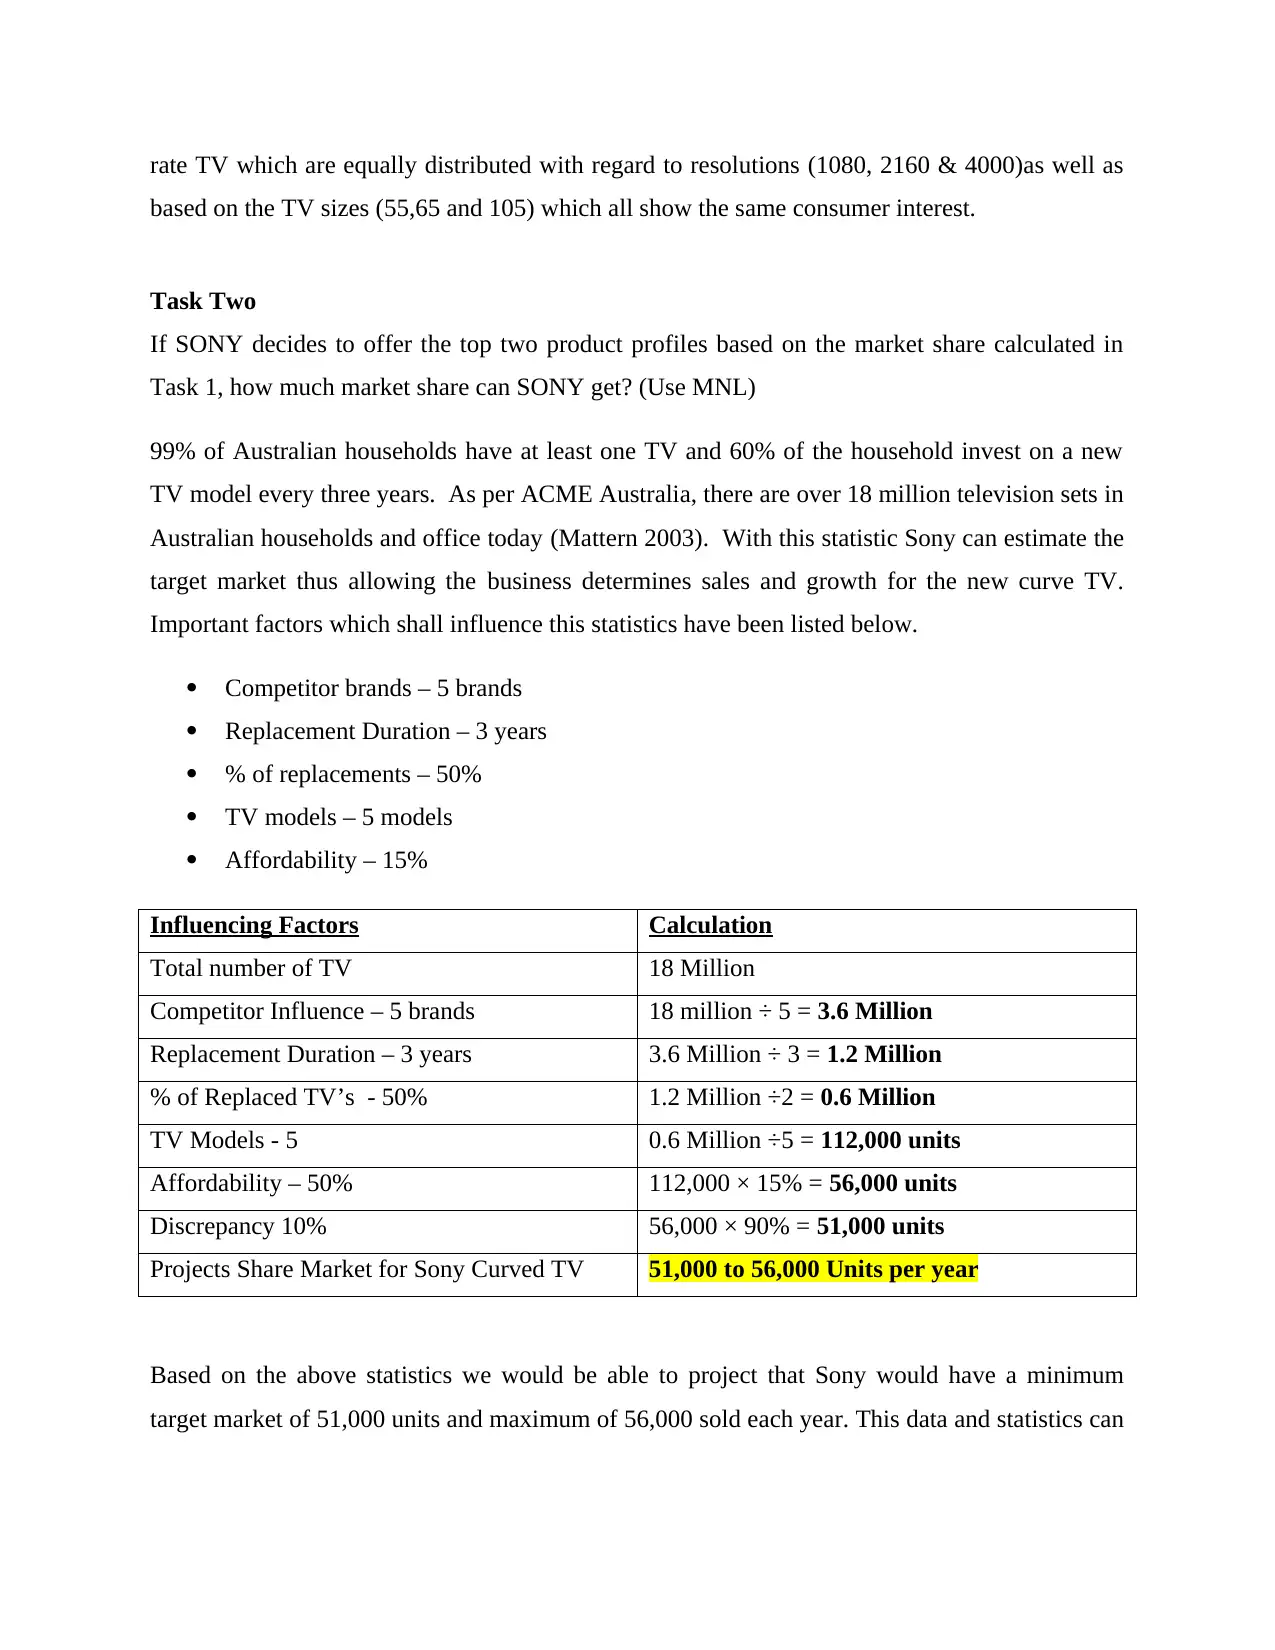
This report presents a comprehensive marketing analysis of Sony Curved TVs, evaluating different product strategies and their potential impact on market share and profitability. The analysis begins with data compilation and conversion, followed by visual data analytics using a multinomial logit model (MNL) to estimate market share based on consumer preferences, particularly focusing on refresh rates. The report then assesses the market share Sony could achieve by offering different product profiles, considering factors like competitor brands, replacement duration, and affordability within the Australian market. Furthermore, it evaluates the profit potential of offering one versus two product strategies, considering fixed costs and sales margins. Finally, the report offers recommendations to Sony, discussing which strategies would yield the highest market share and profitability, ultimately suggesting a product strategy that aligns with market trends and consumer behavior, advocating for an initial focus on budget-friendly curved TVs to penetrate the market and build consumer confidence before introducing higher-end models. The report leverages statistical data, market research, and financial projections to support its conclusions, providing valuable insights for strategic decision-making.

8/21/2017
Student Name
Marketing Analytics- Sony Curved TV Marketing Analysis
Student Name
Marketing Analytics- Sony Curved TV Marketing Analysis
Paraphrase This Document
Need a fresh take? Get an instant paraphrase of this document with our AI Paraphraser

Contents
Task One.....................................................................................................................................................1
Data Compilations and Conversion.........................................................................................................1
Visual Data Analytics..............................................................................................................................2
Task Two.....................................................................................................................................................3
Task Three...................................................................................................................................................4
Task Four....................................................................................................................................................5
Discuss which of the two strategies gives highest market share and why................................................5
Discuss which of the two strategies offers best profitability....................................................................5
Discuss which product strategy would you recommend to SONY and why............................................5

Task One
Identify the product profile which is likely to get the highest market share. Using Multinomial
Logit model (MNL), estimate how much market share these products can obtain?
Data Compilations and Conversion
To execute the market analysis for the Sony Curved TV, data from Table 1 – Product Profiles
has been combined with the average data retrieved from the consumer preference ranking from
the Sony Data sheet. This has delivered the three main categories which would be used to
perform the Logit Calculations on the excess sheet. The helps deliver the data in a more
simplified and organised manner which has been entered in the Resolution and Screen Size
columns have been converted to single digit numerals which would allow for a more organised
Logit model (DeMaris 1992). This would help simplify the information and deliver a visual
depiction of the data so as to allow for better analysis and the identification of trends or features
which may influence customer preference while purchasing Sony Curved TV. This data can then
be used to design and develop curved TV’s which falls under the most preferable categories thus
allowing for maximum profit.
0 2 4 6 8 10 12
0
2
4
6
8
10
12
Sony Curved TV Marketing Analysis
Resolution
Screen Size
Logit
⊘ This is a preview!⊘
Do you want full access?
Subscribe today to unlock all pages.

Trusted by 1+ million students worldwide

Visual Data Analytics
Once simplified, calculated and organized the data would then be converted in to a liner graph
which would help identify Previous Curve TV data and Average preference ranking respondent
survey data which would deliver the above liner graph (Simoff, Böhlen & Mazeika 2008). This
graph clearly indicates TV customers tend to share the same interest towards both the TV Size
and resolution which resulting this data not helping identify important customer influences. On
calculating the Logit Model Data, it’s quite clear that there is a facts linked to the curved TV
which is attracting consumer interest and preference. The Logit Model data shows they 16 of the
27 subject data registered a rate of 0 to 3.646147723 whereas only 11 subjects data fall under the
data group with below 0. To understand the influencing force the Primary data would require to
be comparing with other categories to determine the influence. After analysis it was determined
that the Logit Model Data was reflecting consumer interest linked to the TV refresh rate.
According the visual below surveys customers preferred TVs which have a lower refresh rate as
compared to TV’s with a high refresh rate (Cianci 2013). Customers show more interest towards
TV’s with lower refresh rates which clearly seen on the below graph.
1
3
5
7
9
11
13
15
17
19
21
23
25
27
-4
-3
-2
-1
0
1
2
3
4
5
Logit vs Refresh Rate
Refresh rate
Logit
Based on the data analysis and statistics the Sony Curved TV with a lower refresh rates is likely
to attract 59.25% of customer interest as compared to the high refresh rate Curved T which
would attract 40.75%. this makes it more logical for Sony to consider developing Low Refresh
Paraphrase This Document
Need a fresh take? Get an instant paraphrase of this document with our AI Paraphraser

rate TV which are equally distributed with regard to resolutions (1080, 2160 & 4000)as well as
based on the TV sizes (55,65 and 105) which all show the same consumer interest.
Task Two
If SONY decides to offer the top two product profiles based on the market share calculated in
Task 1, how much market share can SONY get? (Use MNL)
99% of Australian households have at least one TV and 60% of the household invest on a new
TV model every three years. As per ACME Australia, there are over 18 million television sets in
Australian households and office today (Mattern 2003). With this statistic Sony can estimate the
target market thus allowing the business determines sales and growth for the new curve TV.
Important factors which shall influence this statistics have been listed below.
Competitor brands – 5 brands
Replacement Duration – 3 years
% of replacements – 50%
TV models – 5 models
Affordability – 15%
Influencing Factors Calculation
Total number of TV 18 Million
Competitor Influence – 5 brands 18 million ÷ 5 = 3.6 Million
Replacement Duration – 3 years 3.6 Million ÷ 3 = 1.2 Million
% of Replaced TV’s - 50% 1.2 Million ÷2 = 0.6 Million
TV Models - 5 0.6 Million ÷5 = 112,000 units
Affordability – 50% 112,000 × 15% = 56,000 units
Discrepancy 10% 56,000 × 90% = 51,000 units
Projects Share Market for Sony Curved TV 51,000 to 56,000 Units per year
Based on the above statistics we would be able to project that Sony would have a minimum
target market of 51,000 units and maximum of 56,000 sold each year. This data and statistics can

then be used to calcite Sony TV sales, profits and market expansion projection with regard to the
new Sony Curve TV in Australia.
Task Three
SONY has estimated that potential size of its market in Australia next year is 50,000 consumers
and each consumer buys one unit on average. SONY gets a margin of $400 from each of its
product. SONY will incur an additional fixed cost of $5 Million every year if it decides to offer
two products instead of one. Under this scenario, evaluate the profit potential of the two product
strategies.
(Hint: Profit = Sales * Margin. If there is additional cost involved, then Profit = Sales*Margin –
Additional cost).
No of Products - 1 50,000 × $400 = $20,000,000/=
No of Products - 2 50,000 × $400 ×2 = $40,000,000/=
Additional Cost for 2nd unit = 5 Million
Total Profits for 2 Products $40,000,000 - $5,000,000 = $35,000,000/=
Deviation – 10% 35,000,000 × 90% = $31,500,000/=
Project Profit for 2 Products - $31,500,000/=
Task Four
Present your recommendations to SONY.
Discuss which of the two strategies gives highest market share and why
The second strategy involving 2 products is likely to deliver a higher market share are it would
allow Sony to offer 100,000 TV units to clients in Australia in the coming year. One could be
high end while the other budget cost which would attract a wide client base which would help
improves the brands market share (Helgert 2005). Consumers are greatly influenced by brands
but it’s important to focus on affordability so as to tap in to a larger consumer market. Offering
both top model and budget models will allow Sony to tap in to two consumer categories which
will have a direct effect on the businesses market share.
⊘ This is a preview!⊘
Do you want full access?
Subscribe today to unlock all pages.

Trusted by 1+ million students worldwide

Discuss which of the two strategies offers best profitability
The first strategy where Sony offers only one product delivered the higher profitability when
calculated according to the number of units being sold but the second strategy offering two units
is likely to deliver better long term results. This is because Sony would be able to tap in to a
larger market share and bigger consumer basket which would contribute immensely towards the
businesses suitability and growth over the long term perspective (Cagan 2017). The second
strategy may deliver a lower profit margin per unit sold but it also means the brand in tapping in
to a lager consumer market.
Discuss which product strategy would you recommend to SONY and why
The Curved TV market is still developing and curved TV is considerably expensive as compared
to most other LED and smart TV’s Today. This results in making the Curved TV market very
limited as consumers would rather wait a while before investing on the curved TV. It’s also a
considerably new design and concept which makes it important for Sony to adopt developing a
budget Sony Curved TV first which they can introduce to the market after which they can
consider developing larger and more expensive models. Offering affordable models which fall
in to the media income groups price as well as specification range with help introduce the new
concept to the market (Doole & Lowe 2008). Gradually as the curved TVs are purchase
customers will also develop more confidence and begin purchase top end models. Brands like
Samsung and LG have already intruded the Curved TV’s to the market but they adopted the
developing top model curved TVS first. His has resulted in limiting the Sales of the curved TV
which has also affected consumer interest towards the product. Sony is well recognized for
delivering the best quality thus even the budge model curved TV is likely to attract considerable
consumer interest and boost the Sony TV securing a majority market share.
Paraphrase This Document
Need a fresh take? Get an instant paraphrase of this document with our AI Paraphraser

Bibliography
Cagan, M 2017, Accounting 101: From Calculating Revenues and Profits to Determining Assets and
Liabilities, an Essential Guide to Accounting Basics, Simon and Schuster.
Cianci, P 2013, High Definition Television: The Creation, Development and Implementation of HDTV
Technology, McFarland.
DeMaris, A 1992, Logit Modeling: Practical Applications, Volume 86; Volume 1992, SAGE, New Delhi.
Doole, I & Lowe, R 2008, International Marketing Strategy: Analysis, Development and Implementation,
Cengage Learning EMEA, London.
Helgert, J 2005, Comparing and Contrasting Marketing Assumptions and Advertising Strategies in Japan
and the United States: Case Studies, Edwin Mellen Press.
Mattern, J 2003, Television: Window to the World, The Rosen Publishing Group, New York.
Simoff, S, Böhlen, M & Mazeika, A 2008, Visual Data Mining: Theory, Techniques and Tools for Visual
Analytics, Springer Science & Business Media.
1 out of 8

Your All-in-One AI-Powered Toolkit for Academic Success.
+13062052269
info@desklib.com
Available 24*7 on WhatsApp / Email
Unlock your academic potential
Copyright © 2020–2025 A2Z Services. All Rights Reserved. Developed and managed by ZUCOL.