Data Visualization and Analysis: Sony Dataset Project

Verified

Added on  2023/03/31

|19
|3038
|495
Project
AI Summary
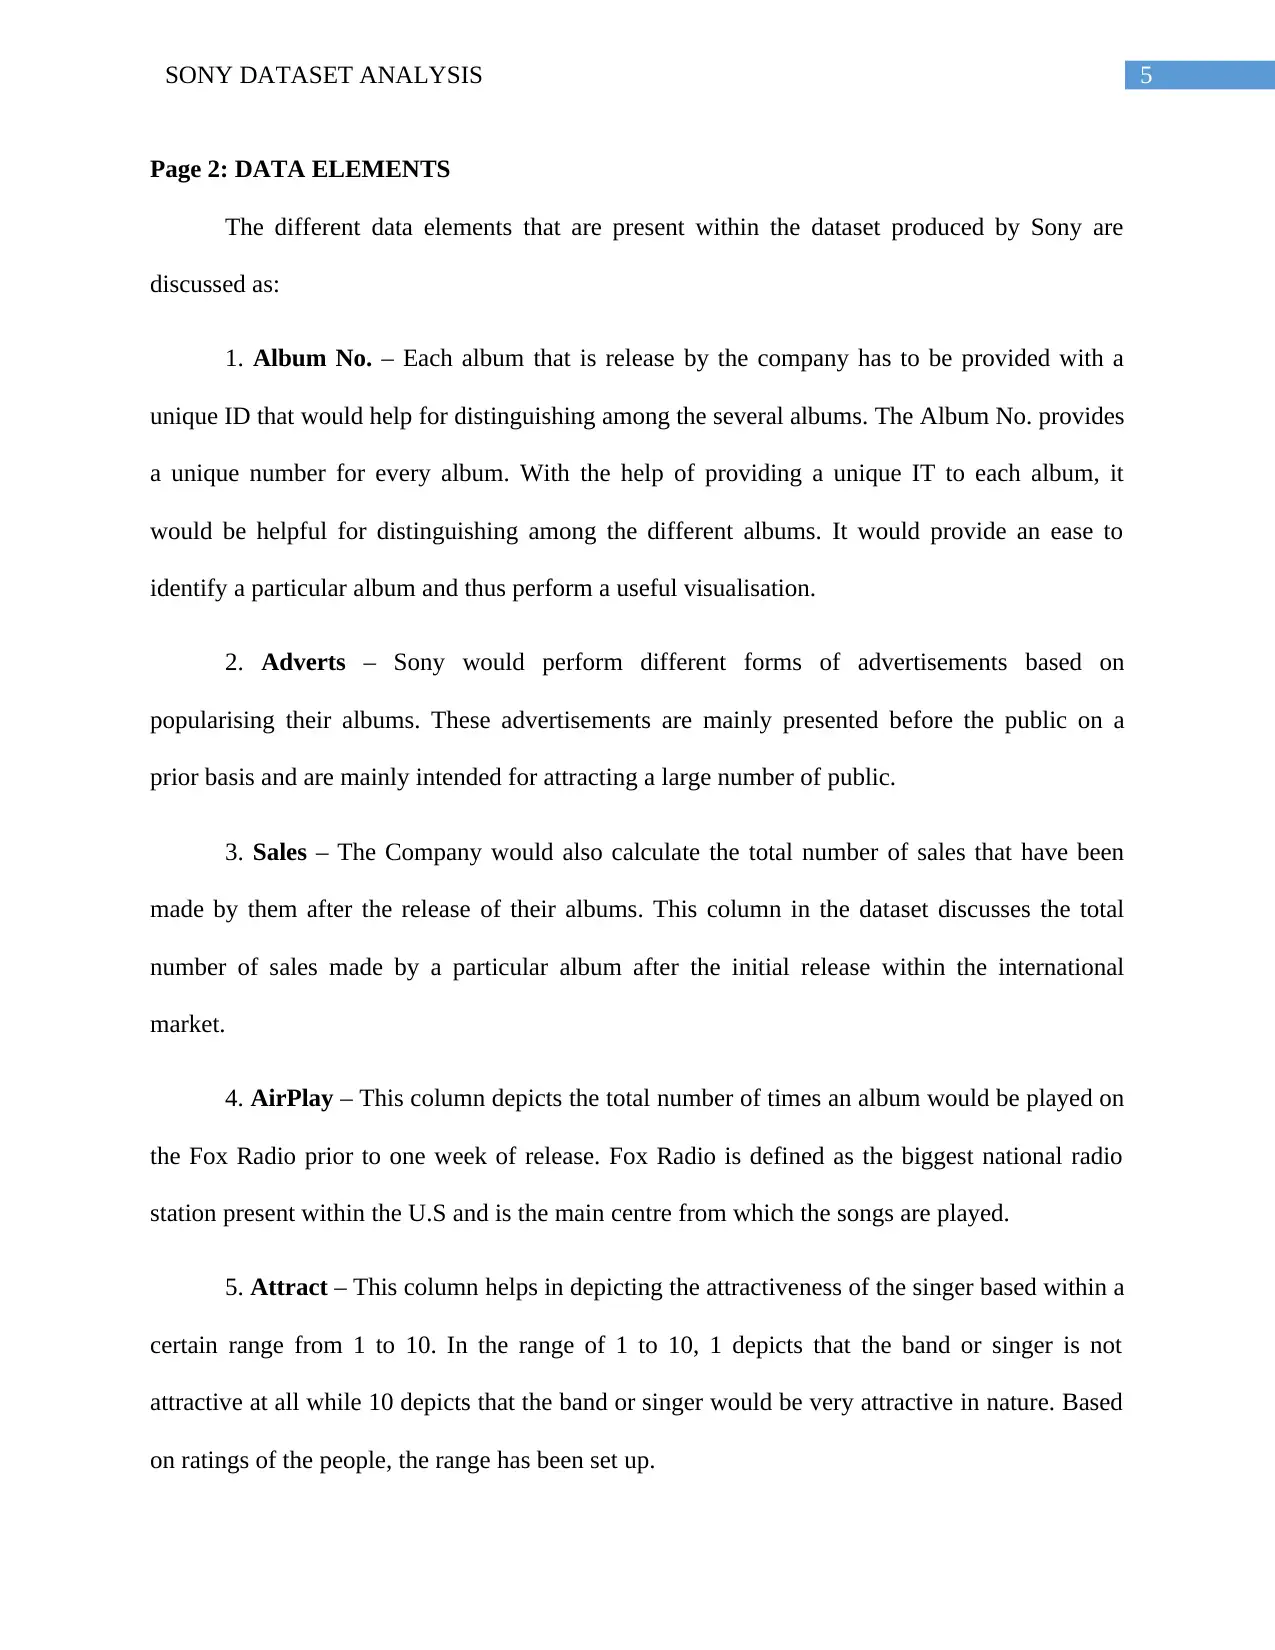
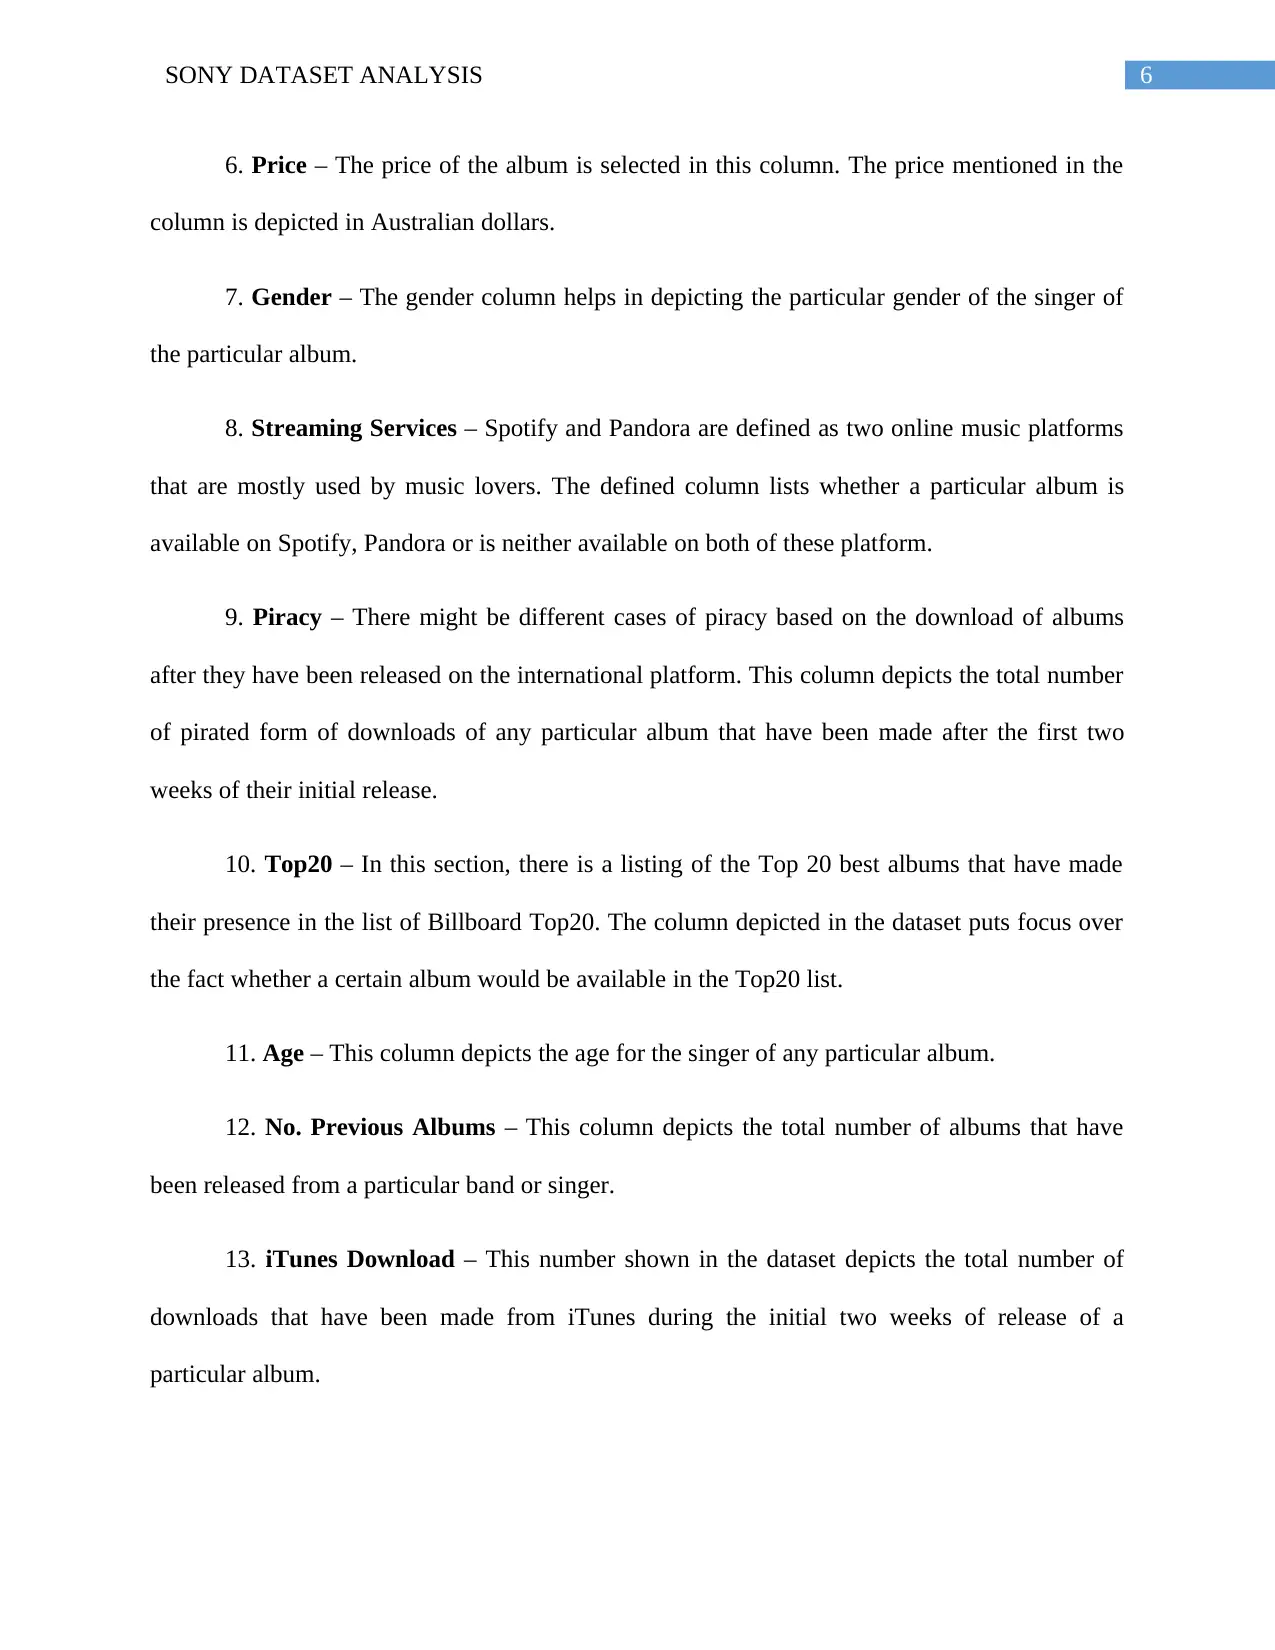
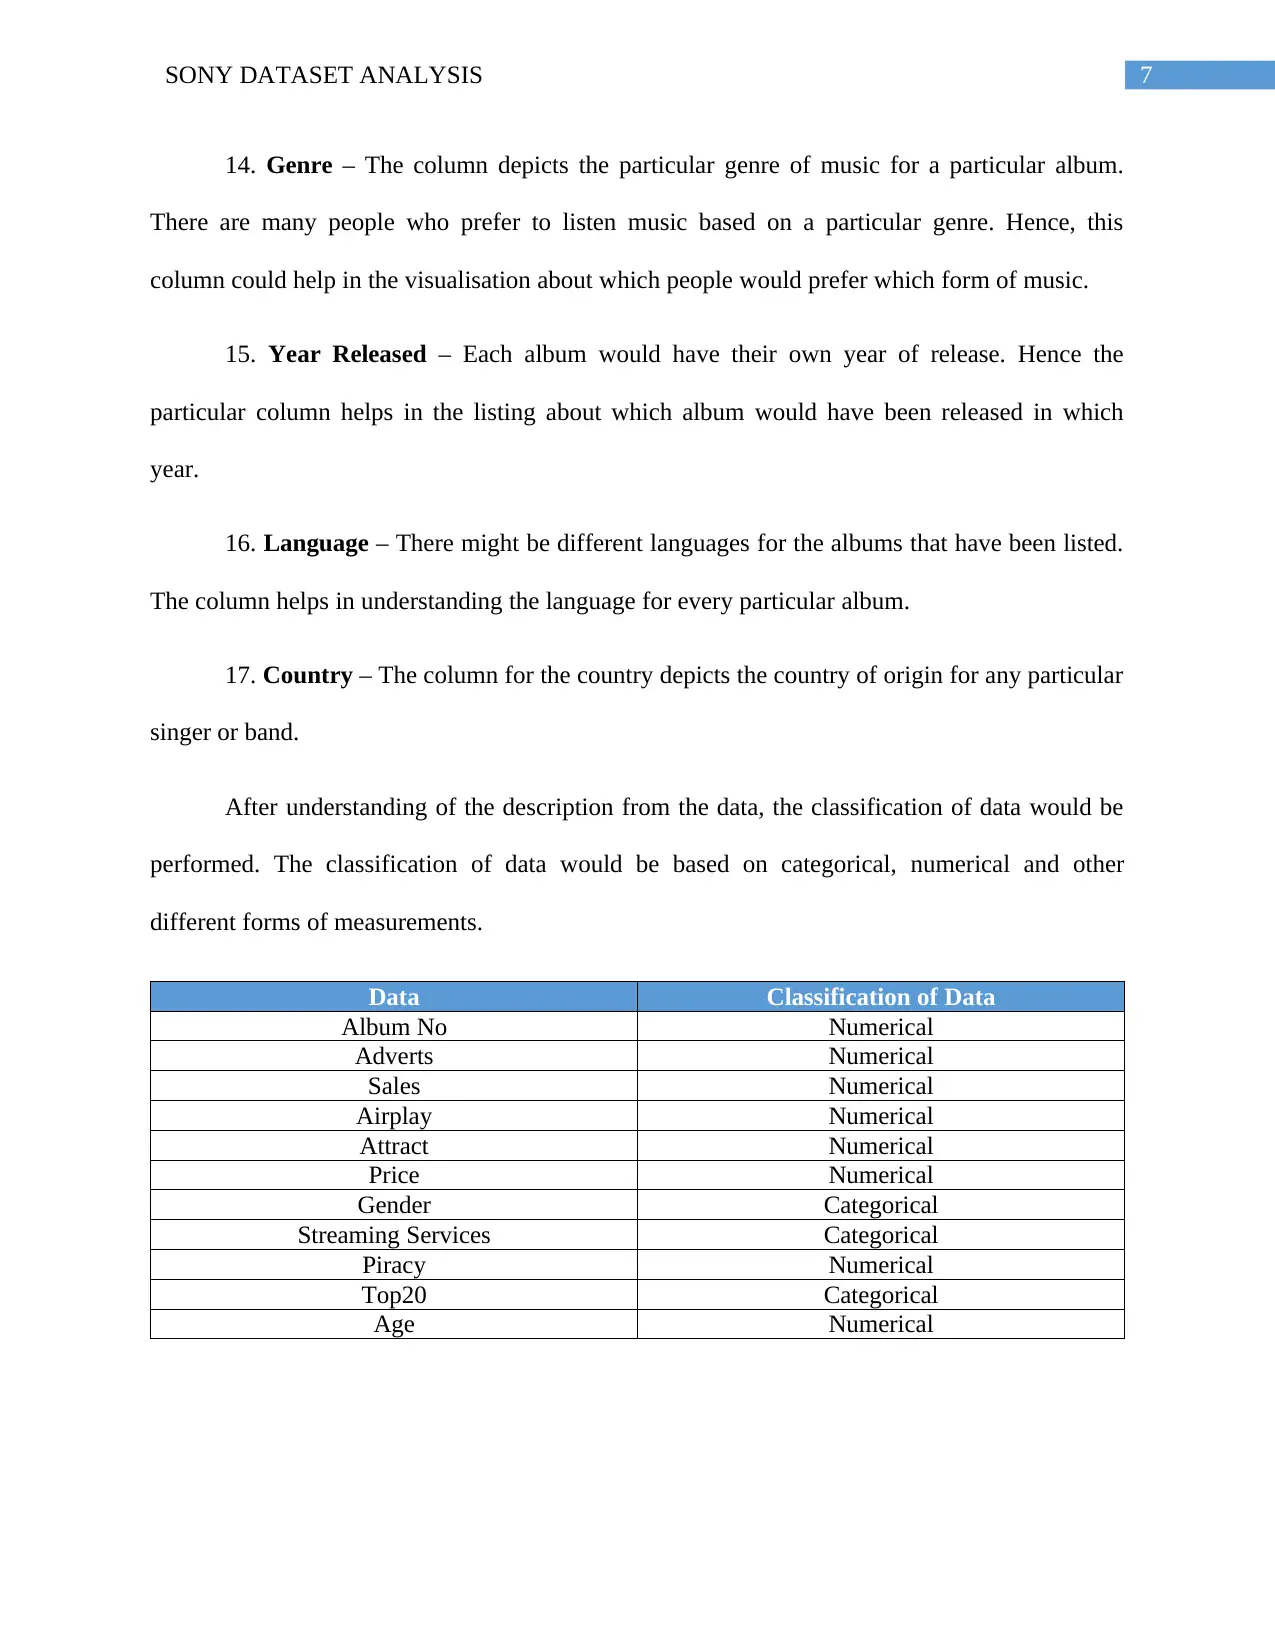
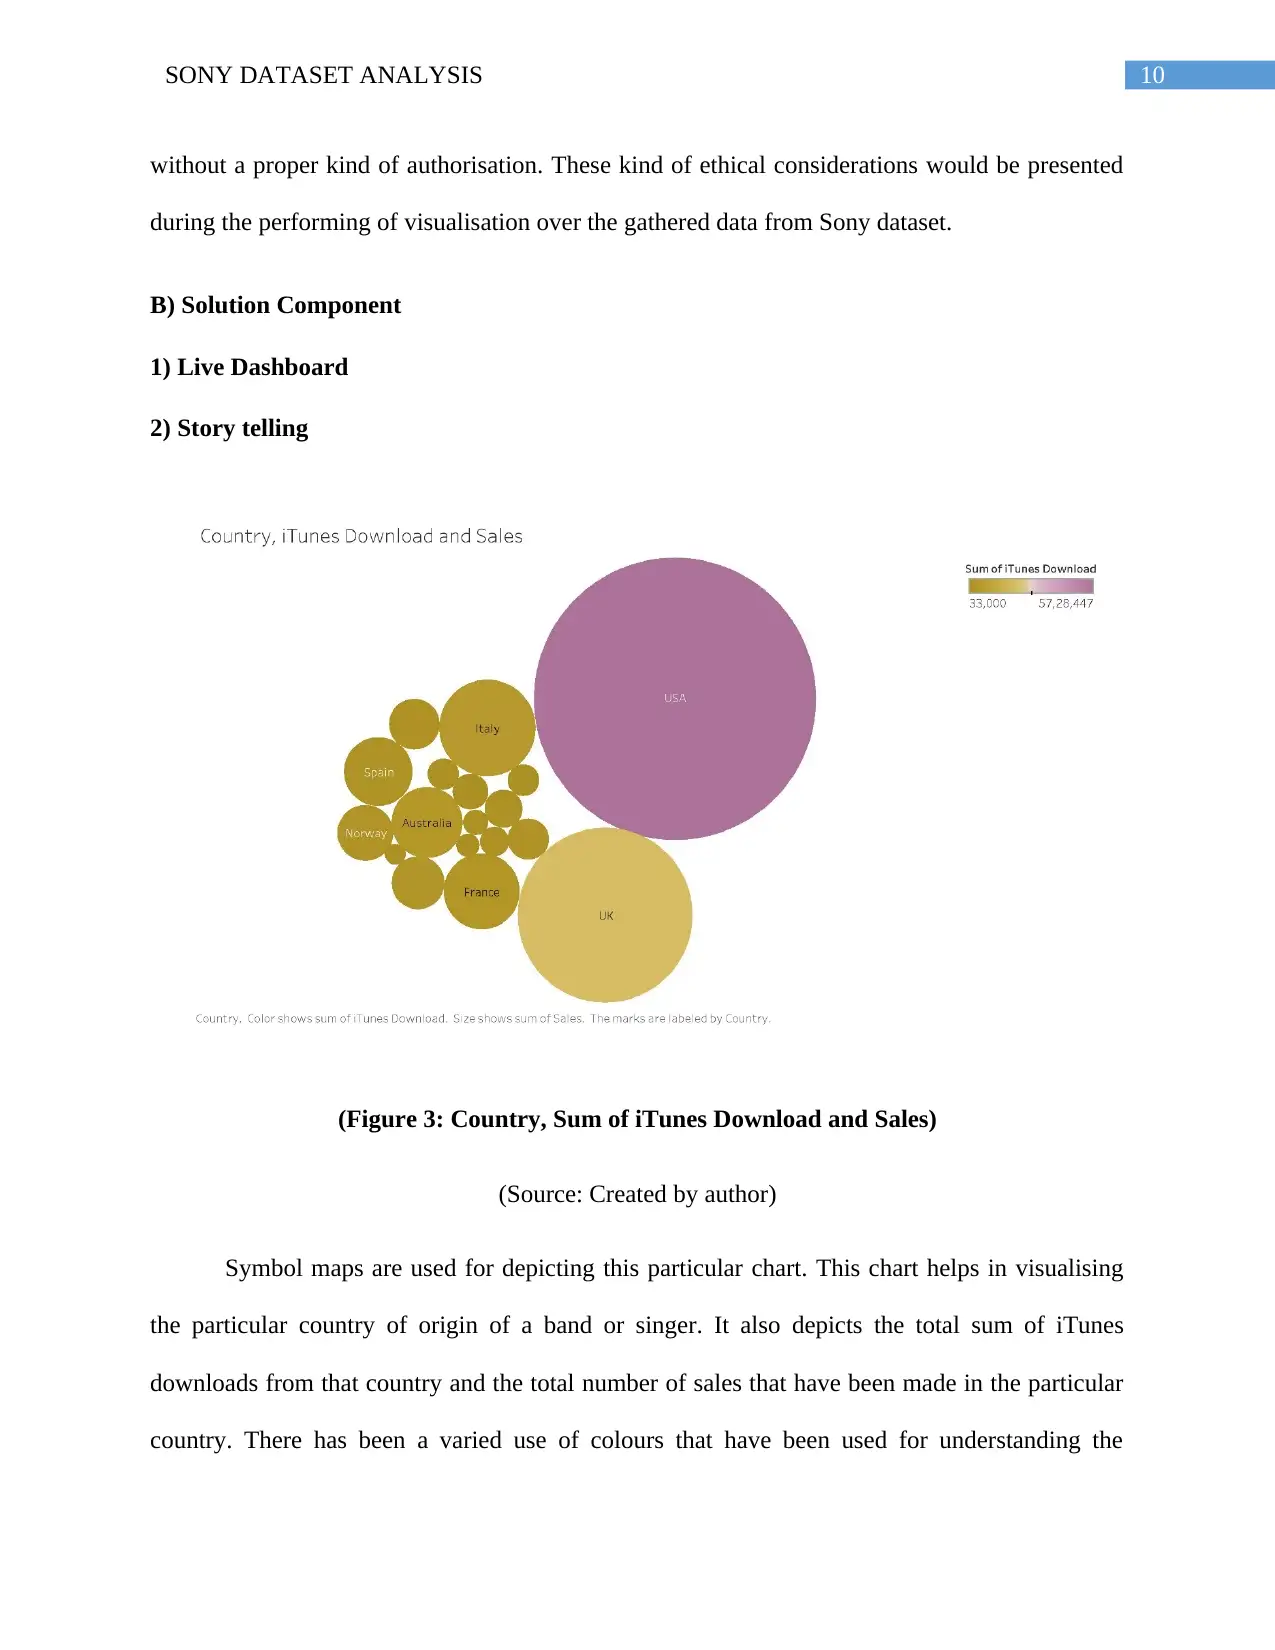
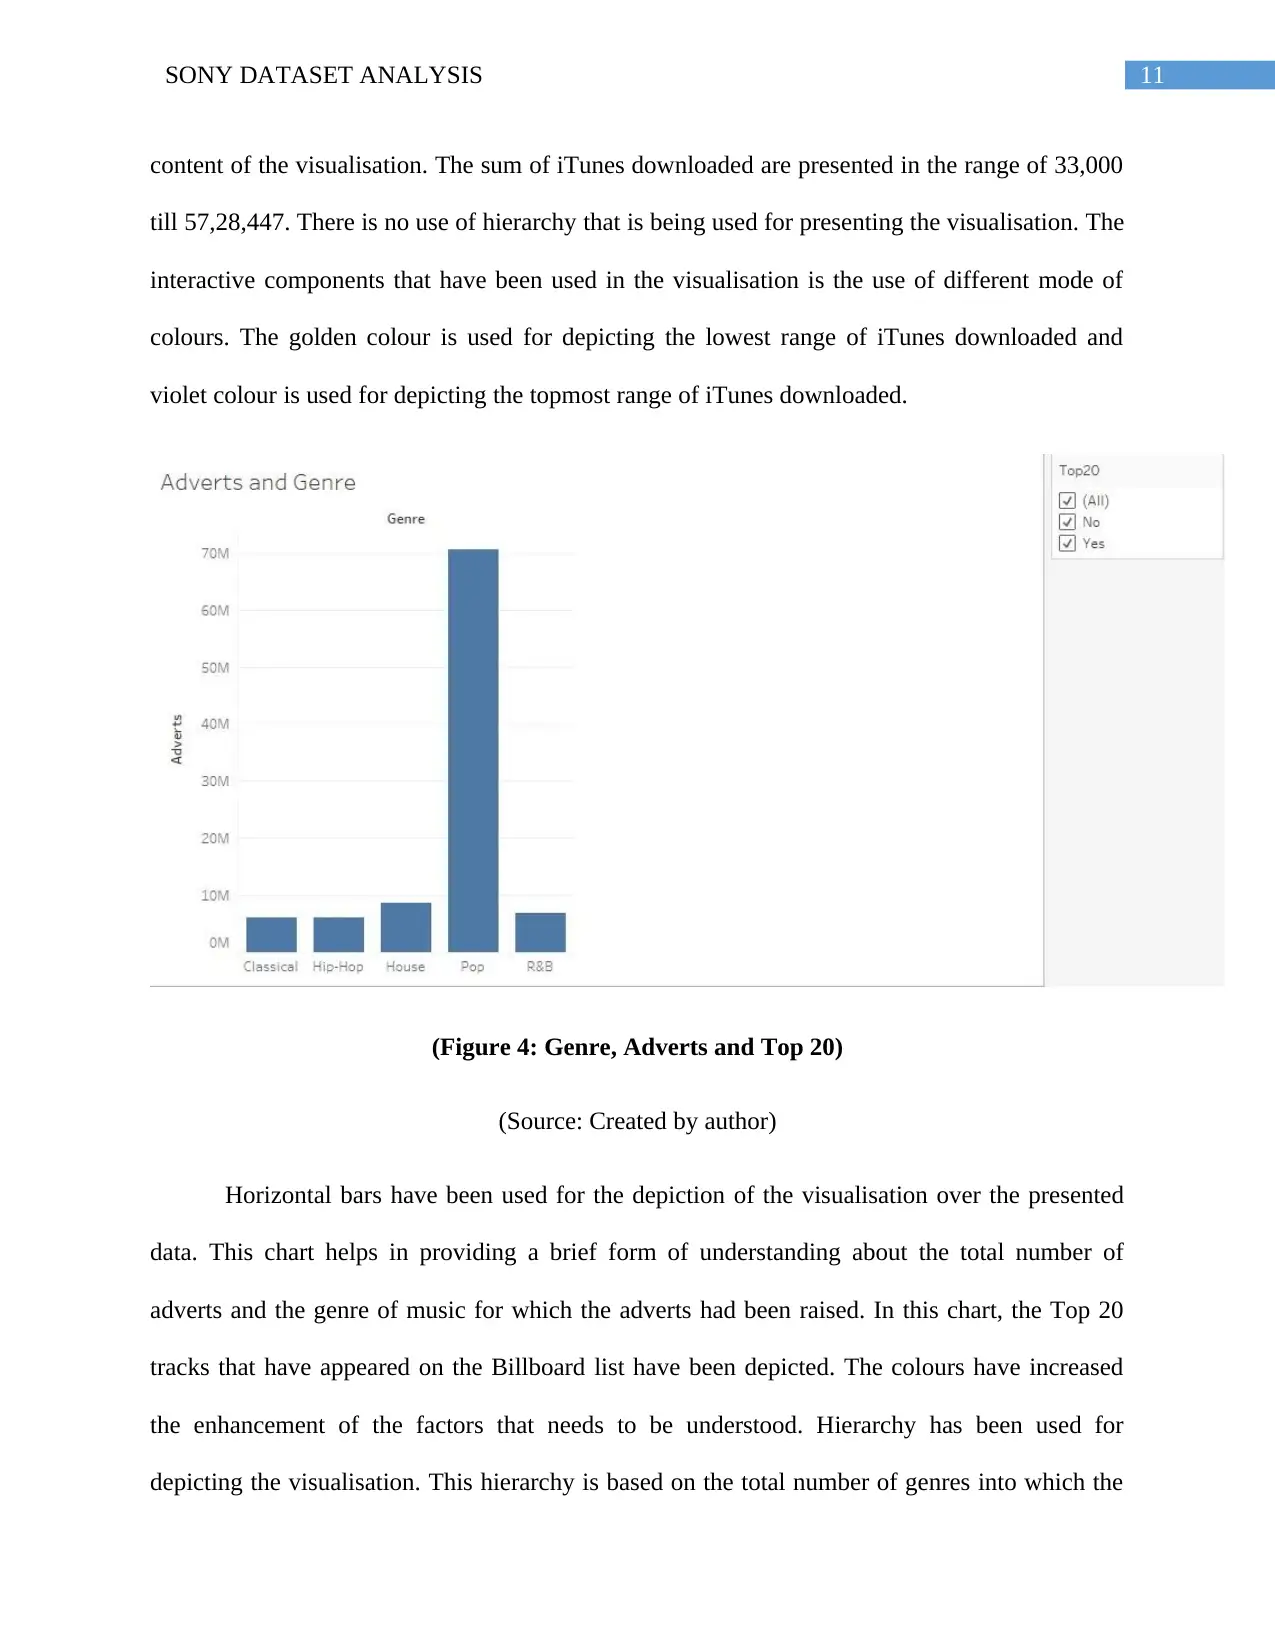
This project presents an analysis of the Sony dataset, focusing on data visualization and interactive dashboard design. The project begins with an introduction to Beautiful Data Inc. and its role in data analytics, followed by an overview of the WordPress website components used to present the analysis. The core of the project involves a detailed examination of the data analysis process, including audience determination (Beautiful Data Inc. and Sony Corporation), and a comprehensive breakdown of the data elements within the Sony dataset (Album No., Adverts, Sales, AirPlay, Attract, Price, Gender, Streaming Services, Piracy, Top20, Age, No. Previous Albums, iTunes Download, Genre, Year Released, Language, and Country). The project also addresses the importance of selecting appropriate charts and graphs for data visualization and emphasizes ethical considerations in data handling, such as privacy, confidentiality, and responsible data use. The solution component includes a discussion of a live dashboard and storytelling through data visualization, using symbol maps and horizontal bar charts to represent iTunes downloads, sales, and genre-based data. The project highlights the importance of understanding data elements, ethical considerations, and effective visualization techniques for drawing meaningful insights from the Sony dataset.
Document Page
Running head: SONY DATASET ANALYSIS
Sony Dataset Analysis
Name of the Student
Name of the University
Author note
tabler-icon-diamond-filled.svg

Paraphrase This Document

Need a fresh take? Get an instant paraphrase of this document with our AI Paraphraser
Document Page
1SONY DATASET ANALYSIS
Table of Contents
1. Components of WordPress Website............................................................................................2
Home............................................................................................................................................2
About Us......................................................................................................................................2
Contact.........................................................................................................................................2
A) Process Component....................................................................................................................3
Page 1: AUDIENCE....................................................................................................................3
Page 2: DATA ELEMENTS.......................................................................................................5
Page 3: THE RIGHT FIT............................................................................................................8
Page 4: ETHICS..........................................................................................................................9
B) Solution Component.................................................................................................................10
1) Live Dashboard.....................................................................................................................10
2) Story telling...........................................................................................................................10
Bibliography..................................................................................................................................17
Document Page
2SONY DATASET ANALYSIS
1. Components of WordPress Website
Home
Welcome to Beautiful Data Inc.
Beautiful Data Inc. is a company that specializes in the development of different forms of
dynamic and insightful dashboards. The different dashboards are designed for clients who
mainly seek help from the company for understanding their present business situations and thus
focusing on bringing in proper kind of developments. We partner with different companies for
designing interactive dashboards by making use of various kind of data that is extracted from the
company. With the help of designing such kind of dashboards, we also develop an efficient
relationship with our clients. It also helps in prospering the growth of our company in the future.
About Us
My name is (To be filled by student) and I am currently pursuing (Course name). I specialize in
designing interactive dashboards for our clients. I make use of different datasets, visualize them
with the help of software and thus link them together to design an interactive dashboard that
would be helpful for our company.
Contact
To be filled by student
Document Page
3SONY DATASET ANALYSIS
A) Process Component
Page 1: AUDIENCE
Determination of the audience forms an important aspect of visualisation of the data. The
primary thing that needs to be considered when performing a visualisation over the data is that
the intended company should consider the primary and target audience. The primary purpose of
visualising over the collected data is that they used for communicating the significant form of
insights that could be described as the most important vehicle of performing discovery.
In the discussed research, the intended audience for which the data would be created is
for Beautiful Data Inc. and Sony Corporation. The Beautiful Data Inc. is a company that
performs data analytics over different forms of data. The employees within the company are
responsible for designing interactive kind of dashboards. These dashboards could be developed
by performing an analysis over varied form of data. The company thus develops such kind of
visualisations and helps the company to build a strong relationship with their clients. The
different stakeholders who are involved within the company such as the CEO, Board of
Directors, managers and different other employees can be discussed as the target audience of the
company.
The other concerned target audience are the different executives at the senior
management level of Sony Corporation. The company is based in America and is primarily
managed by Sony Corporation of America (SCA). The company has established their strong
roots in the market and have thus developed their business presence despite the different forms if
fluctuations that have been made within the music industry. They have provided their dataset,
which further helps the other company in visualising the data for Sony.
tabler-icon-diamond-filled.svg

Paraphrase This Document

Need a fresh take? Get an instant paraphrase of this document with our AI Paraphraser
Document Page
4SONY DATASET ANALYSIS
With the development of the dashboard, it would be helpful for Sony to visualise their
different kind of business presence and the core activities that are performed by them. The
development of the dashboard would help the company in performing detailed analysis of their
present business conditions. This would also help them in predicting the future outcomes for the
business. Hence, with the developing of the dashboard, I have been able to gather knowledge
about the various kind of insights that have been made. It was really enthusiastic to understand
the correlations between the data present within the dataset.
Document Page
5SONY DATASET ANALYSIS
Page 2: DATA ELEMENTS
The different data elements that are present within the dataset produced by Sony are
discussed as:
1. Album No. – Each album that is release by the company has to be provided with a
unique ID that would help for distinguishing among the several albums. The Album No. provides
a unique number for every album. With the help of providing a unique IT to each album, it
would be helpful for distinguishing among the different albums. It would provide an ease to
identify a particular album and thus perform a useful visualisation.
2. Adverts Sony would perform different forms of advertisements based on
popularising their albums. These advertisements are mainly presented before the public on a
prior basis and are mainly intended for attracting a large number of public.
3. Sales – The Company would also calculate the total number of sales that have been
made by them after the release of their albums. This column in the dataset discusses the total
number of sales made by a particular album after the initial release within the international
market.
4. AirPlay – This column depicts the total number of times an album would be played on
the Fox Radio prior to one week of release. Fox Radio is defined as the biggest national radio
station present within the U.S and is the main centre from which the songs are played.
5. Attract – This column helps in depicting the attractiveness of the singer based within a
certain range from 1 to 10. In the range of 1 to 10, 1 depicts that the band or singer is not
attractive at all while 10 depicts that the band or singer would be very attractive in nature. Based
on ratings of the people, the range has been set up.
Document Page
6SONY DATASET ANALYSIS
6. Price – The price of the album is selected in this column. The price mentioned in the
column is depicted in Australian dollars.
7. Gender – The gender column helps in depicting the particular gender of the singer of
the particular album.
8. Streaming Services – Spotify and Pandora are defined as two online music platforms
that are mostly used by music lovers. The defined column lists whether a particular album is
available on Spotify, Pandora or is neither available on both of these platform.
9. Piracy – There might be different cases of piracy based on the download of albums
after they have been released on the international platform. This column depicts the total number
of pirated form of downloads of any particular album that have been made after the first two
weeks of their initial release.
10. Top20 – In this section, there is a listing of the Top 20 best albums that have made
their presence in the list of Billboard Top20. The column depicted in the dataset puts focus over
the fact whether a certain album would be available in the Top20 list.
11. Age – This column depicts the age for the singer of any particular album.
12. No. Previous Albums – This column depicts the total number of albums that have
been released from a particular band or singer.
13. iTunes Download – This number shown in the dataset depicts the total number of
downloads that have been made from iTunes during the initial two weeks of release of a
particular album.
tabler-icon-diamond-filled.svg

Paraphrase This Document

Need a fresh take? Get an instant paraphrase of this document with our AI Paraphraser
Document Page
7SONY DATASET ANALYSIS
14. Genre – The column depicts the particular genre of music for a particular album.
There are many people who prefer to listen music based on a particular genre. Hence, this
column could help in the visualisation about which people would prefer which form of music.
15. Year Released – Each album would have their own year of release. Hence the
particular column helps in the listing about which album would have been released in which
year.
16. Language – There might be different languages for the albums that have been listed.
The column helps in understanding the language for every particular album.
17. Country – The column for the country depicts the country of origin for any particular
singer or band.
After understanding of the description from the data, the classification of data would be
performed. The classification of data would be based on categorical, numerical and other
different forms of measurements.
Data Classification of Data
Album No Numerical
Adverts Numerical
Sales Numerical
Airplay Numerical
Attract Numerical
Price Numerical
Gender Categorical
Streaming Services Categorical
Piracy Numerical
Top20 Categorical
Age Numerical
Document Page
8SONY DATASET ANALYSIS
Page 3: THE RIGHT FIT
In order to visualise the data gathered from any company, the use of charts and graphs are
mainly used for finding the correlations between the data gathered and the facts to be made.
There are various kind of charts that might be used in order to perform visualisation over data.
Some of these charts include line graph, column chart, bar graph, bubble chart, area chart, scatter
plot chart, bullet chart and waterfall chart.
Different charts are presented for performing visualisations over the gathered data. Bar
charts have been used during the presentation of the dashboard. This kind of clear process helps
in labelling each of the columns. The use of topographic map have also been presented for
depicting the different kind of signs based on presenting them over a map.
Document Page
9SONY DATASET ANALYSIS
Page 4: ETHICS
With the use of data, the there is a huge need for considering the ethical perspectives of
the data. The gathered from any company should be kept secure and protected so that it would
not be handled by unauthorized users. A proper use of ethical considerations should be put in
proper place in order to maintain the integrity of data while they are being handled by another
company.
The company performing analysis over the data should maintain the factors of privacy,
breaches in confidentiality and consideration of the objective present within the market. The data
scientists who perform detailed analysis over a wide range of databases should consider the use
of different ethical tools for bringing benefits for a company. There are many form of storage,
collection and protection of data that are present within the databases. During performing
visualisation of the data, the various ethical issues that are taken in consideration are:
1. The ethical form of responsibility that are defined by a company to their customers.
2. The ethical form of responsibilities that are present between the company and their
customers.
3. The ethical responsibilities that are defined for customers towards the company.
The various kind of ethical responsibilities that are presented by companies revolved
around the collection of important data from customers and correction of errors that are present
within the data presented by customers. However, on the other hand, the ethical kind of
responsibilities that are presented for employees is based on the facts that these employees
should not perform browsing over censored data and thus disclosing them to third party vendors
tabler-icon-diamond-filled.svg

Paraphrase This Document

Need a fresh take? Get an instant paraphrase of this document with our AI Paraphraser
Document Page
10SONY DATASET ANALYSIS
without a proper kind of authorisation. These kind of ethical considerations would be presented
during the performing of visualisation over the gathered data from Sony dataset.
B) Solution Component
1) Live Dashboard
2) Story telling
(Figure 3: Country, Sum of iTunes Download and Sales)
(Source: Created by author)
Symbol maps are used for depicting this particular chart. This chart helps in visualising
the particular country of origin of a band or singer. It also depicts the total sum of iTunes
downloads from that country and the total number of sales that have been made in the particular
country. There has been a varied use of colours that have been used for understanding the
Document Page
11SONY DATASET ANALYSIS
content of the visualisation. The sum of iTunes downloaded are presented in the range of 33,000
till 57,28,447. There is no use of hierarchy that is being used for presenting the visualisation. The
interactive components that have been used in the visualisation is the use of different mode of
colours. The golden colour is used for depicting the lowest range of iTunes downloaded and
violet colour is used for depicting the topmost range of iTunes downloaded.
(Figure 4: Genre, Adverts and Top 20)
(Source: Created by author)
Horizontal bars have been used for the depiction of the visualisation over the presented
data. This chart helps in providing a brief form of understanding about the total number of
adverts and the genre of music for which the adverts had been raised. In this chart, the Top 20
tracks that have appeared on the Billboard list have been depicted. The colours have increased
the enhancement of the factors that needs to be understood. Hierarchy has been used for
depicting the visualisation. This hierarchy is based on the total number of genres into which the
chevron_up_icon
1 out of 19
circle_padding
hide_on_mobile
zoom_out_icon
[object Object]