Project: Analysis of South Australian Household Housing Stress Data

Verified

Added on  2022/08/26

|18
|1025
|11
Project
AI Summary
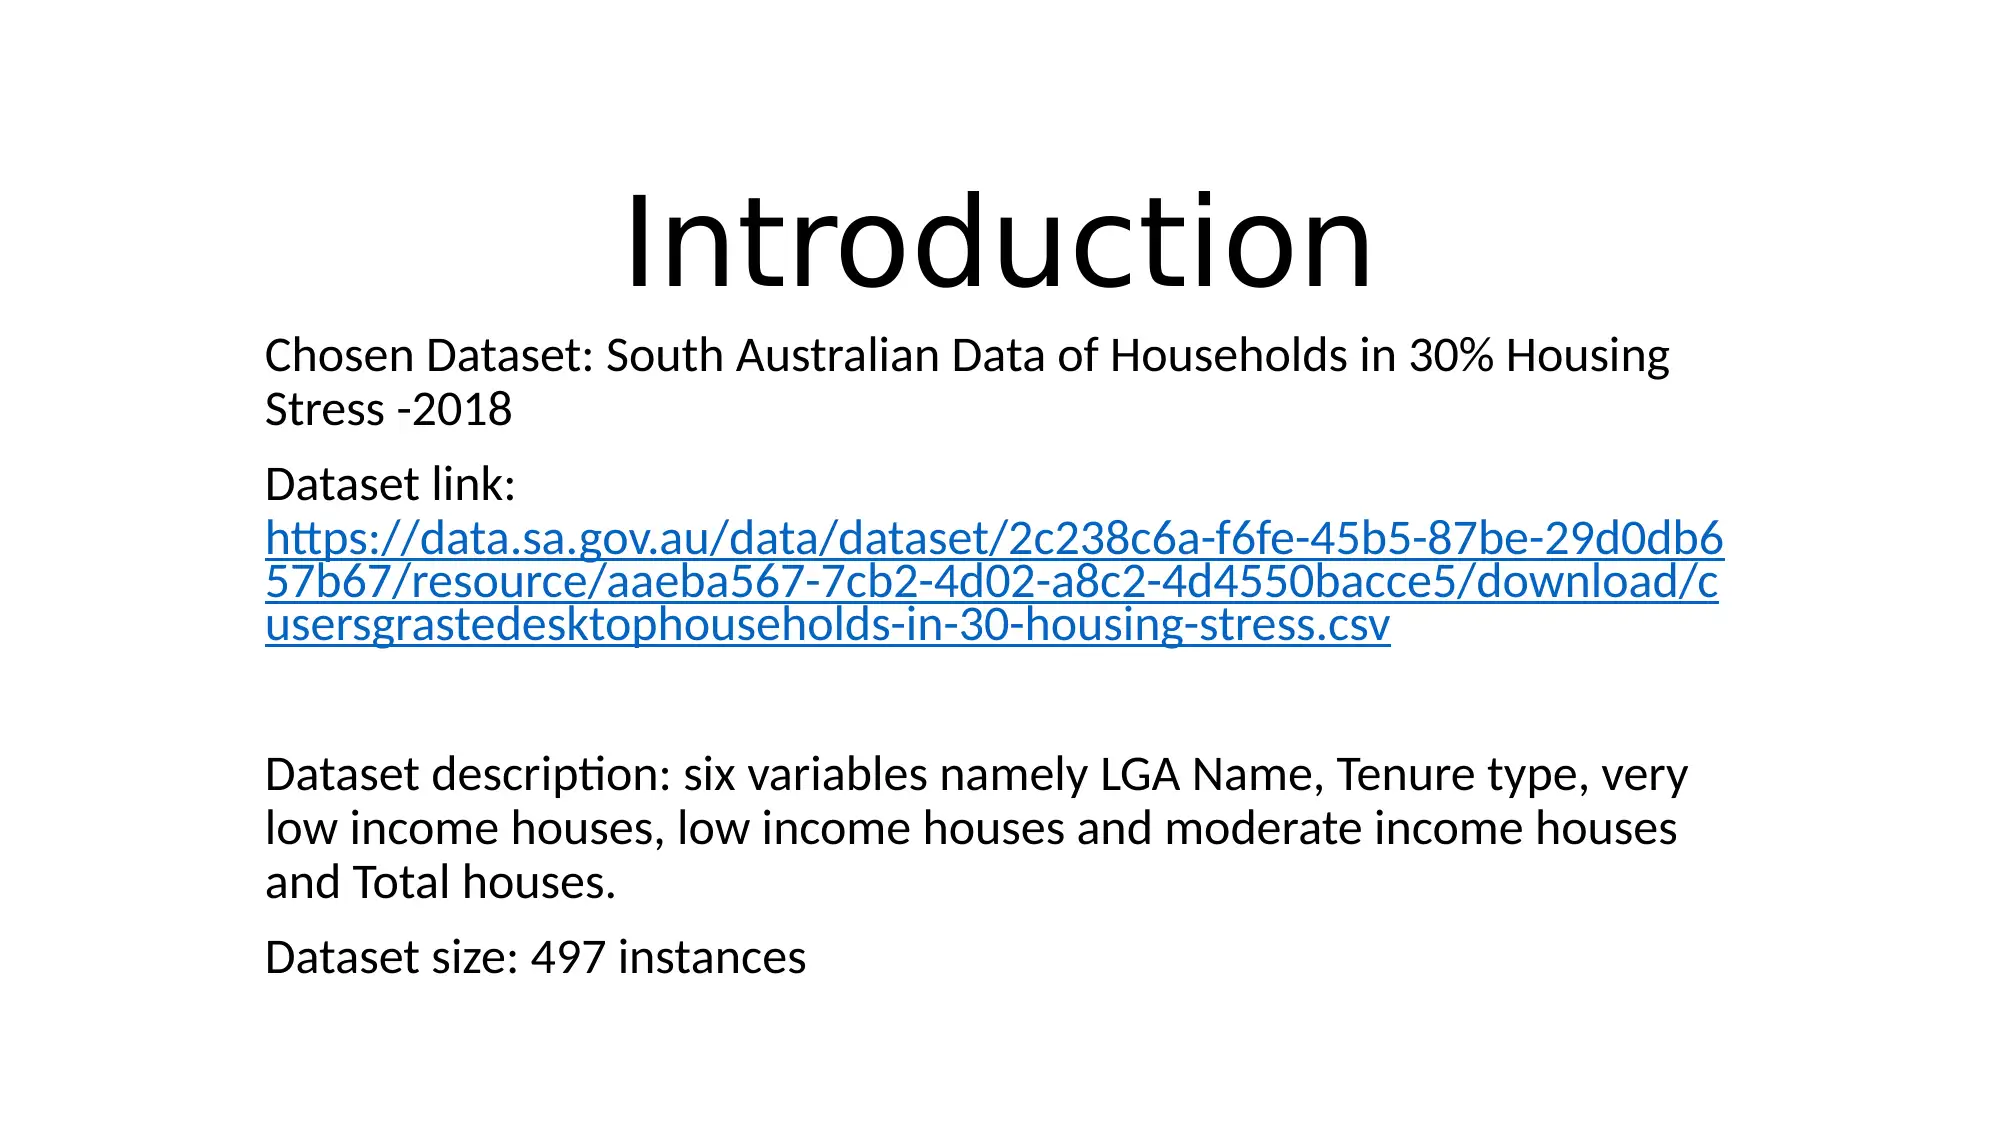
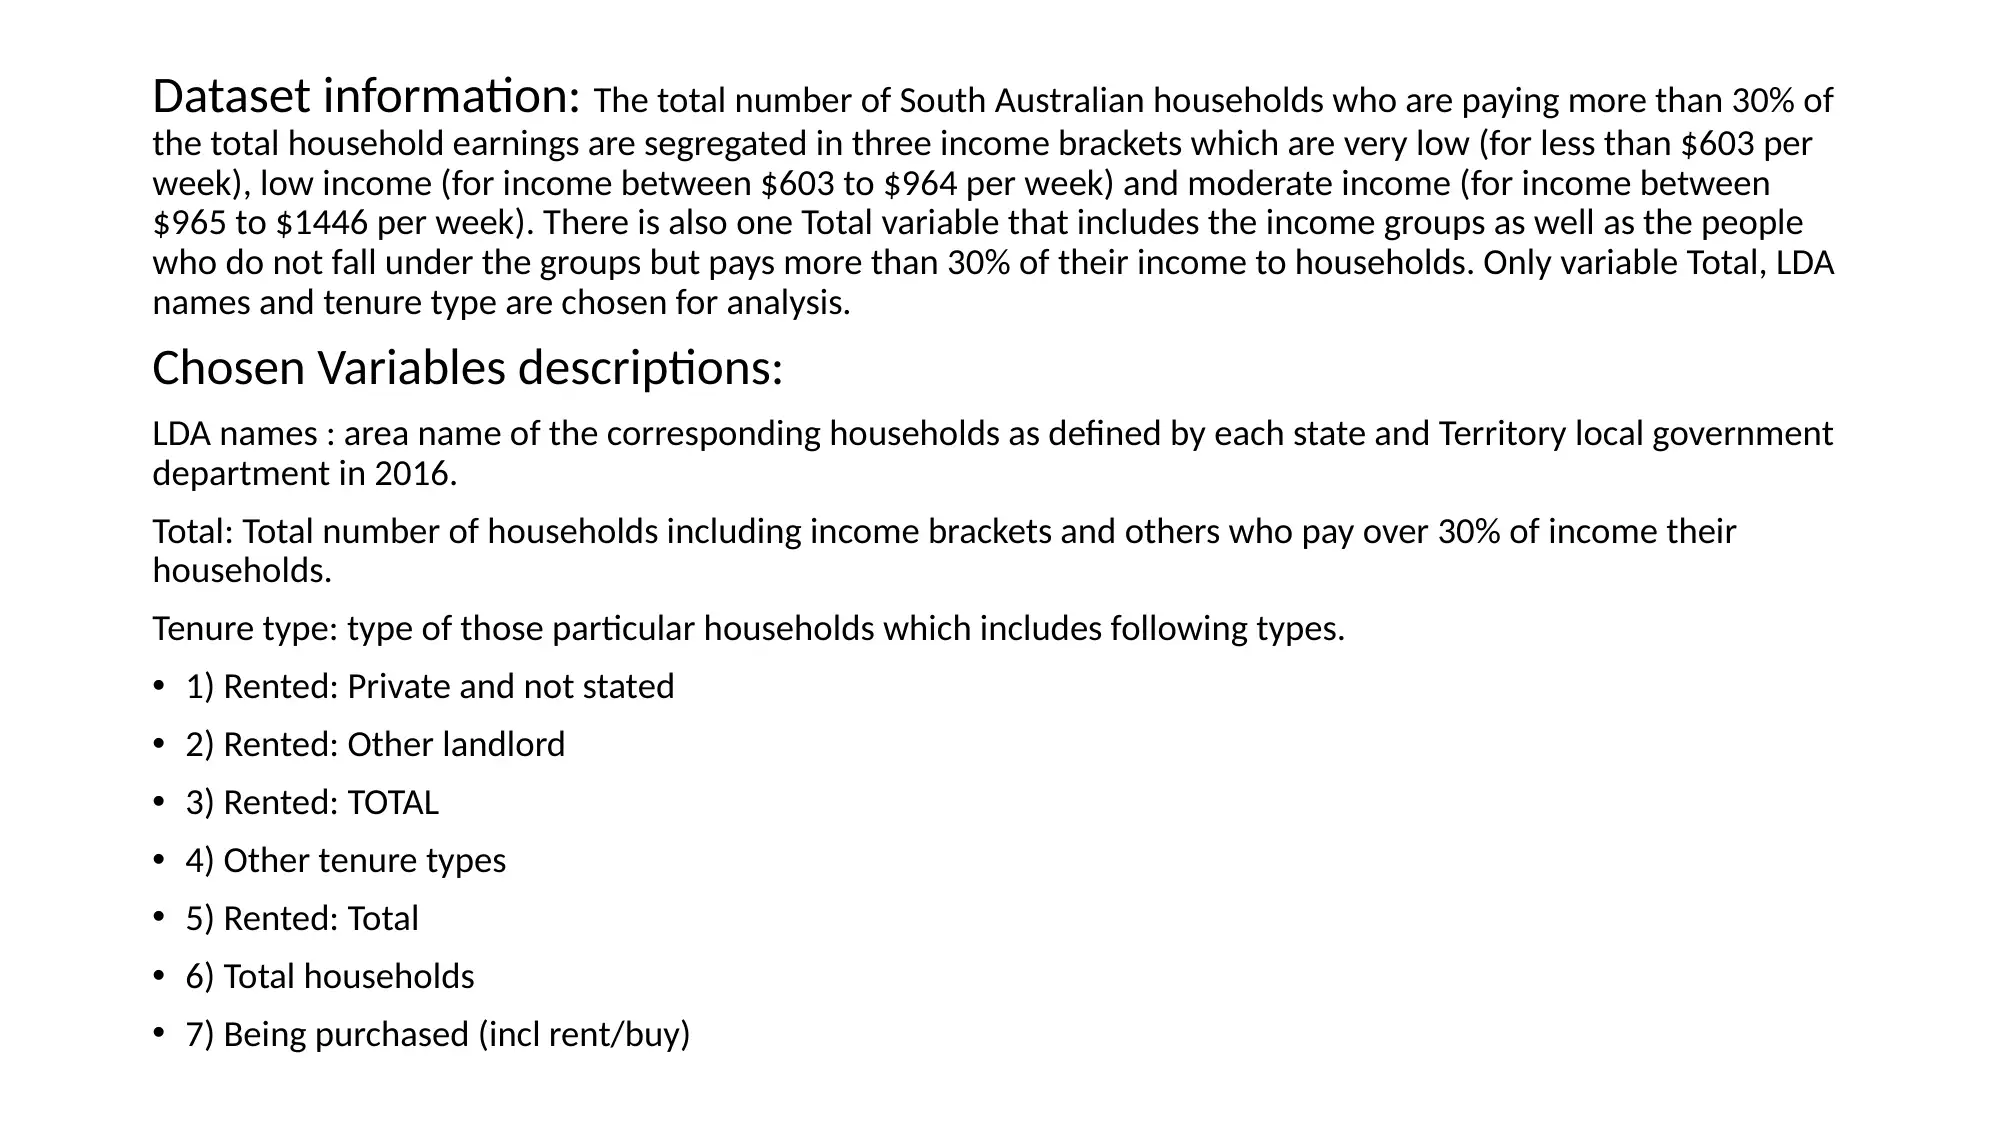
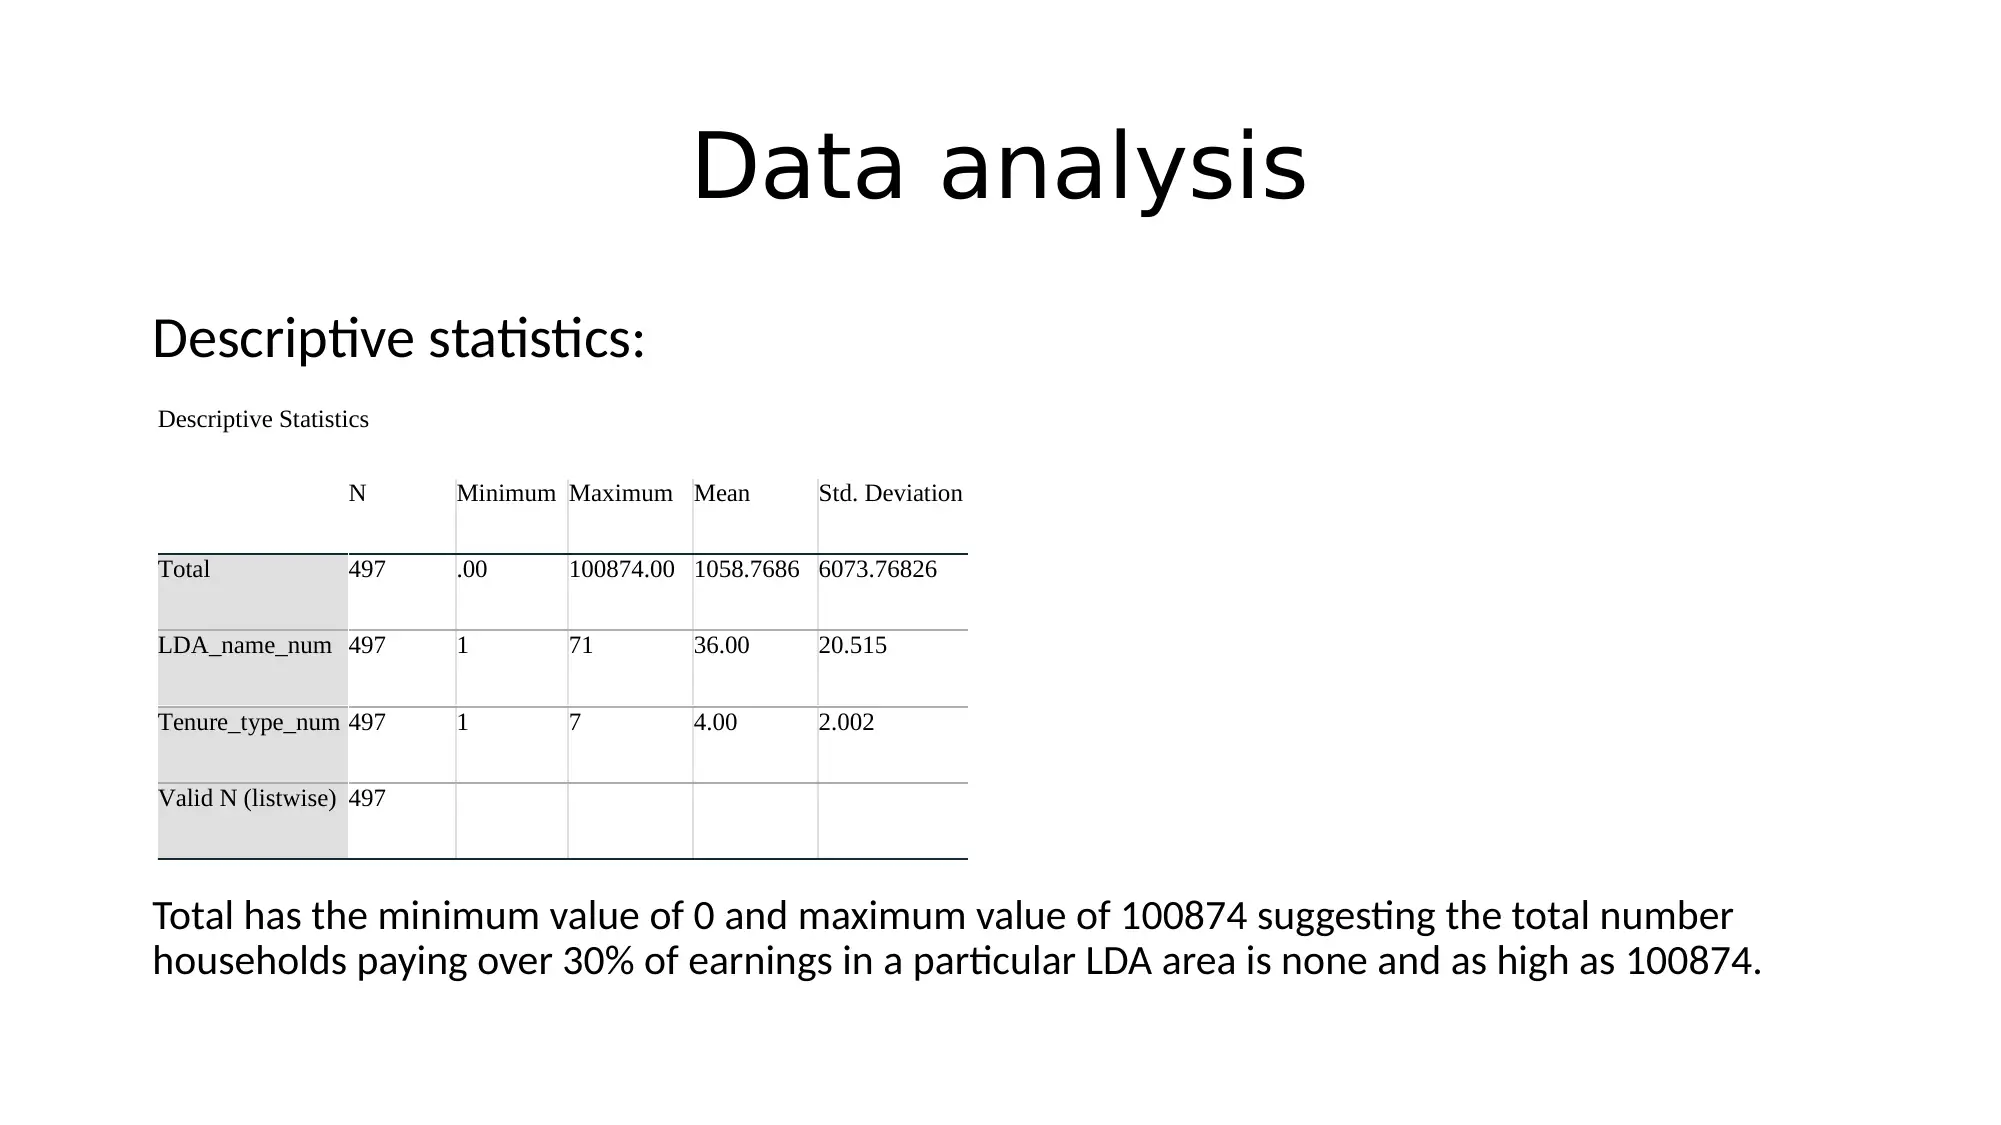
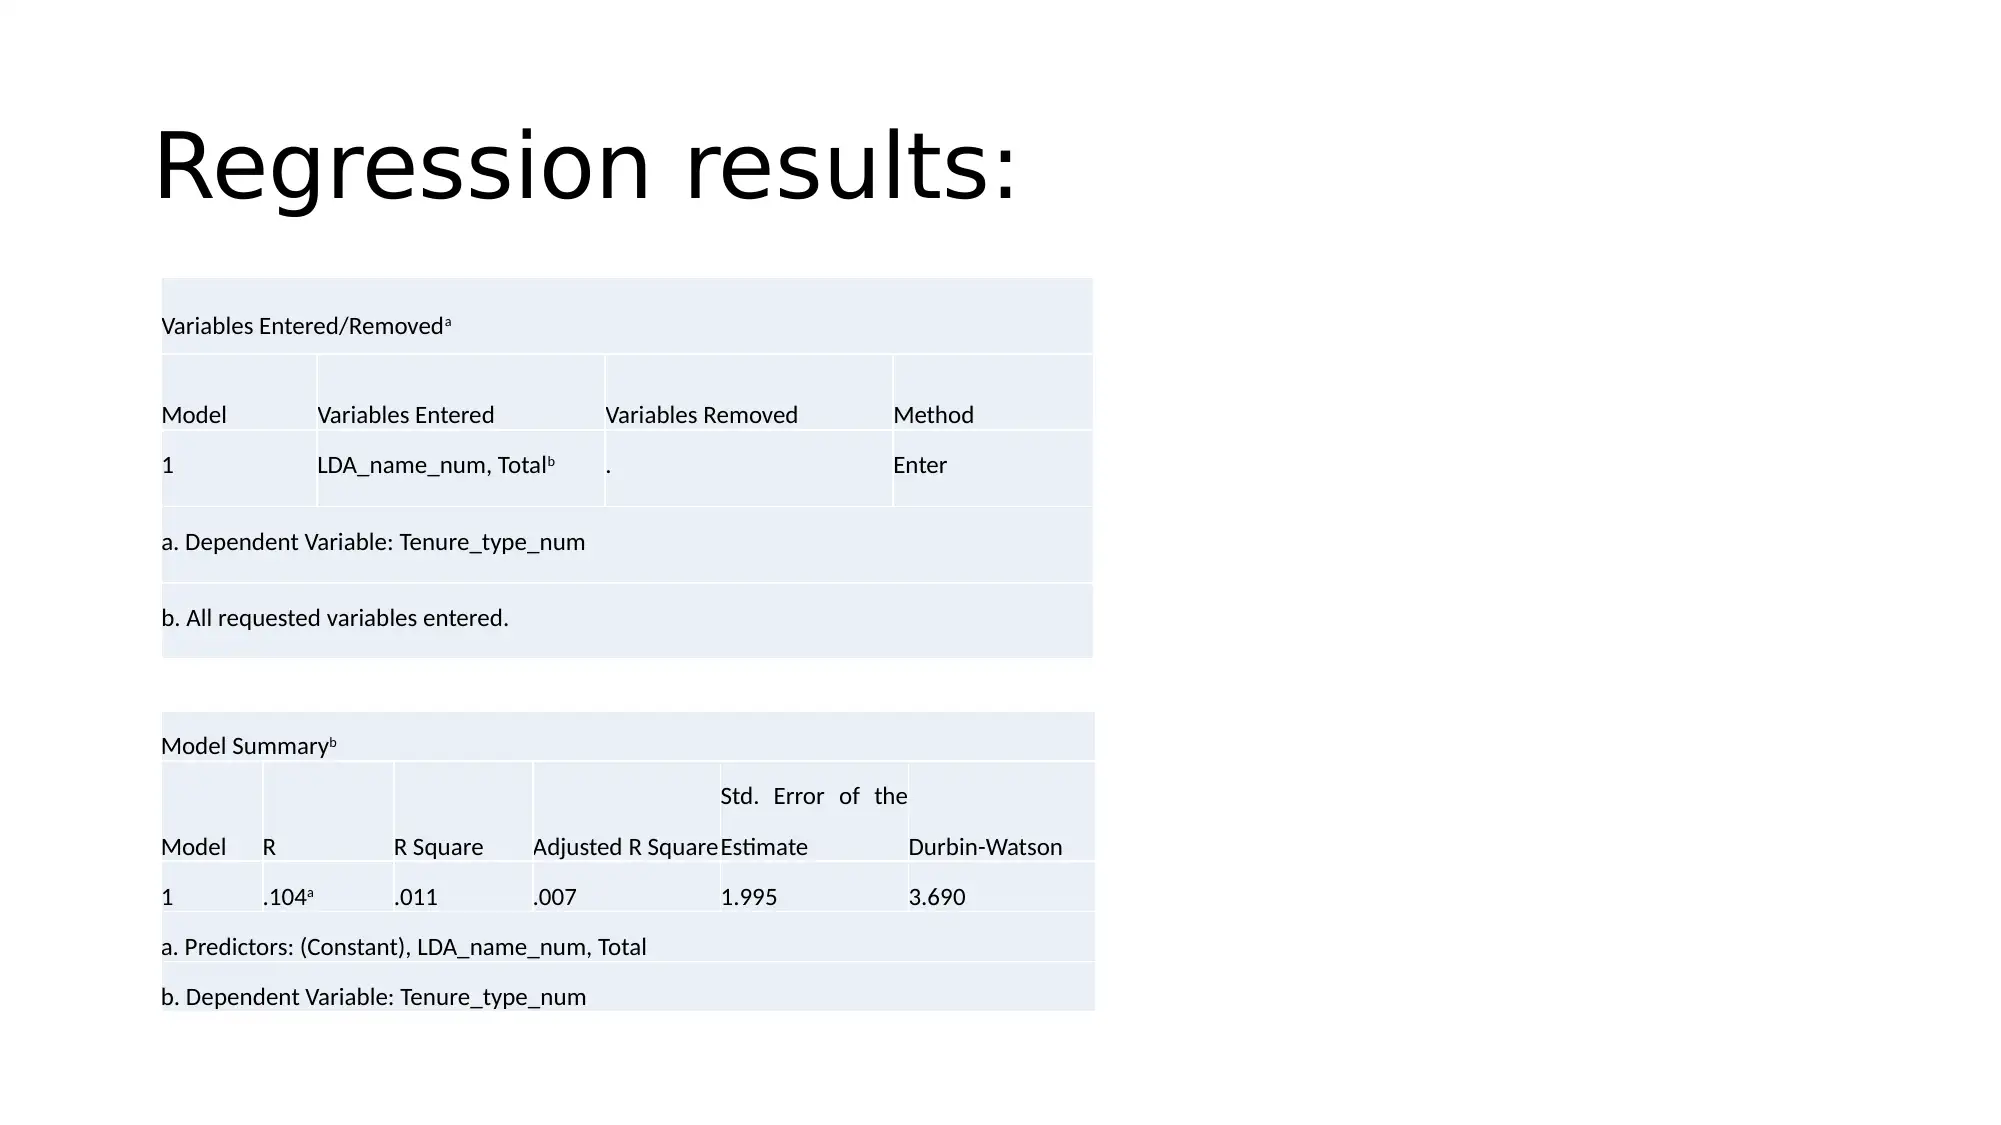
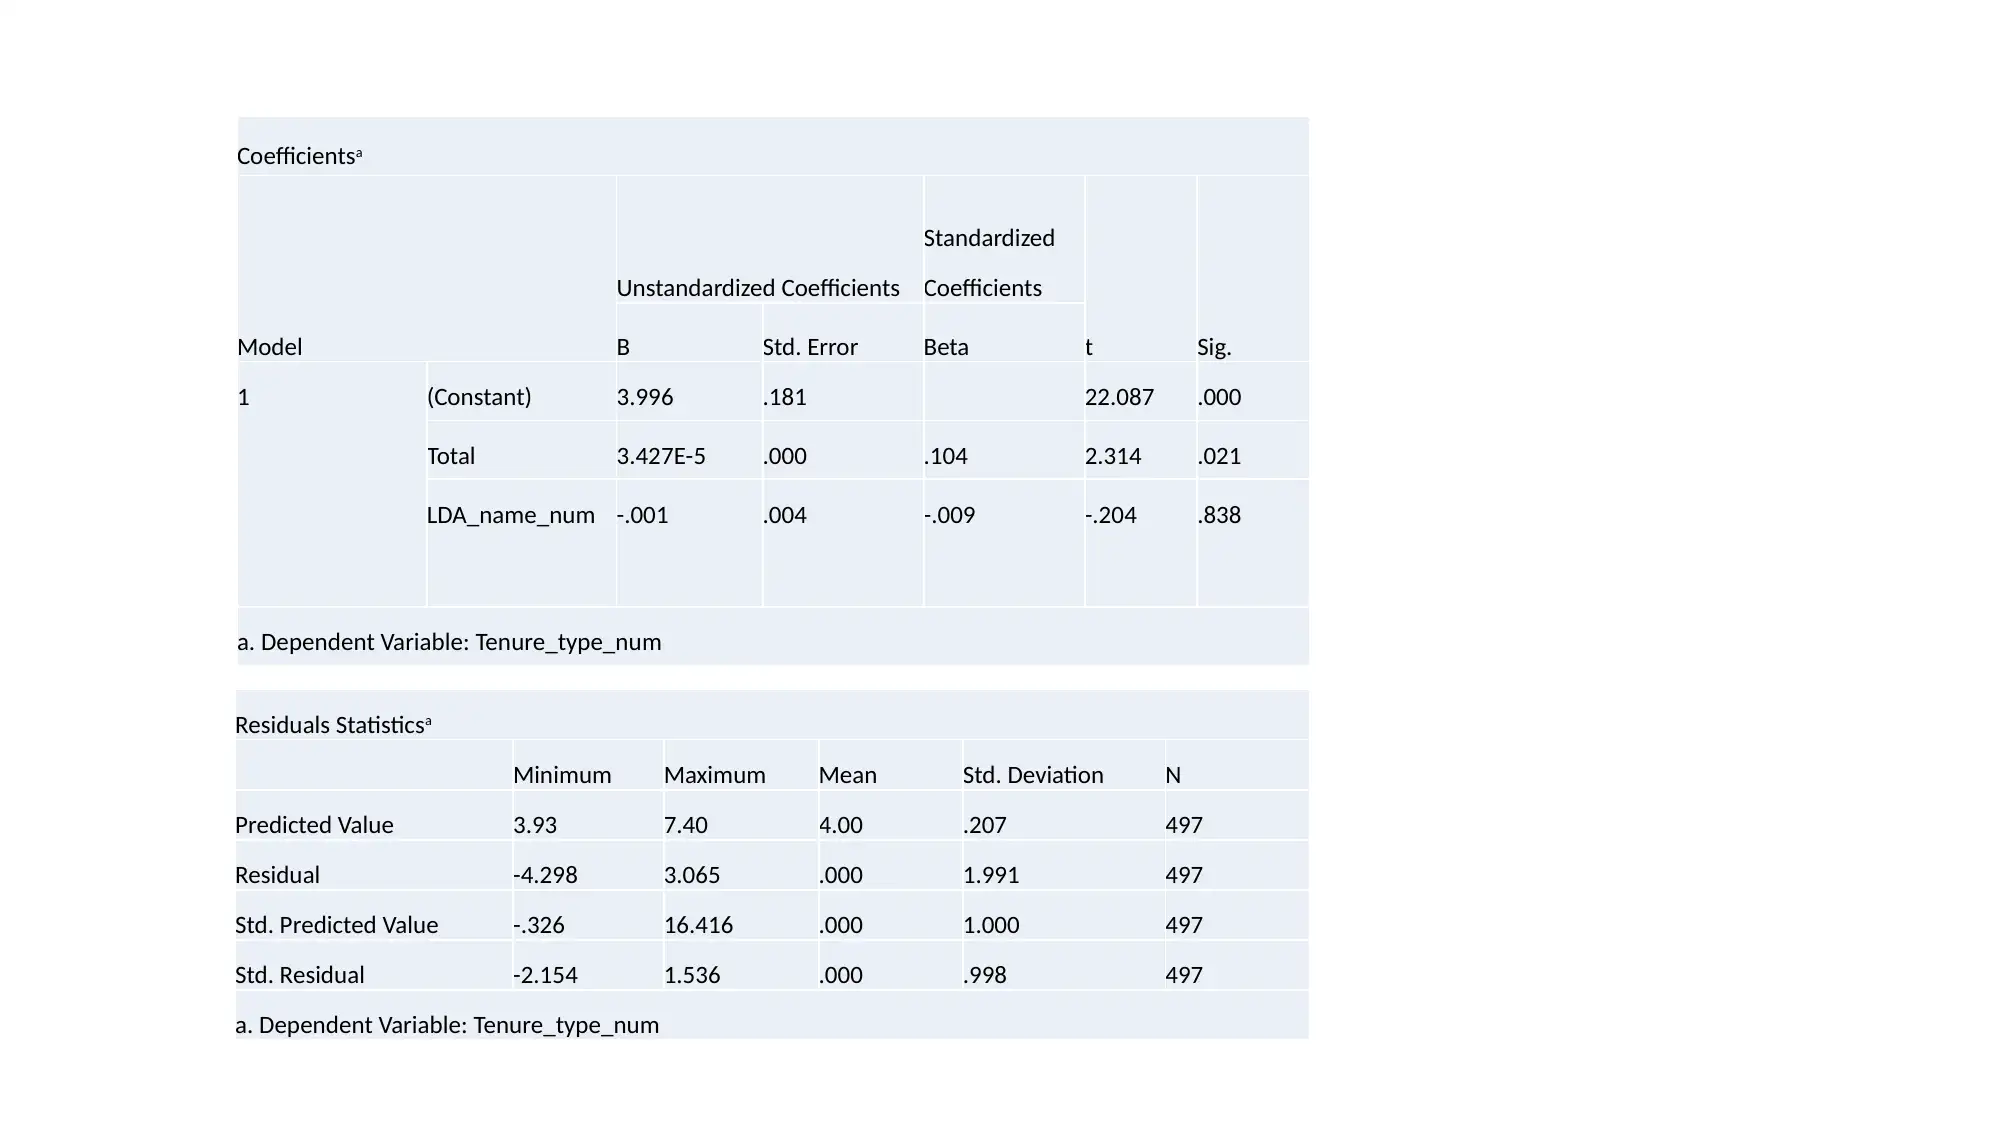
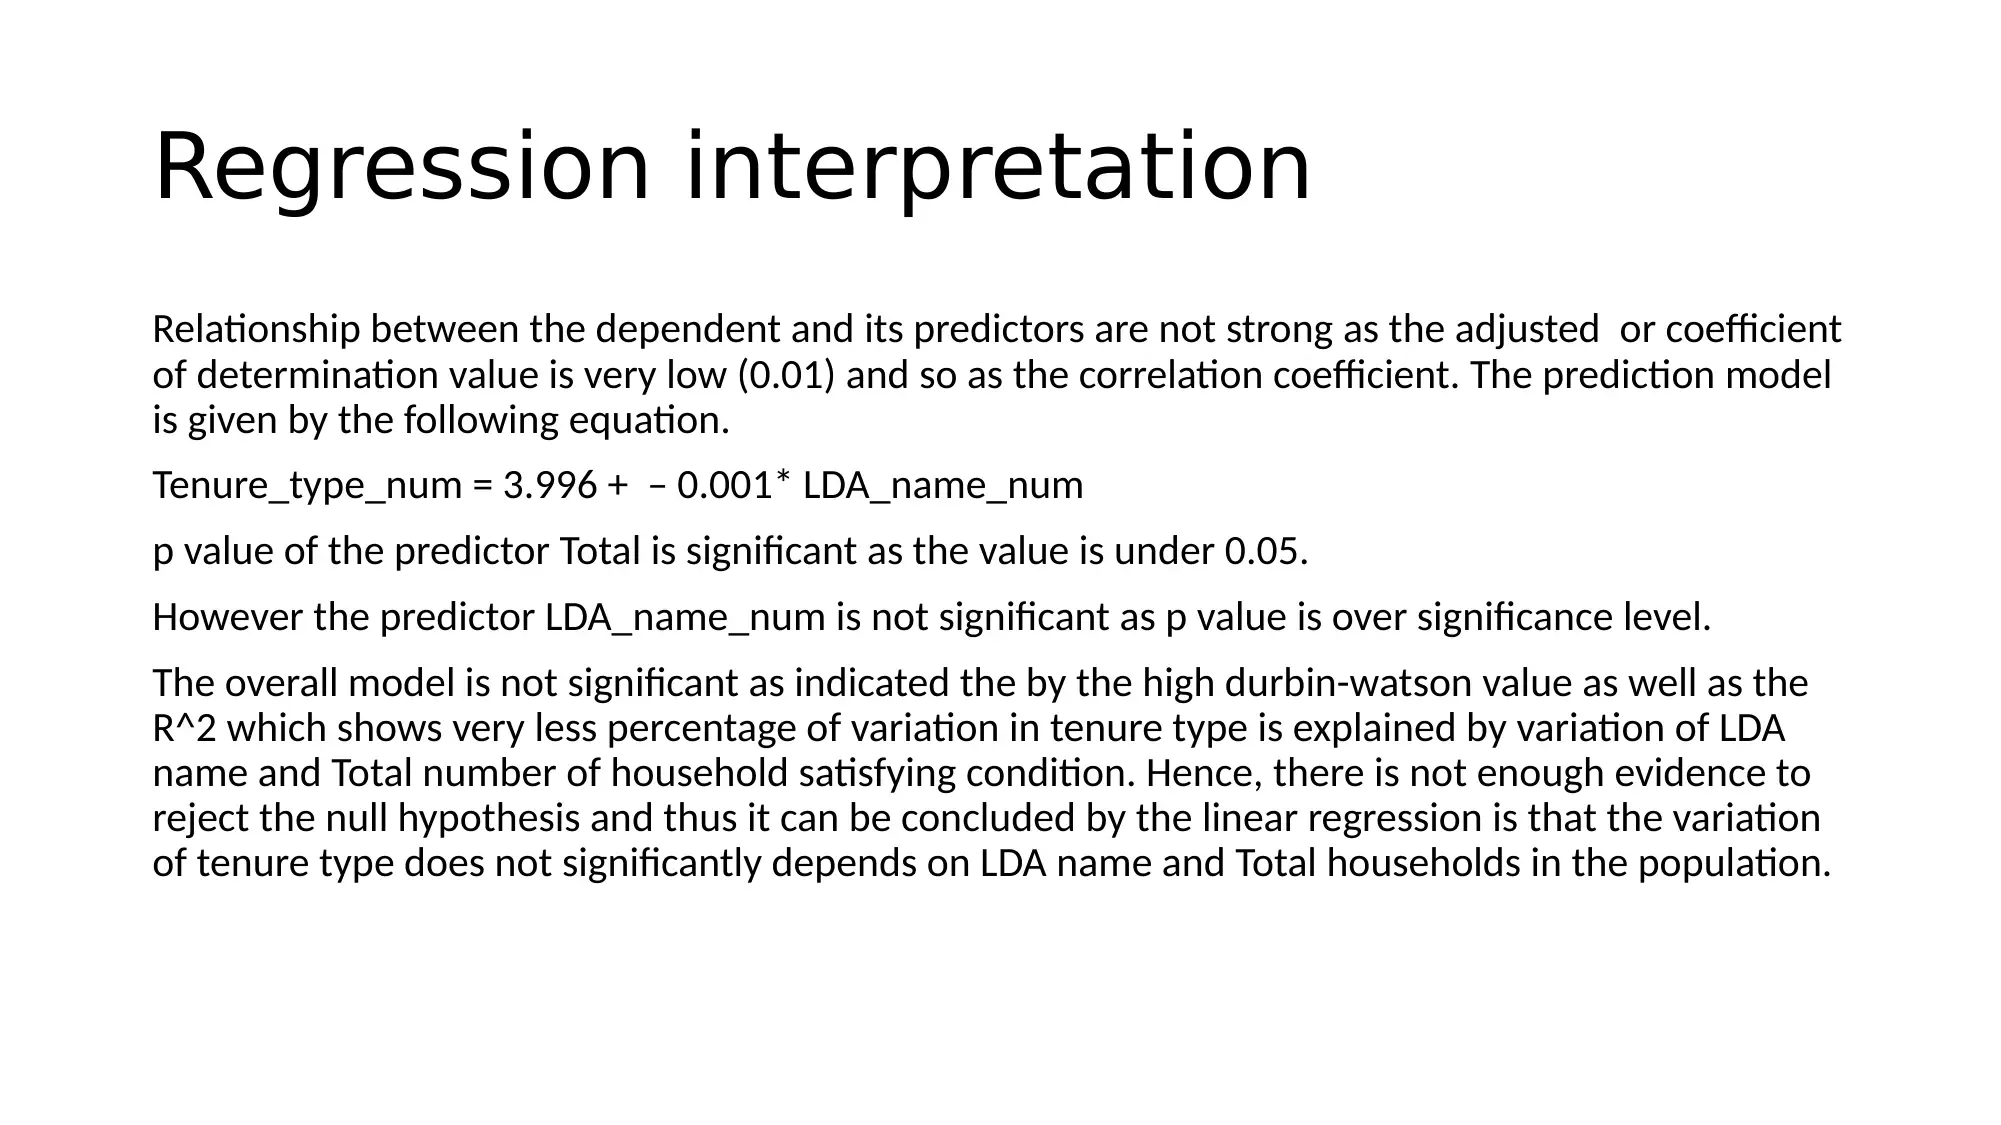
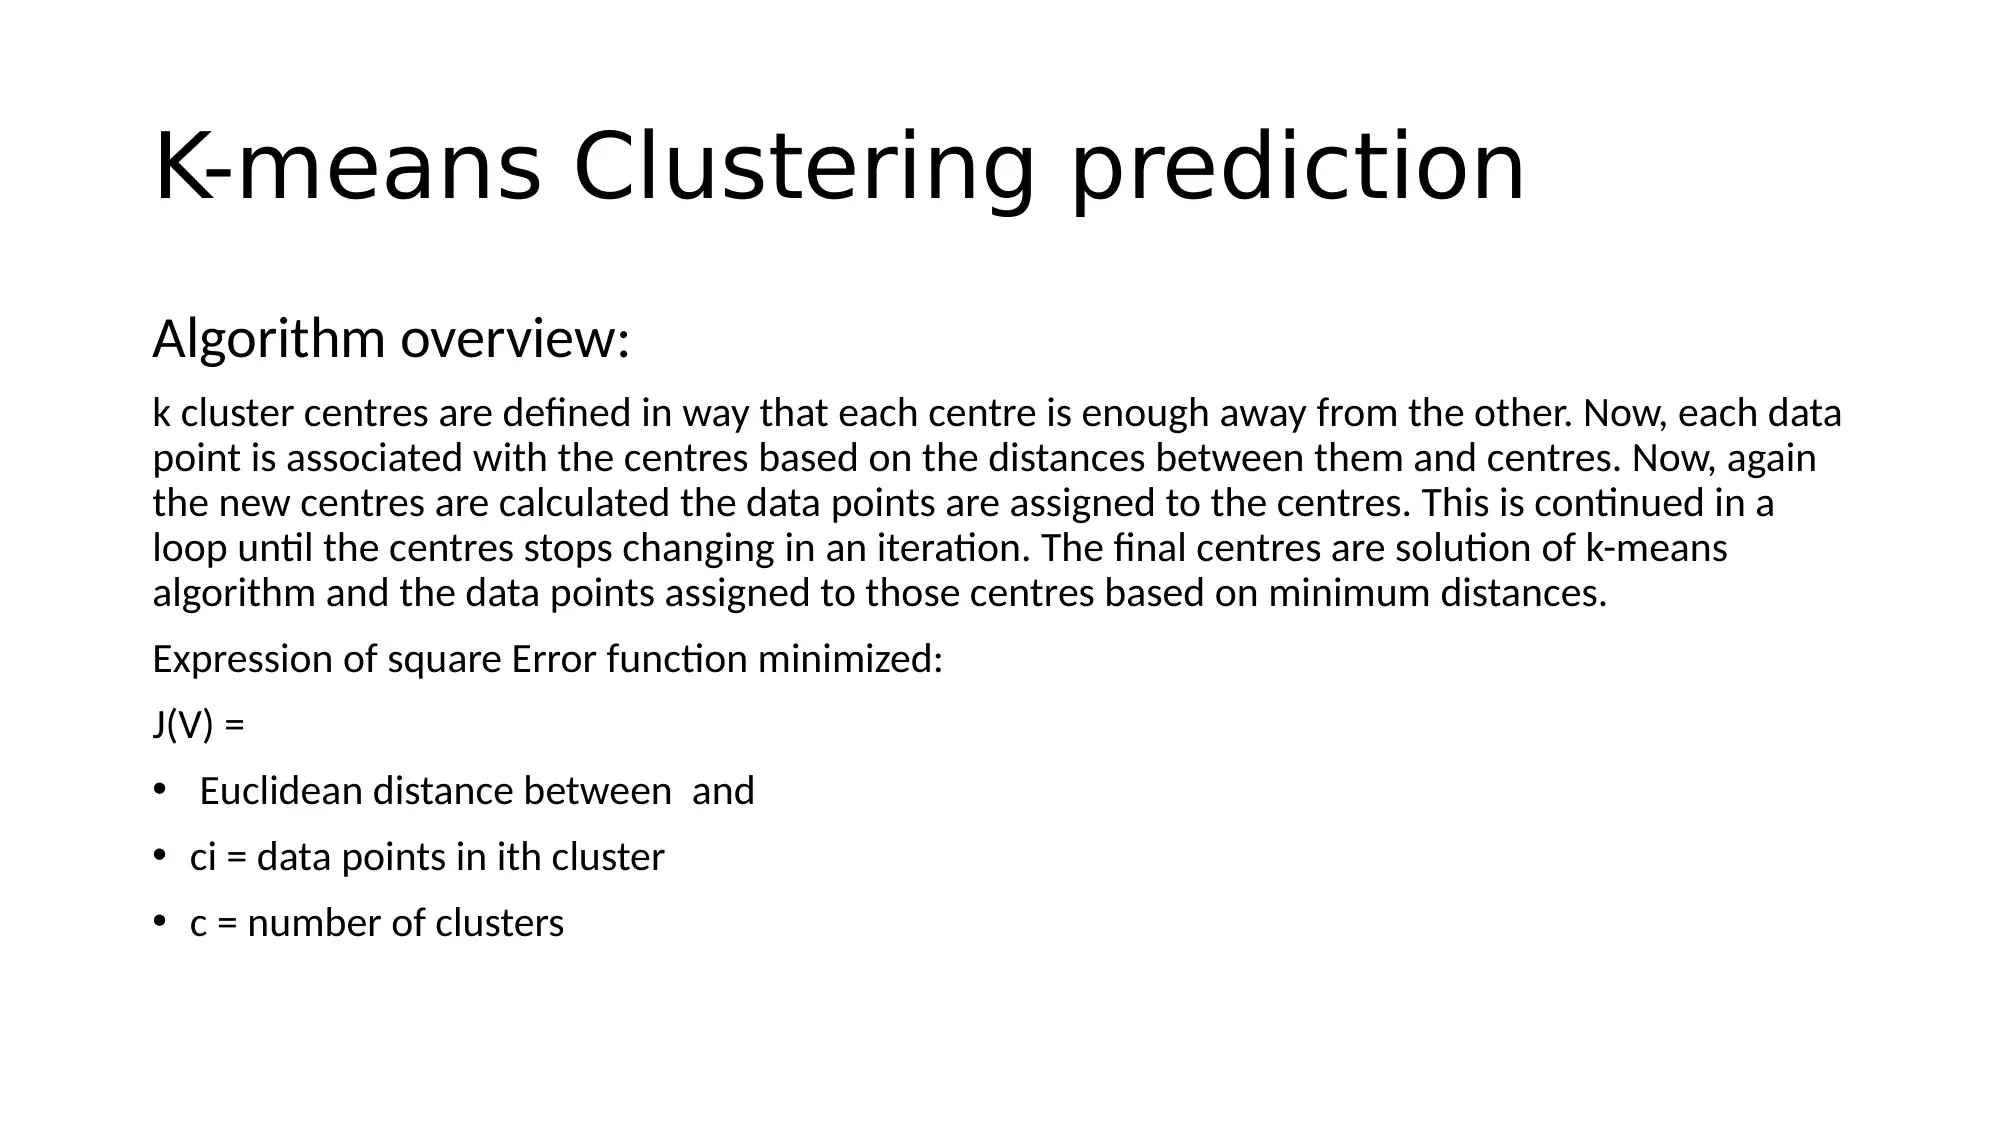
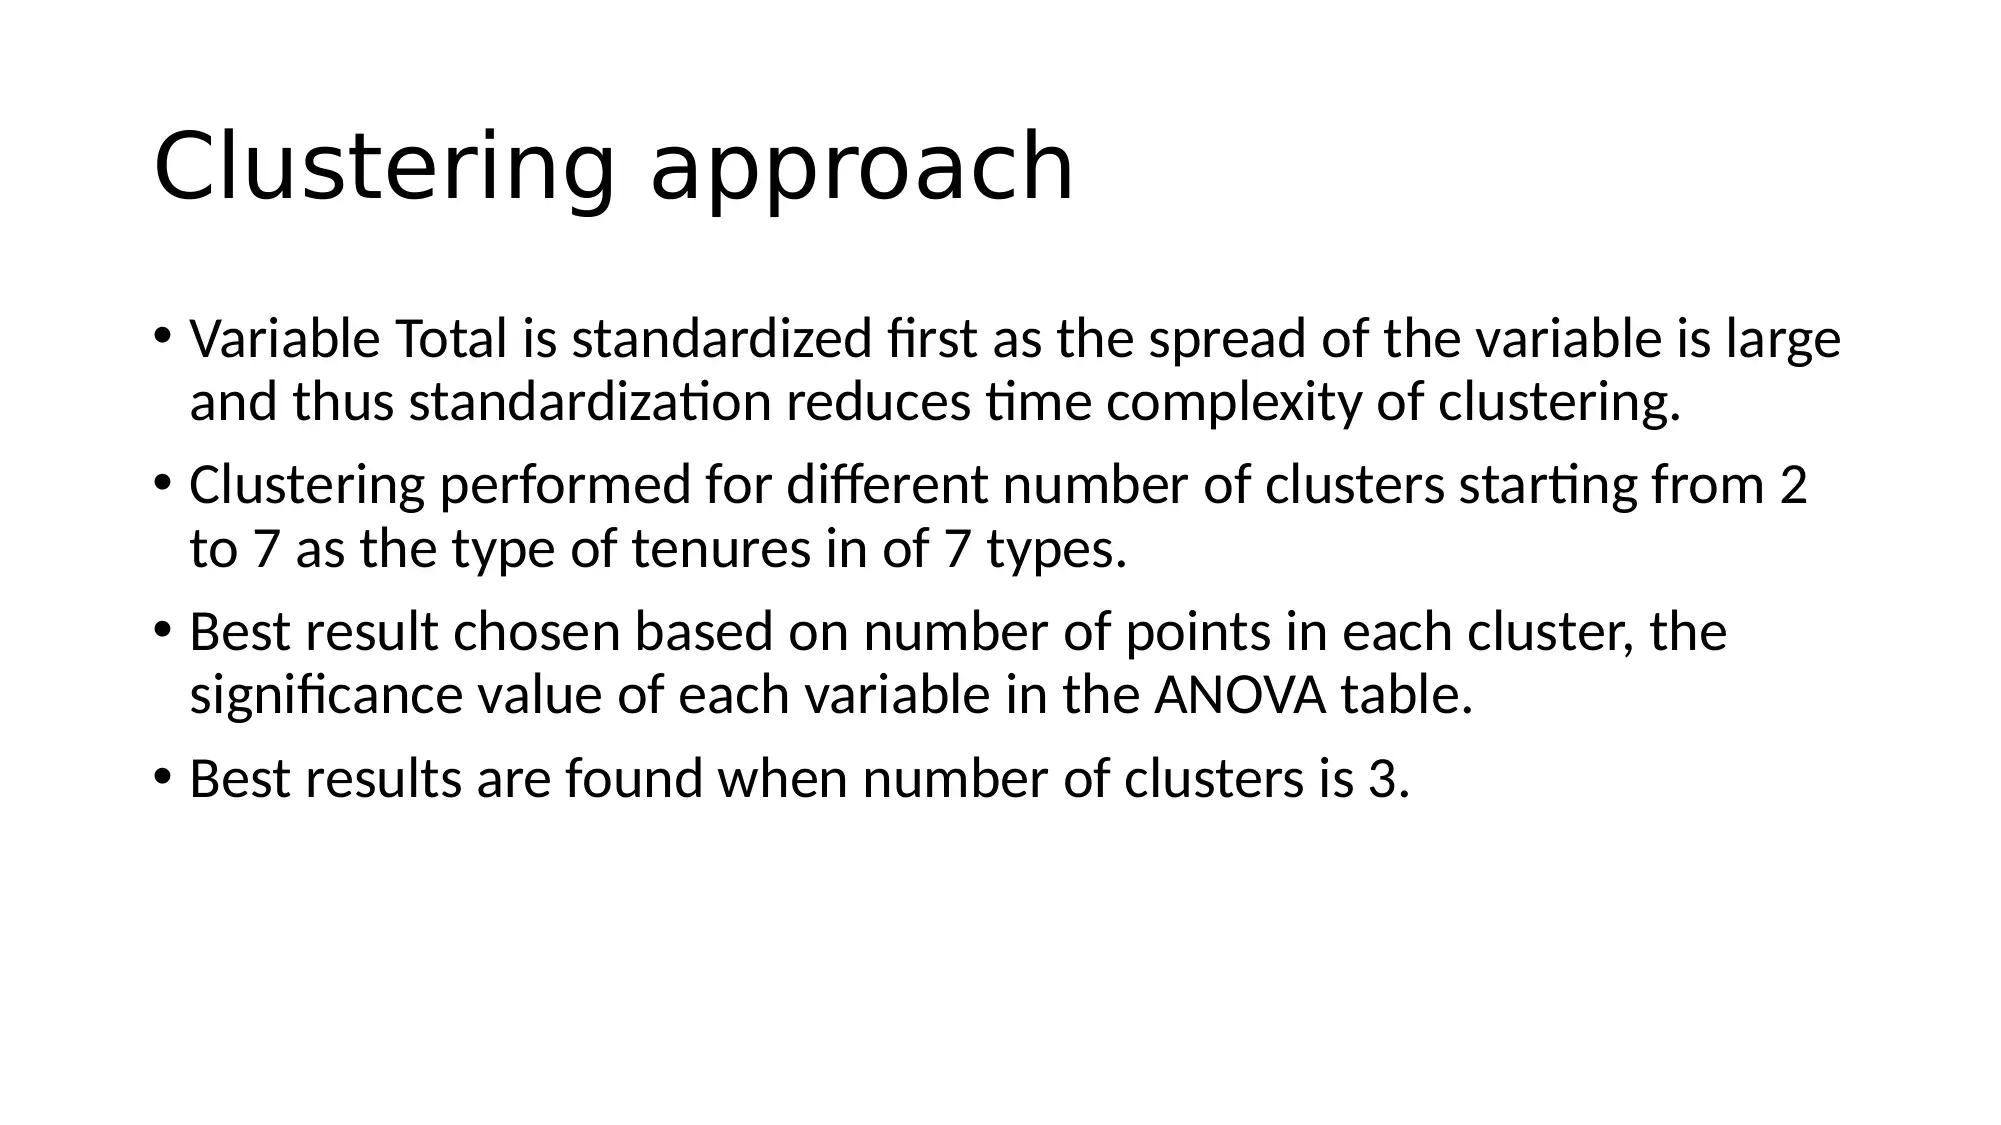
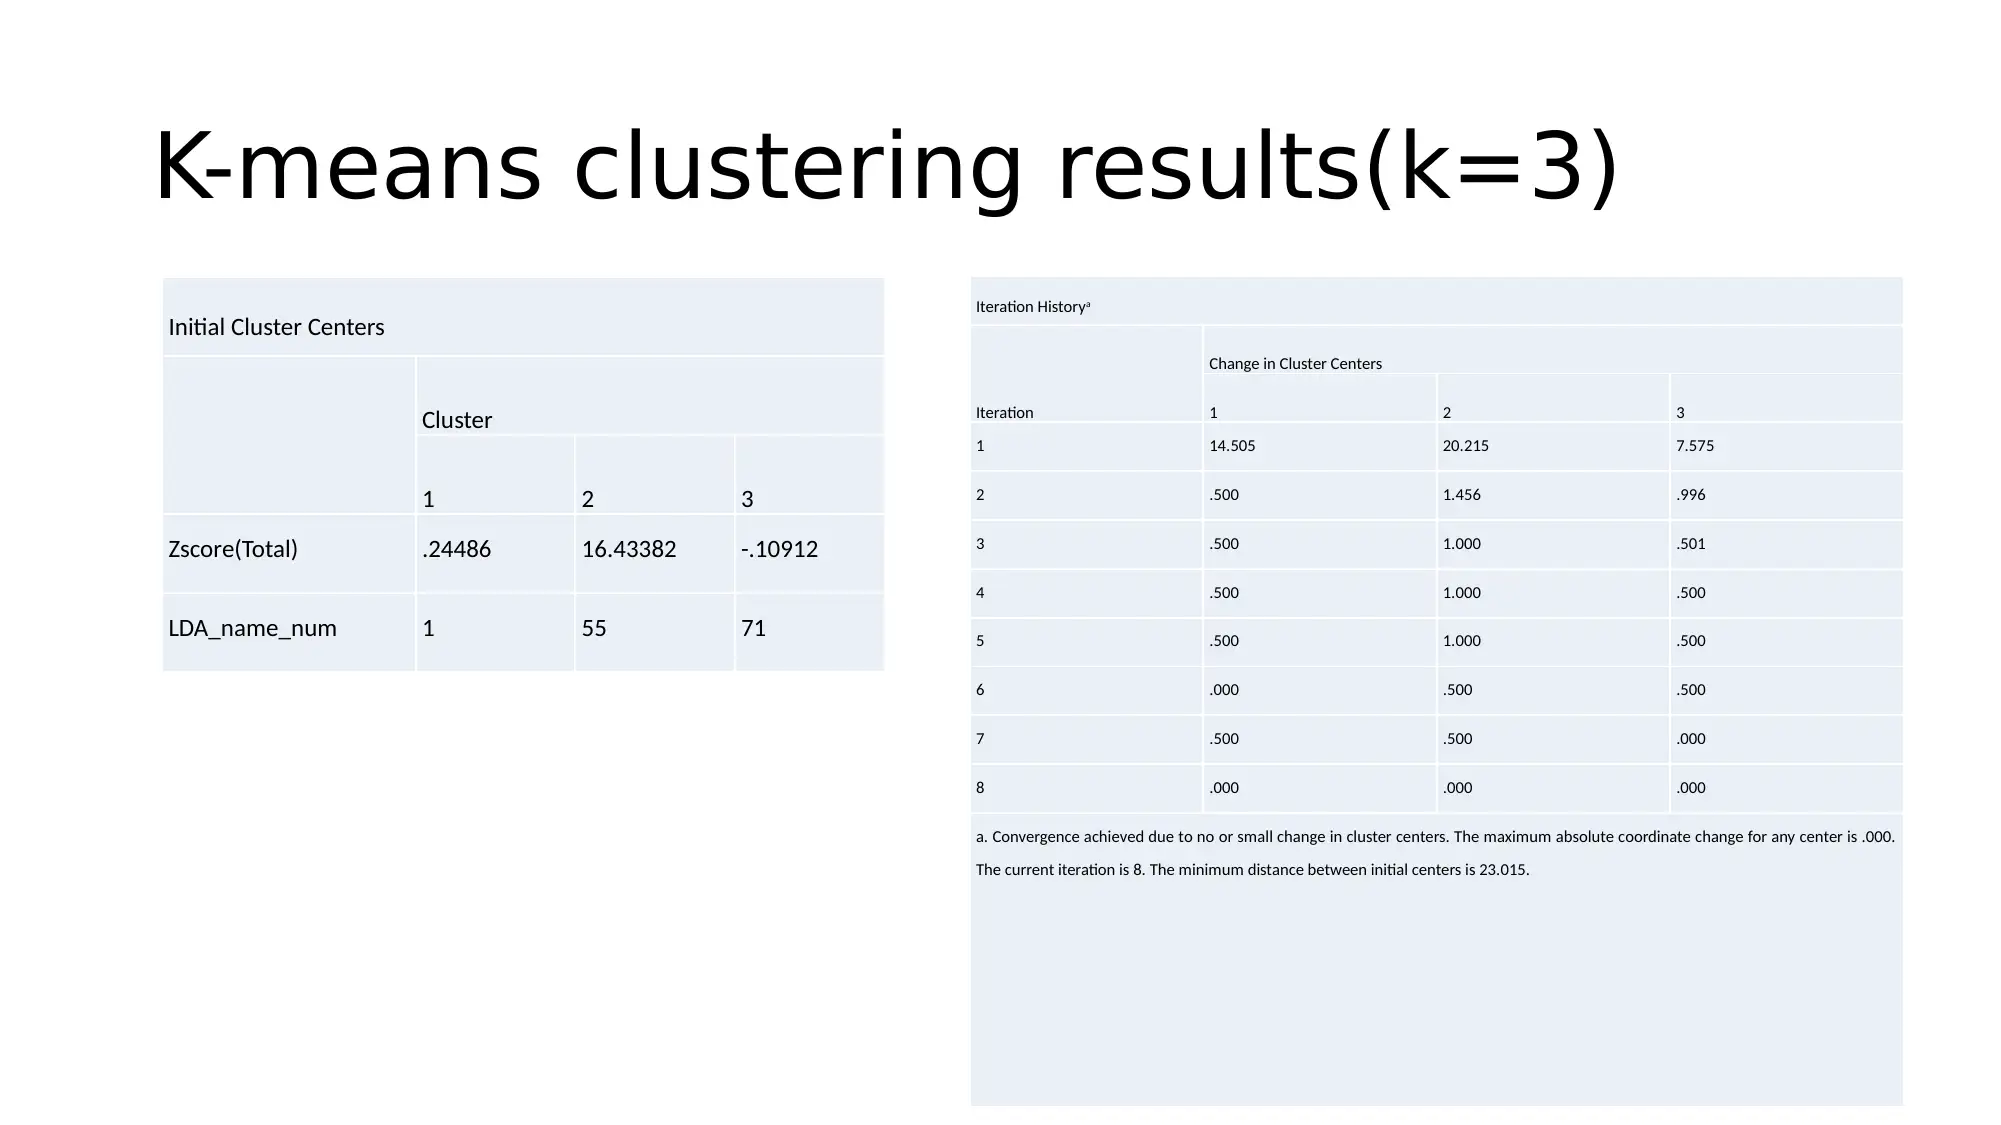
This project analyzes a dataset of South Australian households experiencing housing stress in 2018. The analysis focuses on three key variables: LGA names, tenure type, and the total number of households paying over 30% of their income on housing. The project employs both descriptive statistics and inferential methods, including linear regression and k-means clustering, to explore the relationships between these variables. The regression analysis investigates the dependency of tenure type on LGA names and total households, while the clustering approach groups tenure types based on the selected variables. The results suggest that tenure type has limited dependency on LGA names and that clustering provides a better prediction method for this dataset compared to linear regression. The project concludes with recommendations based on the statistical findings and suggests potential areas for further investigation.
Document Page
Assessment 4
tabler-icon-diamond-filled.svg

Paraphrase This Document

Need a fresh take? Get an instant paraphrase of this document with our AI Paraphraser
Document Page
Introduction
Chosen Dataset: South Australian Data of Households in 30% Housing
Stress -2018
Dataset link:
https://data.sa.gov.au/data/dataset/2c238c6a-f6fe-45b5-87be-29d0db6
57b67/resource/aaeba567-7cb2-4d02-a8c2-4d4550bacce5/download/c
usersgrastedesktophouseholds-in-30-housing-stress.csv
Dataset description: six variables namely LGA Name, Tenure type, very
low income houses, low income houses and moderate income houses
and Total houses.
Dataset size: 497 instances
Document Page
Dataset information: The total number of South Australian households who are paying more than 30% of
the total household earnings are segregated in three income brackets which are very low (for less than $603 per
week), low income (for income between $603 to $964 per week) and moderate income (for income between
$965 to $1446 per week). There is also one Total variable that includes the income groups as well as the people
who do not fall under the groups but pays more than 30% of their income to households. Only variable Total, LDA
names and tenure type are chosen for analysis.
Chosen Variables descriptions:
LDA names : area name of the corresponding households as defined by each state and Territory local government
department in 2016.
Total: Total number of households including income brackets and others who pay over 30% of income their
households.
Tenure type: type of those particular households which includes following types.
1) Rented: Private and not stated
2) Rented: Other landlord
3) Rented: TOTAL
4) Other tenure types
5) Rented: Total
6) Total households
7) Being purchased (incl rent/buy)
Document Page
Data analysis
Descriptive statistics:
Total has the minimum value of 0 and maximum value of 100874 suggesting the total number
households paying over 30% of earnings in a particular LDA area is none and as high as 100874.
Descriptive Statistics
N Minimum Maximum Mean Std. Deviation
Total 497 .00 100874.00 1058.7686 6073.76826
LDA_name_num 497 1 71 36.00 20.515
Tenure_type_num 497 1 7 4.00 2.002
Valid N (listwise) 497
tabler-icon-diamond-filled.svg

Paraphrase This Document

Need a fresh take? Get an instant paraphrase of this document with our AI Paraphraser
Document Page
Hypothesis:
Null hypothesis (H0): The variation of tenure type does not significantly depends on LDA name
and Total households in the population.
Alternative hypothesis (H1): The variation of tenure type significantly depends on LDA name and
Total households in the population.
Significance level: 5% significance or 95% confidence
Pre-analysis Data conversion:
LDA names and tenure type are categorical variables, hence they are first converted into numerical
variable for analysis using SPSS automatic recoding scheme. By the scheme tenure type is recoded
from lowest value in alphabetical manner and thus 7 tenures from ‘being purchased (incl rent/buy)’
to ‘Total households’ are recoded from 1 to 7. Also, the same scheme is applied for LDA names
where areas ‘Adelaide (C)’ to ‘Yorke Peninsula (DC)’ are recoded from 1 to 71.
Document Page
Linear regression modelling
General Multiple regression equation:
Y = a + b1*X1 + b2*X2 +…+ bk*Xk + e
Here, X1,X2,…,Xk are the independent variables, Y is dependent variable and e is the error term in
prediction which is also referred as residual.
Independents: LDA_name_num and Total (two)
Dependent: tenure type
Two variable model:
y = a + b1*X1 + b2*X2
Slope coefficients:
b1 =
b2 =
a = mean(y) – b1*mean(x1) – b2*mean(x2)
Document Page
Regression results:
Variables Entered/Removeda
Model Variables Entered Variables Removed Method
1 LDA_name_num, Totalb . Enter
a. Dependent Variable: Tenure_type_num
b. All requested variables entered.
Model Summaryb
Model R R Square Adjusted R Square
Std. Error of the
Estimate Durbin-Watson
1 .104a .011 .007 1.995 3.690
a. Predictors: (Constant), LDA_name_num, Total
b. Dependent Variable: Tenure_type_num
tabler-icon-diamond-filled.svg

Paraphrase This Document

Need a fresh take? Get an instant paraphrase of this document with our AI Paraphraser
Document Page
Coefficientsa
Model
Unstandardized Coefficients
Standardized
Coefficients
t Sig.B Std. Error Beta
1 (Constant) 3.996 .181 22.087 .000
Total 3.427E-5 .000 .104 2.314 .021
LDA_name_num -.001 .004 -.009 -.204 .838
a. Dependent Variable: Tenure_type_num
Residuals Statisticsa
Minimum Maximum Mean Std. Deviation N
Predicted Value 3.93 7.40 4.00 .207 497
Residual -4.298 3.065 .000 1.991 497
Std. Predicted Value -.326 16.416 .000 1.000 497
Std. Residual -2.154 1.536 .000 .998 497
a. Dependent Variable: Tenure_type_num
Document Page
Regression interpretation
Relationship between the dependent and its predictors are not strong as the adjusted or coefficient
of determination value is very low (0.01) and so as the correlation coefficient. The prediction model
is given by the following equation.
Tenure_type_num = 3.996 + – 0.001* LDA_name_num
p value of the predictor Total is significant as the value is under 0.05.
However the predictor LDA_name_num is not significant as p value is over significance level.
The overall model is not significant as indicated the by the high durbin-watson value as well as the
R^2 which shows very less percentage of variation in tenure type is explained by variation of LDA
name and Total number of household satisfying condition. Hence, there is not enough evidence to
reject the null hypothesis and thus it can be concluded by the linear regression is that the variation
of tenure type does not significantly depends on LDA name and Total households in the population.
Document Page
K-means Clustering prediction
Algorithm overview:
k cluster centres are defined in way that each centre is enough away from the other. Now, each data
point is associated with the centres based on the distances between them and centres. Now, again
the new centres are calculated the data points are assigned to the centres. This is continued in a
loop until the centres stops changing in an iteration. The final centres are solution of k-means
algorithm and the data points assigned to those centres based on minimum distances.
Expression of square Error function minimized:
J(V) =
Euclidean distance between and
ci = data points in ith cluster
c = number of clusters
tabler-icon-diamond-filled.svg

Paraphrase This Document

Need a fresh take? Get an instant paraphrase of this document with our AI Paraphraser
Document Page
Clustering approach
Variable Total is standardized first as the spread of the variable is large
and thus standardization reduces time complexity of clustering.
Clustering performed for different number of clusters starting from 2
to 7 as the type of tenures in of 7 types.
Best result chosen based on number of points in each cluster, the
significance value of each variable in the ANOVA table.
Best results are found when number of clusters is 3.
Document Page
K-means clustering results(k=3)
Initial Cluster Centers
Cluster
1 2 3
Zscore(Total) .24486 16.43382 -.10912
LDA_name_num 1 55 71
Iteration Historya
Iteration
Change in Cluster Centers
1 2 3
1 14.505 20.215 7.575
2 .500 1.456 .996
3 .500 1.000 .501
4 .500 1.000 .500
5 .500 1.000 .500
6 .000 .500 .500
7 .500 .500 .000
8 .000 .000 .000
a. Convergence achieved due to no or small change in cluster centers. The maximum absolute coordinate change for any center is .000.
The current iteration is 8. The minimum distance between initial centers is 23.015.
chevron_up_icon
1 out of 18
circle_padding
hide_on_mobile
zoom_out_icon
[object Object]