Detailed Financial Analysis Report on South32 Limited Company
VerifiedAdded on 2024/05/27
|15
|3219
|304
Report
AI Summary
This report presents a financial analysis of South32 Limited, a metals and mining company operating in Australia, South America, and South Africa. The analysis uses financial ratios derived from the company's income statement, balance sheet, and cash flow statement over a five-year period. The report examines the company's revenue, expenses, profitability, liquidity, and solvency. Key findings include an increase in earnings and cash balance, improving profitability as indicated by net profit and EBIT margins, and strong liquidity as demonstrated by the current ratio. The company's solvency is also assessed as healthy, indicating its ability to meet long-term obligations and pursue further growth opportunities. Overall, the analysis suggests that South32 Limited is maintaining a strong financial position and is well-positioned for future sustainability and growth.
Accounting
1
1
Paraphrase This Document
Need a fresh take? Get an instant paraphrase of this document with our AI Paraphraser
Executive summary
The report below is presented in the context of south32 limited which a company is operating in
Australia, South America, and South Africa in the metals and mining sector. The financial
analysis has been performed for it in which various tools such as ratios have been taken into
consideration. The balance sheet, income statement and cash flow all have been included in the
same. The company is maintaining its position as there is the increase which is noted in respect
of the earnings and the cash balance which is maintained by the company. The profitability is
also improving which is ascertained with the help of net profit and EBIT margin ratios. It is in
the position where all the liabilities will be met on time and this is represented by liquidity ratios
such as current ratio. The company will be able to maintain its position in the market and will
survive as its solvency is good and there are currently no risks in this respect as it has the scope
to take the loans for the further growth and the cost of it will be met by the company in a
successful manner.
2
Table of Contents
Executive summary.........................................................................................................................2
Introduction......................................................................................................................................4
Income statement analysis...........................................................................................................5
Balance sheet analysis.................................................................................................................7
Cash flow statement analysis.......................................................................................................8
Profitability analysis..................................................................................................................10
Liquidity analysis.......................................................................................................................11
Solvency analysis.......................................................................................................................12
Conclusion.....................................................................................................................................13
References......................................................................................................................................14
3
⊘ This is a preview!⊘
Do you want full access?
Subscribe today to unlock all pages.
Trusted by 1+ million students worldwide
Introduction
In the company, there are various such aspects by the help of which value of the business is
created and so it is required that they shall be analyzed in an appropriate manner. For this, there
are various techniques that can be used and one of them is ratio analysis which will be used in
the below-presented report in context with South32 Limited which is a metal and mining
company. It is maintaining simple strategies by which all the available assets and other resources
will be utilized in an effective manner so that shareholders are provided with appropriate returns.
All the new opportunities will also be used by the company in most effective and efficient
manner. In the items of the income statement, cash flow statement and balance sheet will be
selected and evaluated for a period of five years. The liquidity, profitability, and solvency of the
company will be ascertained with the help of the ratios which will be calculated in this respect.
4
Paraphrase This Document
Need a fresh take? Get an instant paraphrase of this document with our AI Paraphraser
Income statement analysis
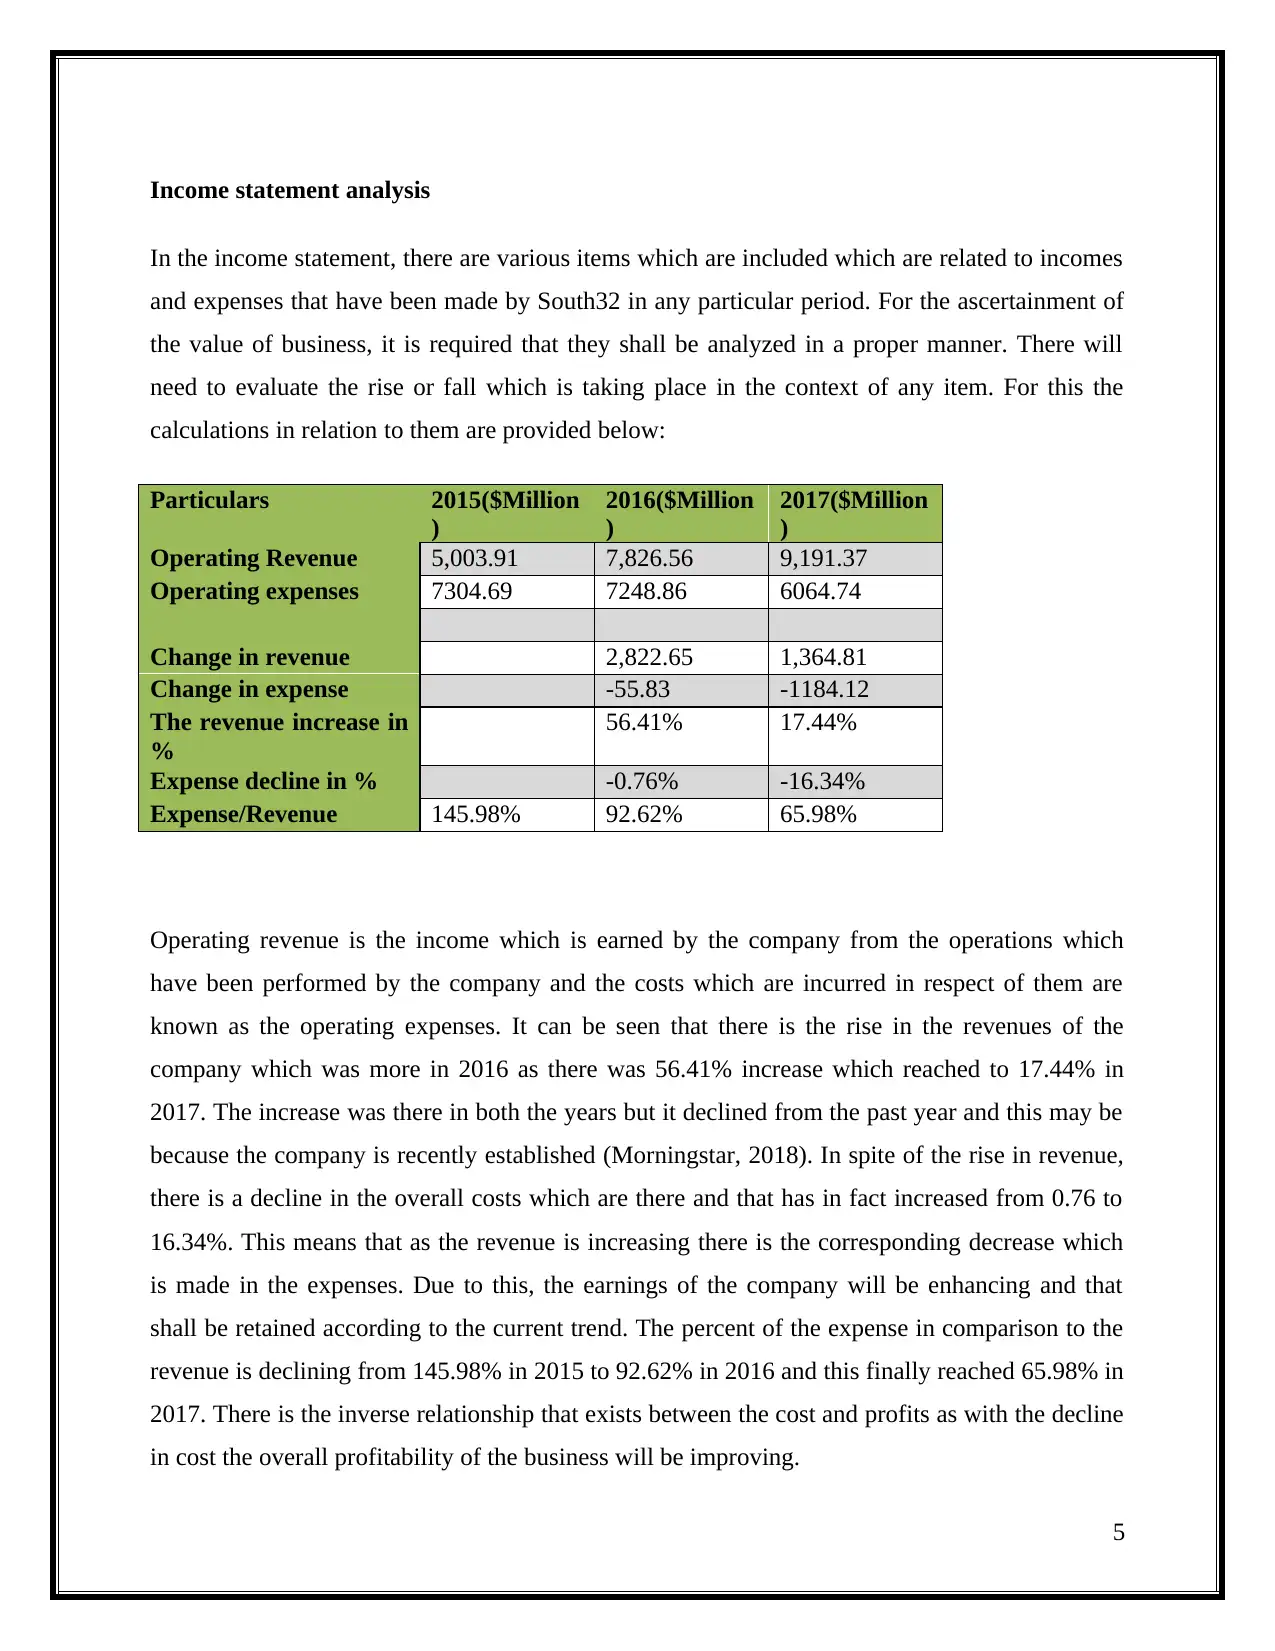
In the income statement, there are various items which are included which are related to incomes
and expenses that have been made by South32 in any particular period. For the ascertainment of
the value of business, it is required that they shall be analyzed in a proper manner. There will
need to evaluate the rise or fall which is taking place in the context of any item. For this the
calculations in relation to them are provided below:
Particulars 2015($Million
)
2016($Million
)
2017($Million
)
Operating Revenue 5,003.91 7,826.56 9,191.37
Operating expenses 7304.69 7248.86 6064.74
Change in revenue 2,822.65 1,364.81
Change in expense -55.83 -1184.12
The revenue increase in
%
56.41% 17.44%
Expense decline in % -0.76% -16.34%
Expense/Revenue 145.98% 92.62% 65.98%
Operating revenue is the income which is earned by the company from the operations which
have been performed by the company and the costs which are incurred in respect of them are
known as the operating expenses. It can be seen that there is the rise in the revenues of the
company which was more in 2016 as there was 56.41% increase which reached to 17.44% in
2017. The increase was there in both the years but it declined from the past year and this may be
because the company is recently established (Morningstar, 2018). In spite of the rise in revenue,
there is a decline in the overall costs which are there and that has in fact increased from 0.76 to
16.34%. This means that as the revenue is increasing there is the corresponding decrease which
is made in the expenses. Due to this, the earnings of the company will be enhancing and that
shall be retained according to the current trend. The percent of the expense in comparison to the
revenue is declining from 145.98% in 2015 to 92.62% in 2016 and this finally reached 65.98% in
2017. There is the inverse relationship that exists between the cost and profits as with the decline
in cost the overall profitability of the business will be improving.
5
The earnings which are made per share are also rising and this shows that company is improving
its performance with the passage of time.
6
its performance with the passage of time.
6
⊘ This is a preview!⊘
Do you want full access?
Subscribe today to unlock all pages.
Trusted by 1+ million students worldwide
Balance sheet analysis
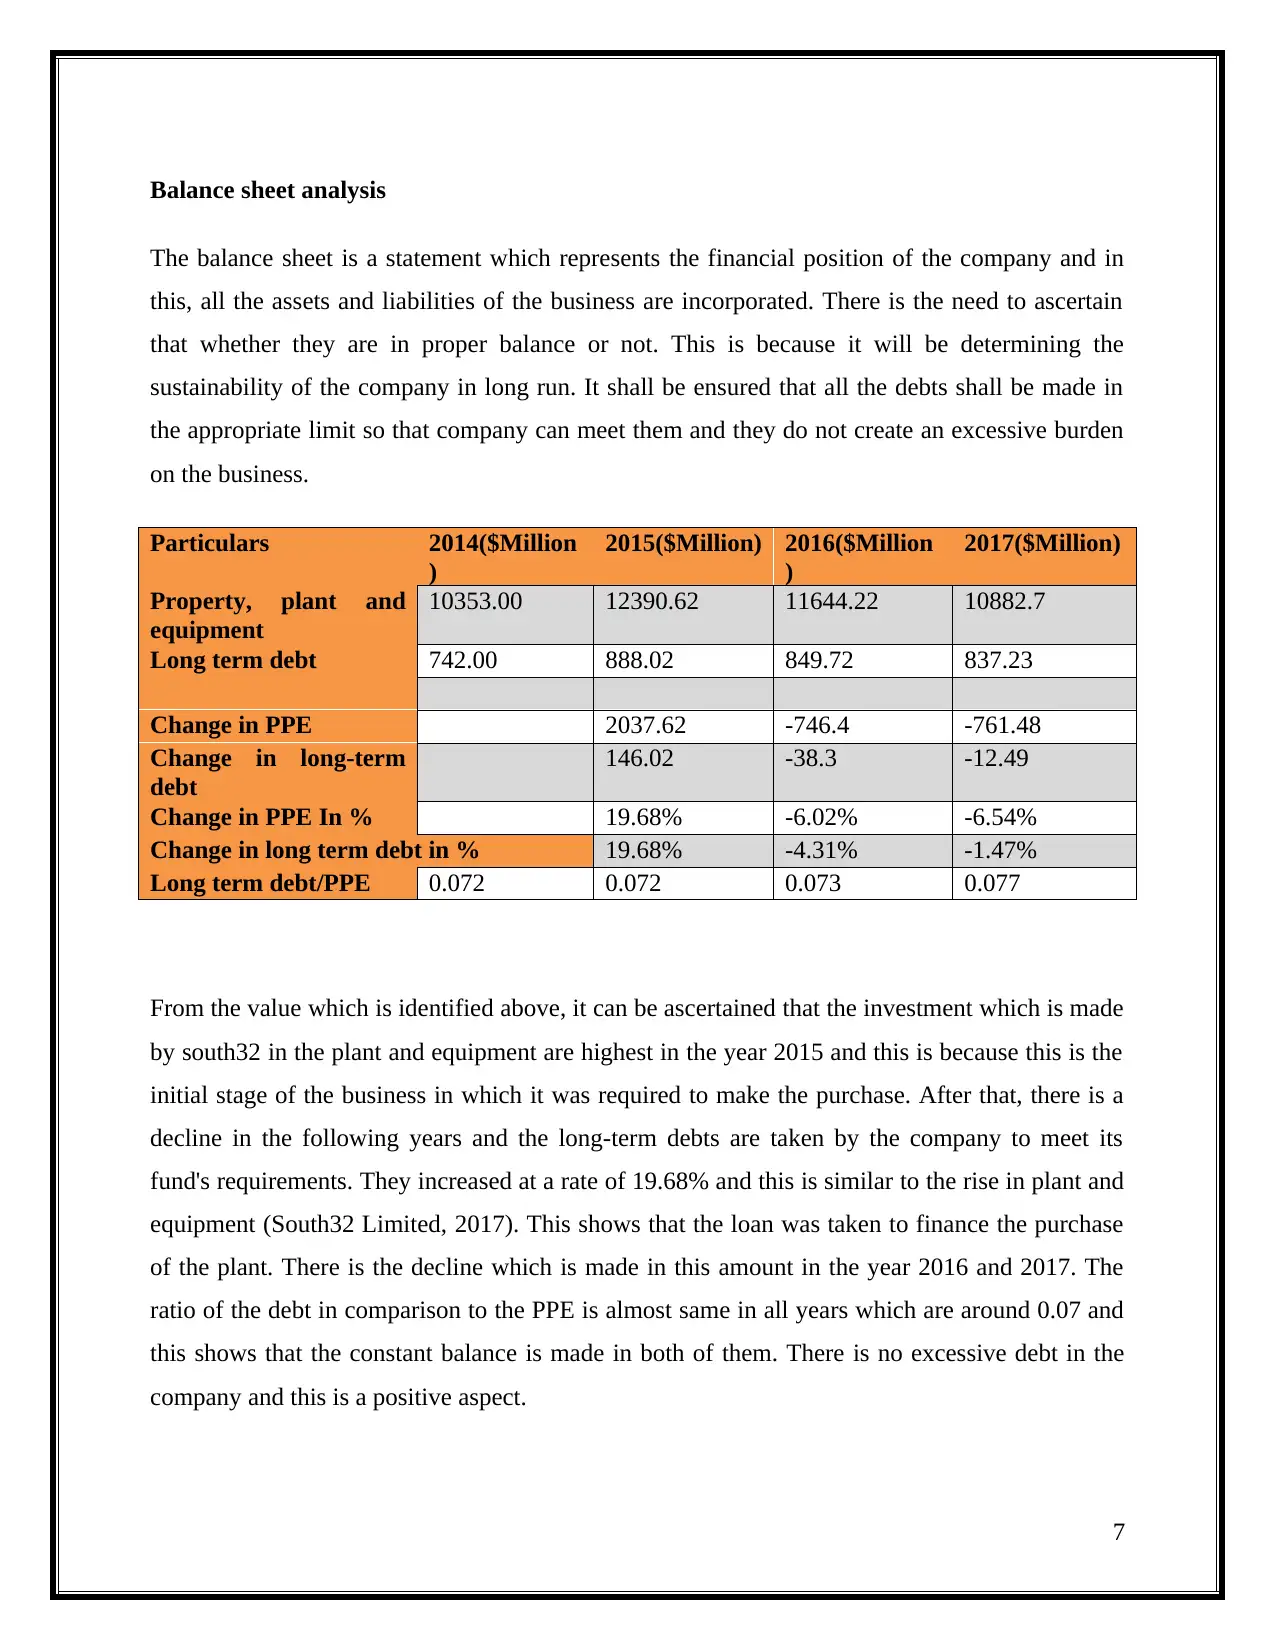
The balance sheet is a statement which represents the financial position of the company and in
this, all the assets and liabilities of the business are incorporated. There is the need to ascertain
that whether they are in proper balance or not. This is because it will be determining the
sustainability of the company in long run. It shall be ensured that all the debts shall be made in
the appropriate limit so that company can meet them and they do not create an excessive burden
on the business.
Particulars 2014($Million
)
2015($Million) 2016($Million
)
2017($Million)
Property, plant and
equipment
10353.00 12390.62 11644.22 10882.7
Long term debt 742.00 888.02 849.72 837.23
Change in PPE 2037.62 -746.4 -761.48
Change in long-term
debt
146.02 -38.3 -12.49
Change in PPE In % 19.68% -6.02% -6.54%
Change in long term debt in % 19.68% -4.31% -1.47%
Long term debt/PPE 0.072 0.072 0.073 0.077
From the value which is identified above, it can be ascertained that the investment which is made
by south32 in the plant and equipment are highest in the year 2015 and this is because this is the
initial stage of the business in which it was required to make the purchase. After that, there is a
decline in the following years and the long-term debts are taken by the company to meet its
fund's requirements. They increased at a rate of 19.68% and this is similar to the rise in plant and
equipment (South32 Limited, 2017). This shows that the loan was taken to finance the purchase
of the plant. There is the decline which is made in this amount in the year 2016 and 2017. The
ratio of the debt in comparison to the PPE is almost same in all years which are around 0.07 and
this shows that the constant balance is made in both of them. There is no excessive debt in the
company and this is a positive aspect.
7
Paraphrase This Document
Need a fresh take? Get an instant paraphrase of this document with our AI Paraphraser
Cash flow statement analysis
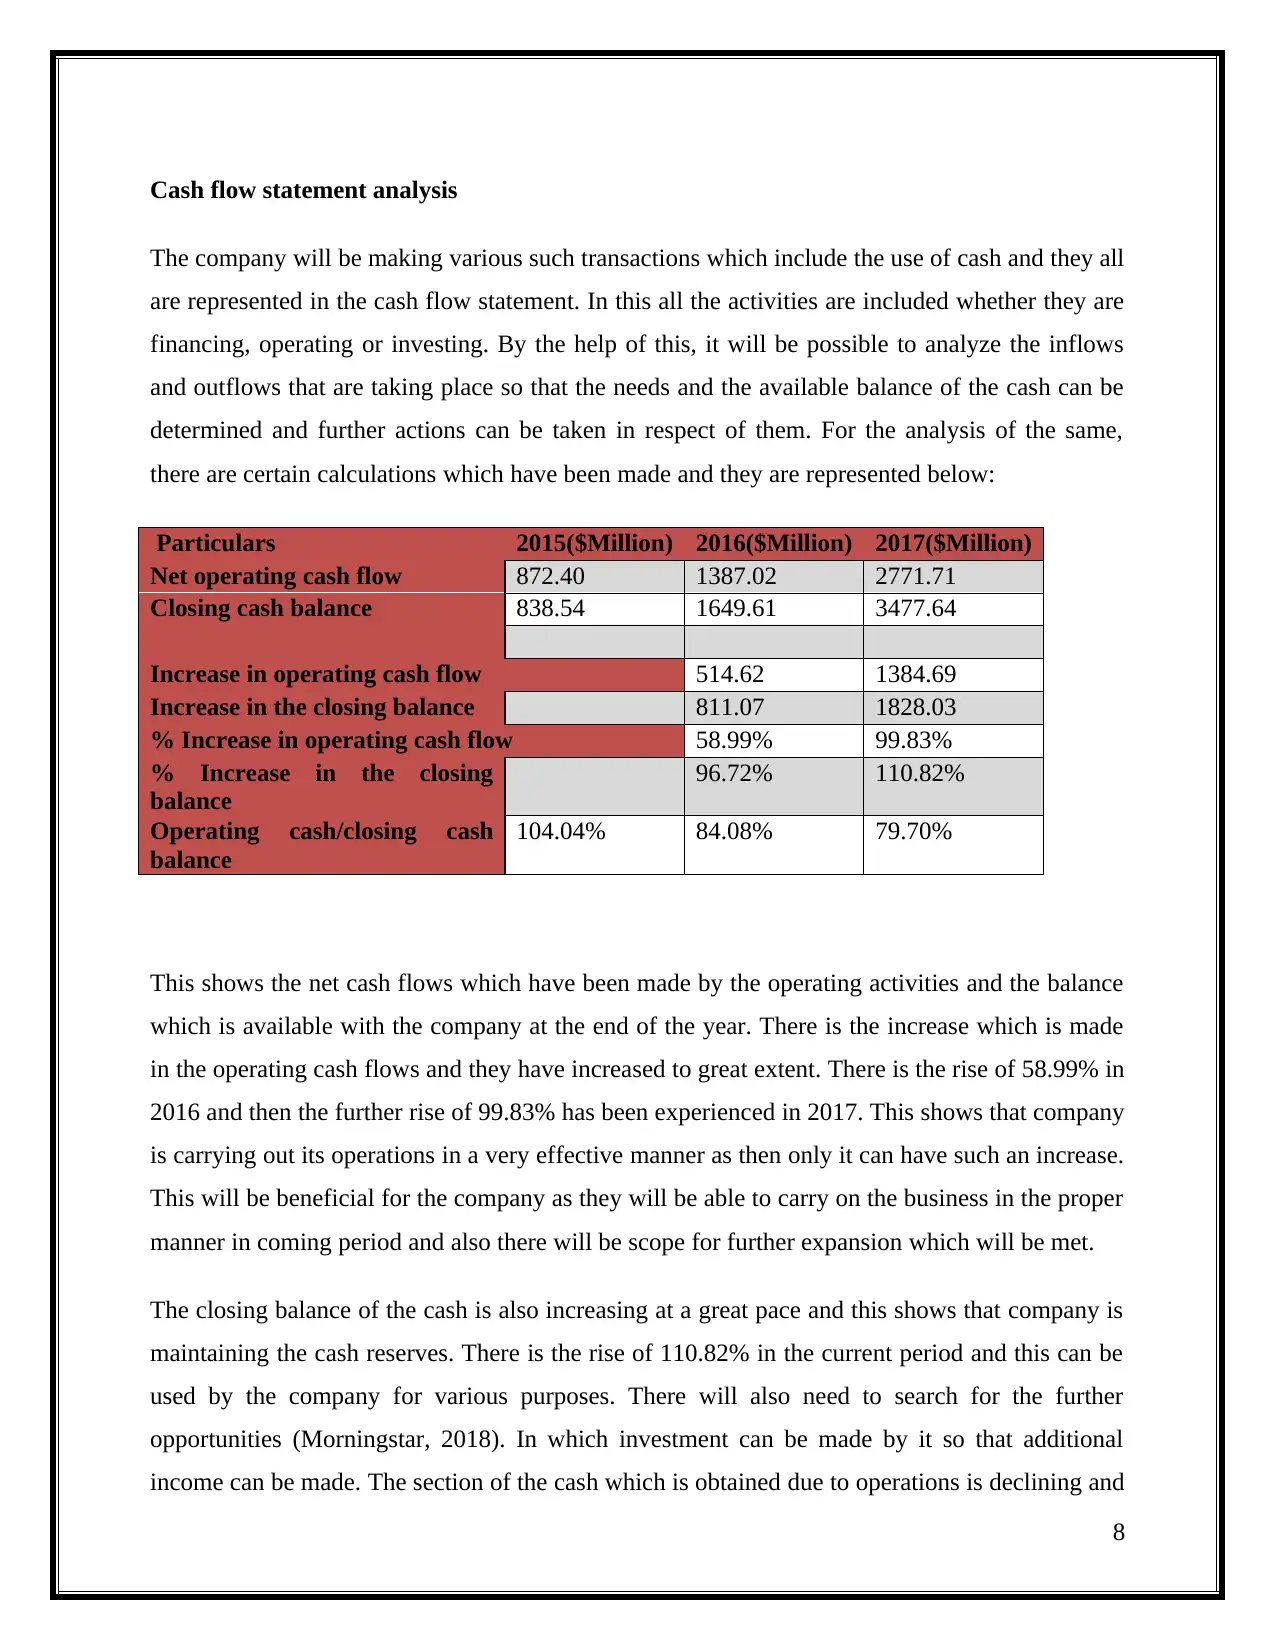
The company will be making various such transactions which include the use of cash and they all
are represented in the cash flow statement. In this all the activities are included whether they are
financing, operating or investing. By the help of this, it will be possible to analyze the inflows
and outflows that are taking place so that the needs and the available balance of the cash can be
determined and further actions can be taken in respect of them. For the analysis of the same,
there are certain calculations which have been made and they are represented below:
Particulars 2015($Million) 2016($Million) 2017($Million)
Net operating cash flow 872.40 1387.02 2771.71
Closing cash balance 838.54 1649.61 3477.64
Increase in operating cash flow 514.62 1384.69
Increase in the closing balance 811.07 1828.03
% Increase in operating cash flow 58.99% 99.83%
% Increase in the closing
balance
96.72% 110.82%
Operating cash/closing cash
balance
104.04% 84.08% 79.70%
This shows the net cash flows which have been made by the operating activities and the balance
which is available with the company at the end of the year. There is the increase which is made
in the operating cash flows and they have increased to great extent. There is the rise of 58.99% in
2016 and then the further rise of 99.83% has been experienced in 2017. This shows that company
is carrying out its operations in a very effective manner as then only it can have such an increase.
This will be beneficial for the company as they will be able to carry on the business in the proper
manner in coming period and also there will be scope for further expansion which will be met.
The closing balance of the cash is also increasing at a great pace and this shows that company is
maintaining the cash reserves. There is the rise of 110.82% in the current period and this can be
used by the company for various purposes. There will also need to search for the further
opportunities (Morningstar, 2018). In which investment can be made by it so that additional
income can be made. The section of the cash which is obtained due to operations is declining and
8
this can be considered as the rise in the other activities also in business such as investing and
financing. There is a good closing balance of cash which ensures that company will not be facing
the problem of cash shortage in coming period.
9
financing. There is a good closing balance of cash which ensures that company will not be facing
the problem of cash shortage in coming period.
9
⊘ This is a preview!⊘
Do you want full access?
Subscribe today to unlock all pages.
Trusted by 1+ million students worldwide
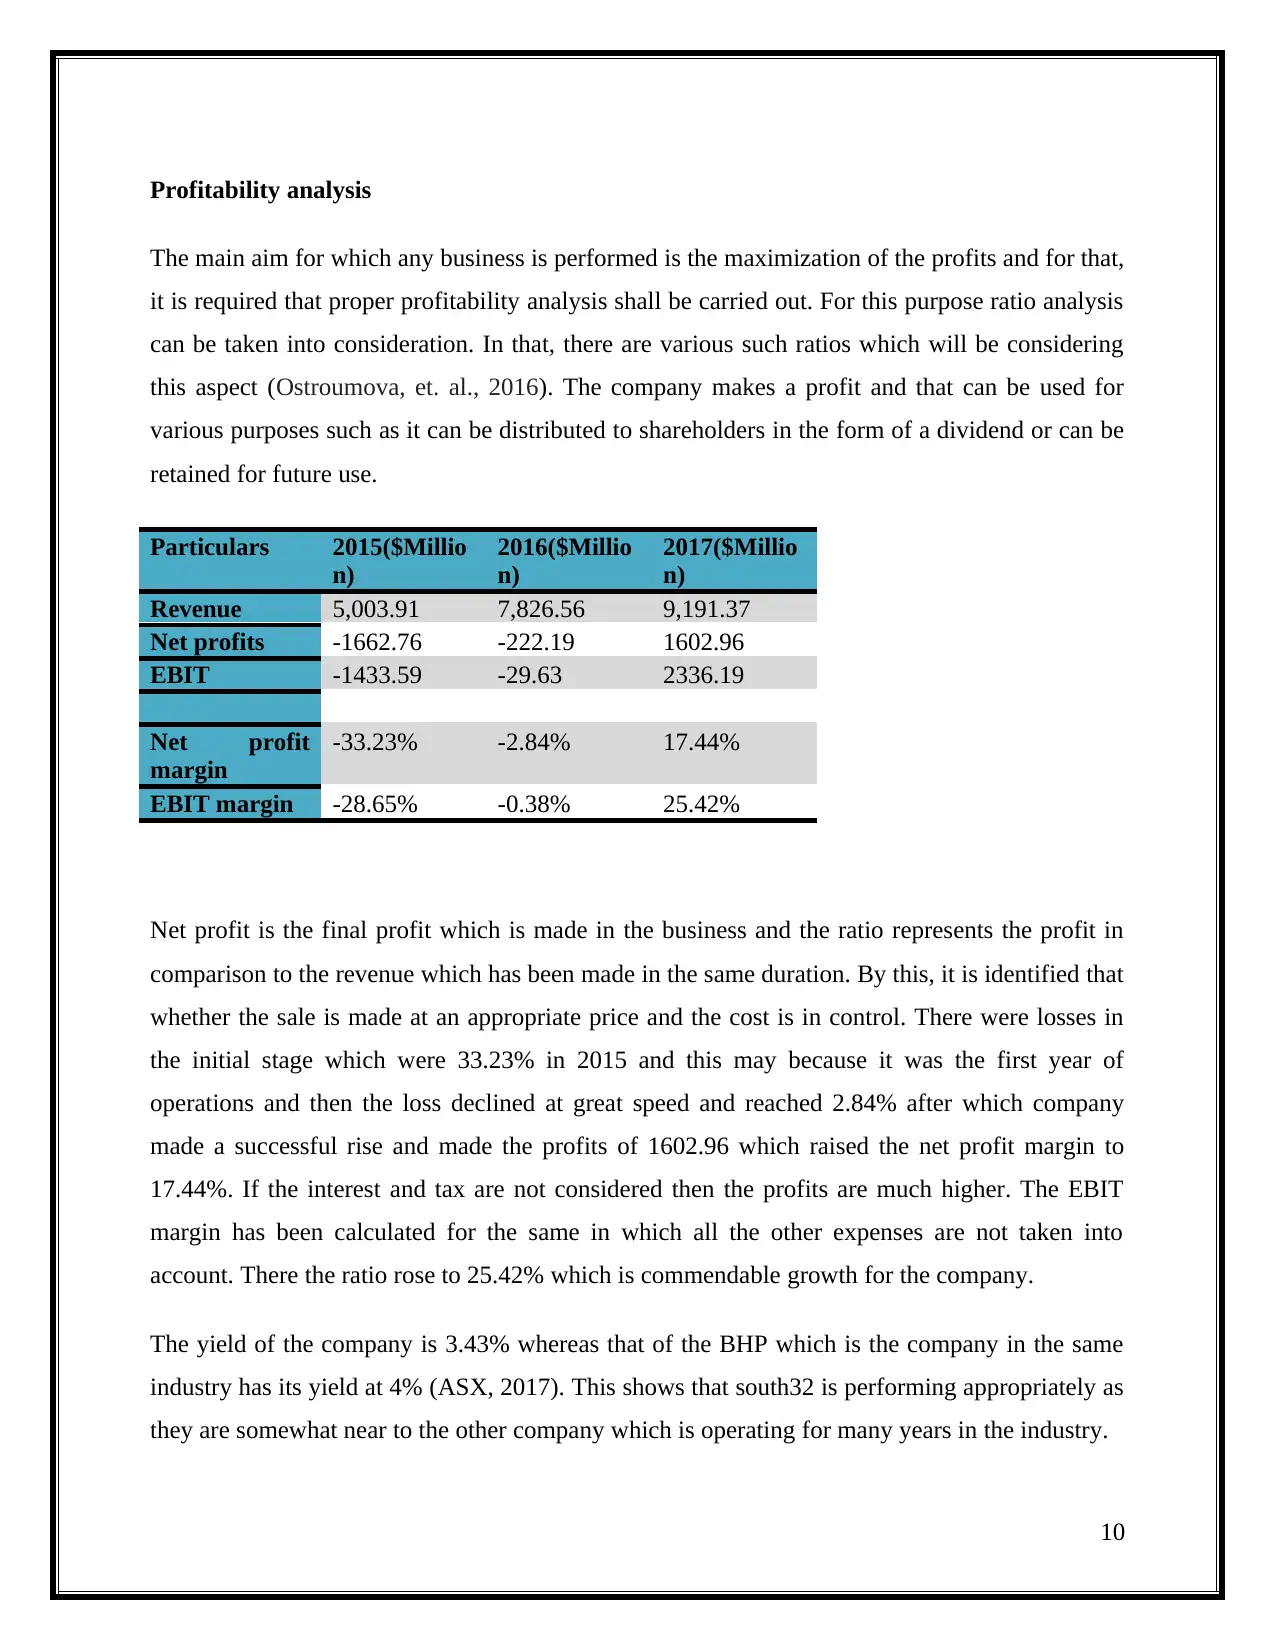
Profitability analysis
The main aim for which any business is performed is the maximization of the profits and for that,
it is required that proper profitability analysis shall be carried out. For this purpose ratio analysis
can be taken into consideration. In that, there are various such ratios which will be considering
this aspect (Ostroumova, et. al., 2016). The company makes a profit and that can be used for
various purposes such as it can be distributed to shareholders in the form of a dividend or can be
retained for future use.
Particulars 2015($Millio
n)
2016($Millio
n)
2017($Millio
n)
Revenue 5,003.91 7,826.56 9,191.37
Net profits -1662.76 -222.19 1602.96
EBIT -1433.59 -29.63 2336.19
Net profit
margin
-33.23% -2.84% 17.44%
EBIT margin -28.65% -0.38% 25.42%
Net profit is the final profit which is made in the business and the ratio represents the profit in
comparison to the revenue which has been made in the same duration. By this, it is identified that
whether the sale is made at an appropriate price and the cost is in control. There were losses in
the initial stage which were 33.23% in 2015 and this may because it was the first year of
operations and then the loss declined at great speed and reached 2.84% after which company
made a successful rise and made the profits of 1602.96 which raised the net profit margin to
17.44%. If the interest and tax are not considered then the profits are much higher. The EBIT
margin has been calculated for the same in which all the other expenses are not taken into
account. There the ratio rose to 25.42% which is commendable growth for the company.
The yield of the company is 3.43% whereas that of the BHP which is the company in the same
industry has its yield at 4% (ASX, 2017). This shows that south32 is performing appropriately as
they are somewhat near to the other company which is operating for many years in the industry.
10
Paraphrase This Document
Need a fresh take? Get an instant paraphrase of this document with our AI Paraphraser
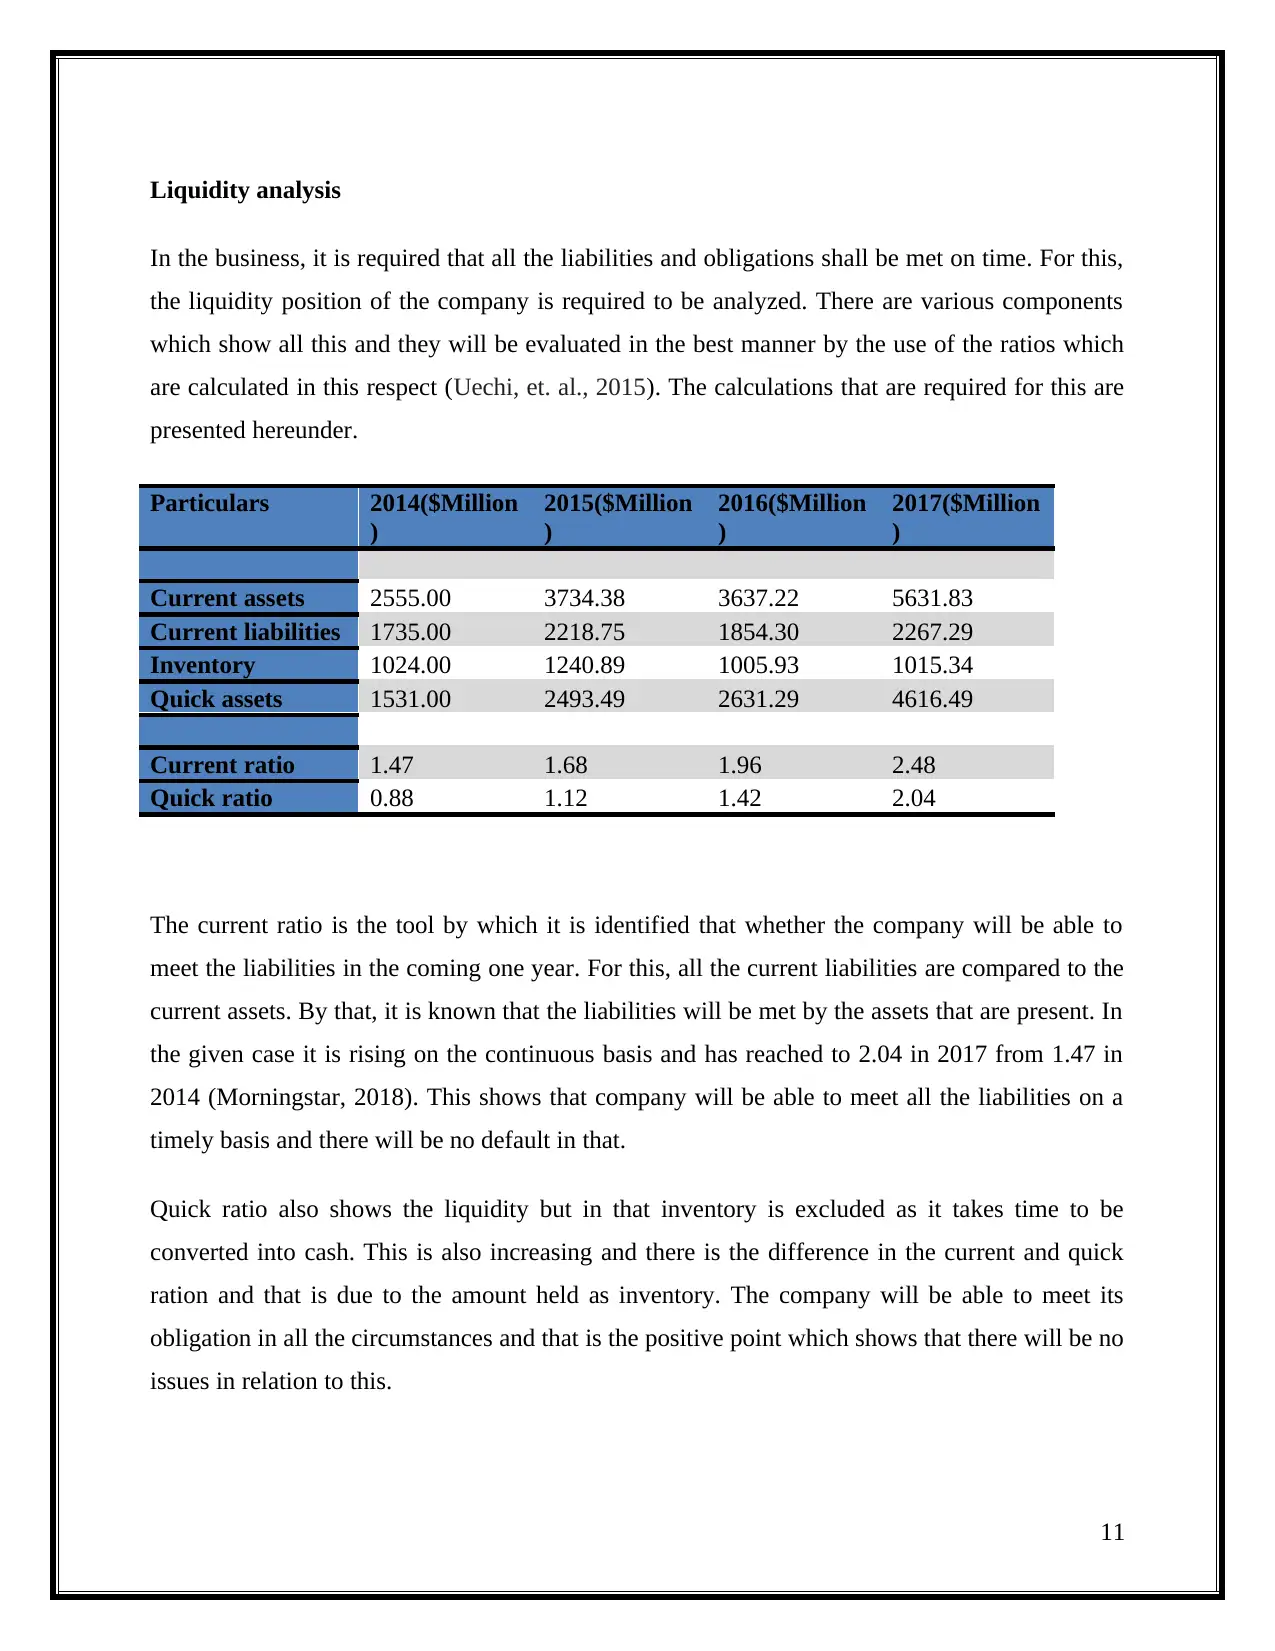
Liquidity analysis
In the business, it is required that all the liabilities and obligations shall be met on time. For this,
the liquidity position of the company is required to be analyzed. There are various components
which show all this and they will be evaluated in the best manner by the use of the ratios which
are calculated in this respect (Uechi, et. al., 2015). The calculations that are required for this are
presented hereunder.
Particulars 2014($Million
)
2015($Million
)
2016($Million
)
2017($Million
)
Current assets 2555.00 3734.38 3637.22 5631.83
Current liabilities 1735.00 2218.75 1854.30 2267.29
Inventory 1024.00 1240.89 1005.93 1015.34
Quick assets 1531.00 2493.49 2631.29 4616.49
Current ratio 1.47 1.68 1.96 2.48
Quick ratio 0.88 1.12 1.42 2.04
The current ratio is the tool by which it is identified that whether the company will be able to
meet the liabilities in the coming one year. For this, all the current liabilities are compared to the
current assets. By that, it is known that the liabilities will be met by the assets that are present. In
the given case it is rising on the continuous basis and has reached to 2.04 in 2017 from 1.47 in
2014 (Morningstar, 2018). This shows that company will be able to meet all the liabilities on a
timely basis and there will be no default in that.
Quick ratio also shows the liquidity but in that inventory is excluded as it takes time to be
converted into cash. This is also increasing and there is the difference in the current and quick
ration and that is due to the amount held as inventory. The company will be able to meet its
obligation in all the circumstances and that is the positive point which shows that there will be no
issues in relation to this.
11
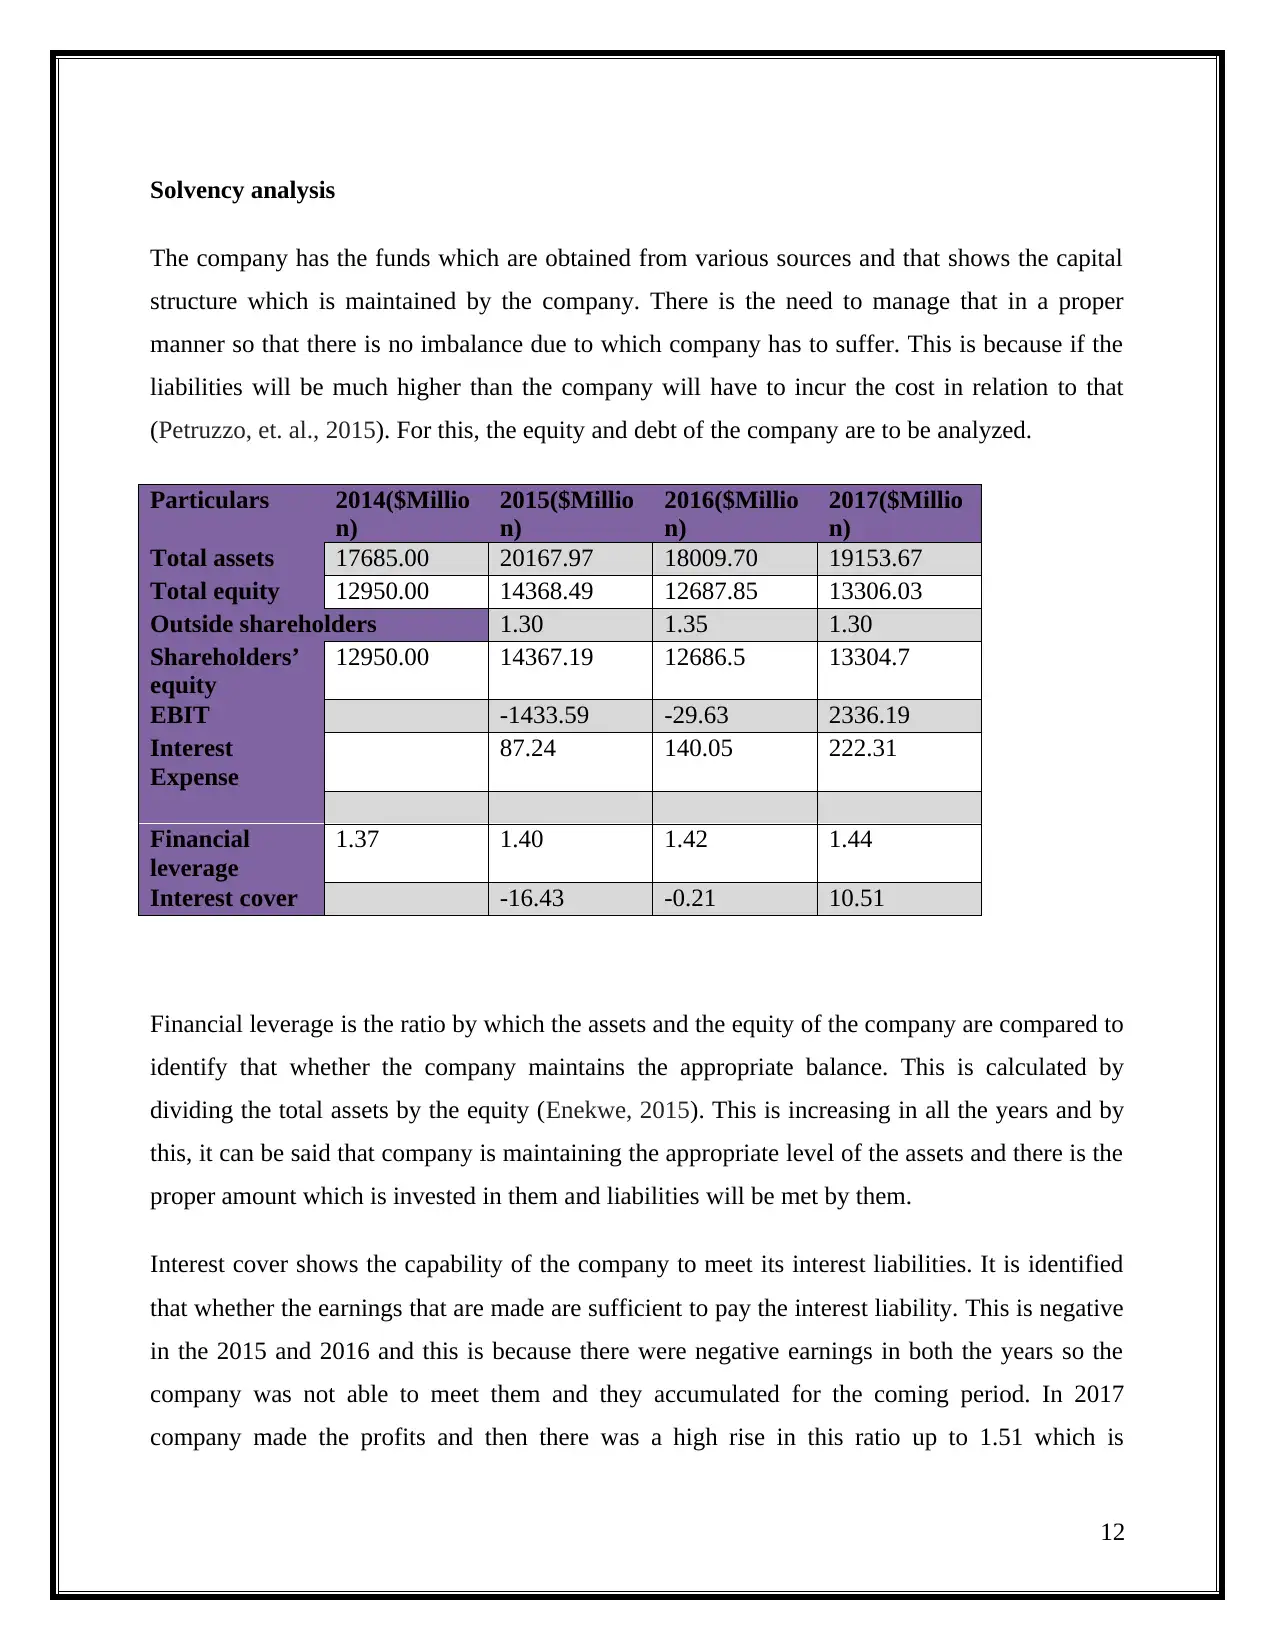
Solvency analysis
The company has the funds which are obtained from various sources and that shows the capital
structure which is maintained by the company. There is the need to manage that in a proper
manner so that there is no imbalance due to which company has to suffer. This is because if the
liabilities will be much higher than the company will have to incur the cost in relation to that
(Petruzzo, et. al., 2015). For this, the equity and debt of the company are to be analyzed.
Particulars 2014($Millio
n)
2015($Millio
n)
2016($Millio
n)
2017($Millio
n)
Total assets 17685.00 20167.97 18009.70 19153.67
Total equity 12950.00 14368.49 12687.85 13306.03
Outside shareholders 1.30 1.35 1.30
Shareholders’
equity
12950.00 14367.19 12686.5 13304.7
EBIT -1433.59 -29.63 2336.19
Interest
Expense
87.24 140.05 222.31
Financial
leverage
1.37 1.40 1.42 1.44
Interest cover -16.43 -0.21 10.51
Financial leverage is the ratio by which the assets and the equity of the company are compared to
identify that whether the company maintains the appropriate balance. This is calculated by
dividing the total assets by the equity (Enekwe, 2015). This is increasing in all the years and by
this, it can be said that company is maintaining the appropriate level of the assets and there is the
proper amount which is invested in them and liabilities will be met by them.
Interest cover shows the capability of the company to meet its interest liabilities. It is identified
that whether the earnings that are made are sufficient to pay the interest liability. This is negative
in the 2015 and 2016 and this is because there were negative earnings in both the years so the
company was not able to meet them and they accumulated for the coming period. In 2017
company made the profits and then there was a high rise in this ratio up to 1.51 which is
12
⊘ This is a preview!⊘
Do you want full access?
Subscribe today to unlock all pages.
Trusted by 1+ million students worldwide
1 out of 15
Related Documents


Your All-in-One AI-Powered Toolkit for Academic Success.
+13062052269
info@desklib.com
Available 24*7 on WhatsApp / Email
![[object Object]](/_next/static/media/star-bottom.7253800d.svg)
Unlock your academic potential
Copyright © 2020–2026 A2Z Services. All Rights Reserved. Developed and managed by ZUCOL.