Volatility Analysis of Microsoft, Apple, and Amazon Stocks (FM305)
VerifiedAdded on 2022/11/10
|12
|1698
|414
Report
AI Summary
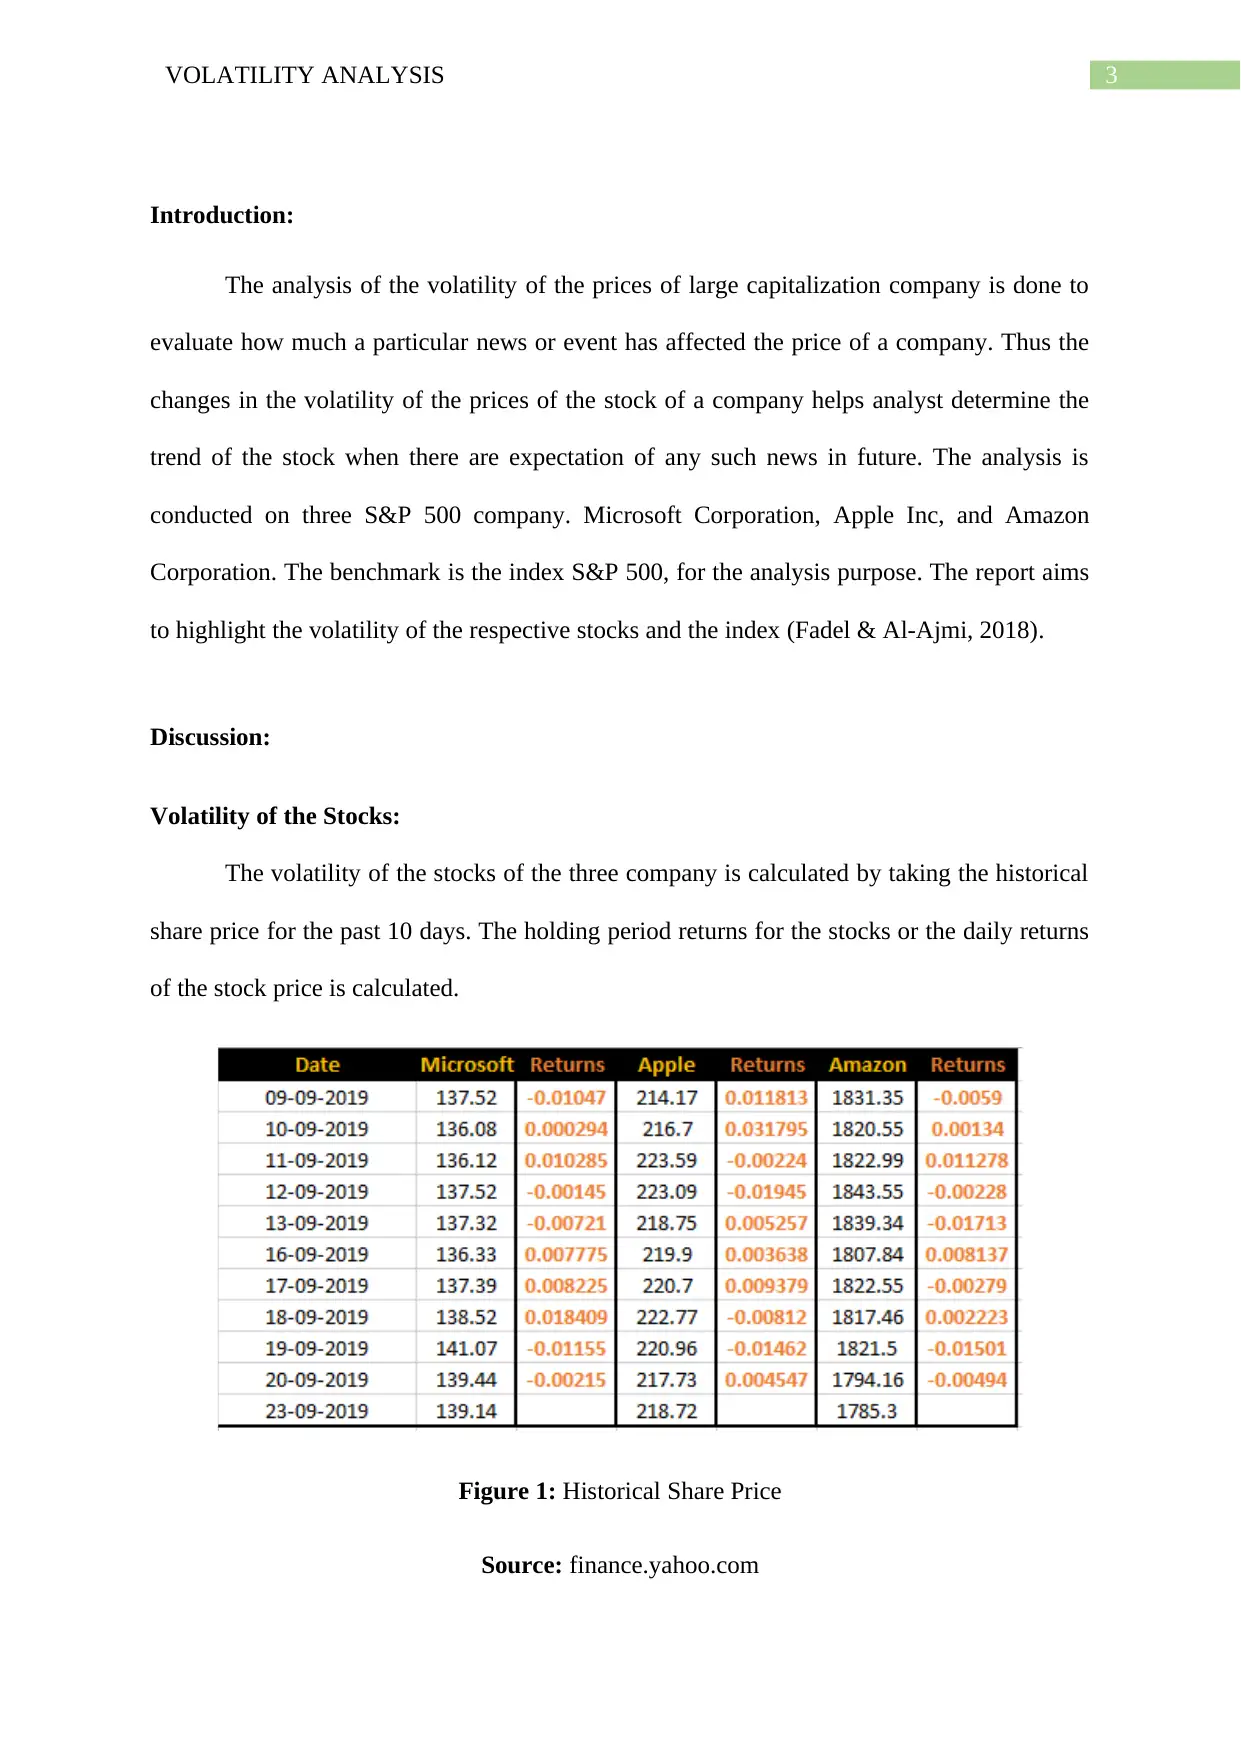
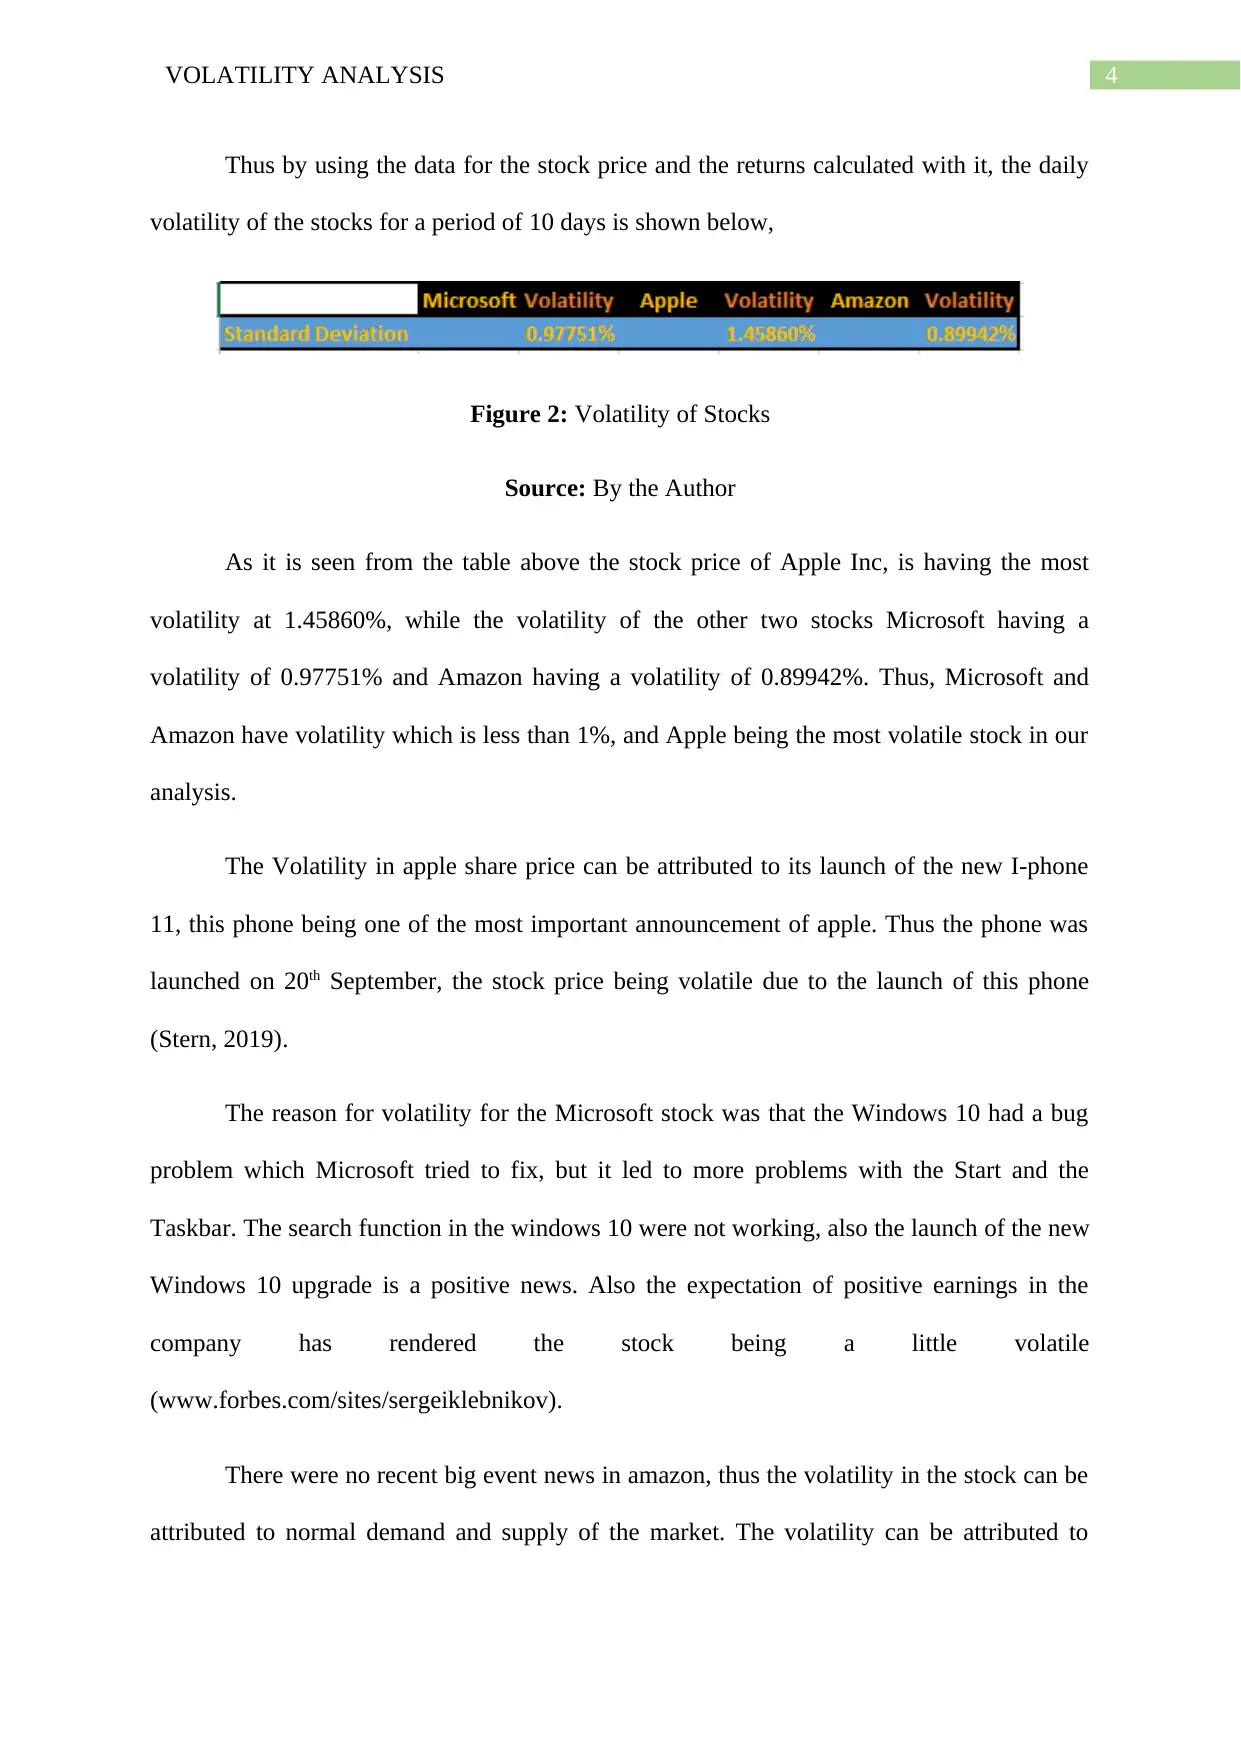
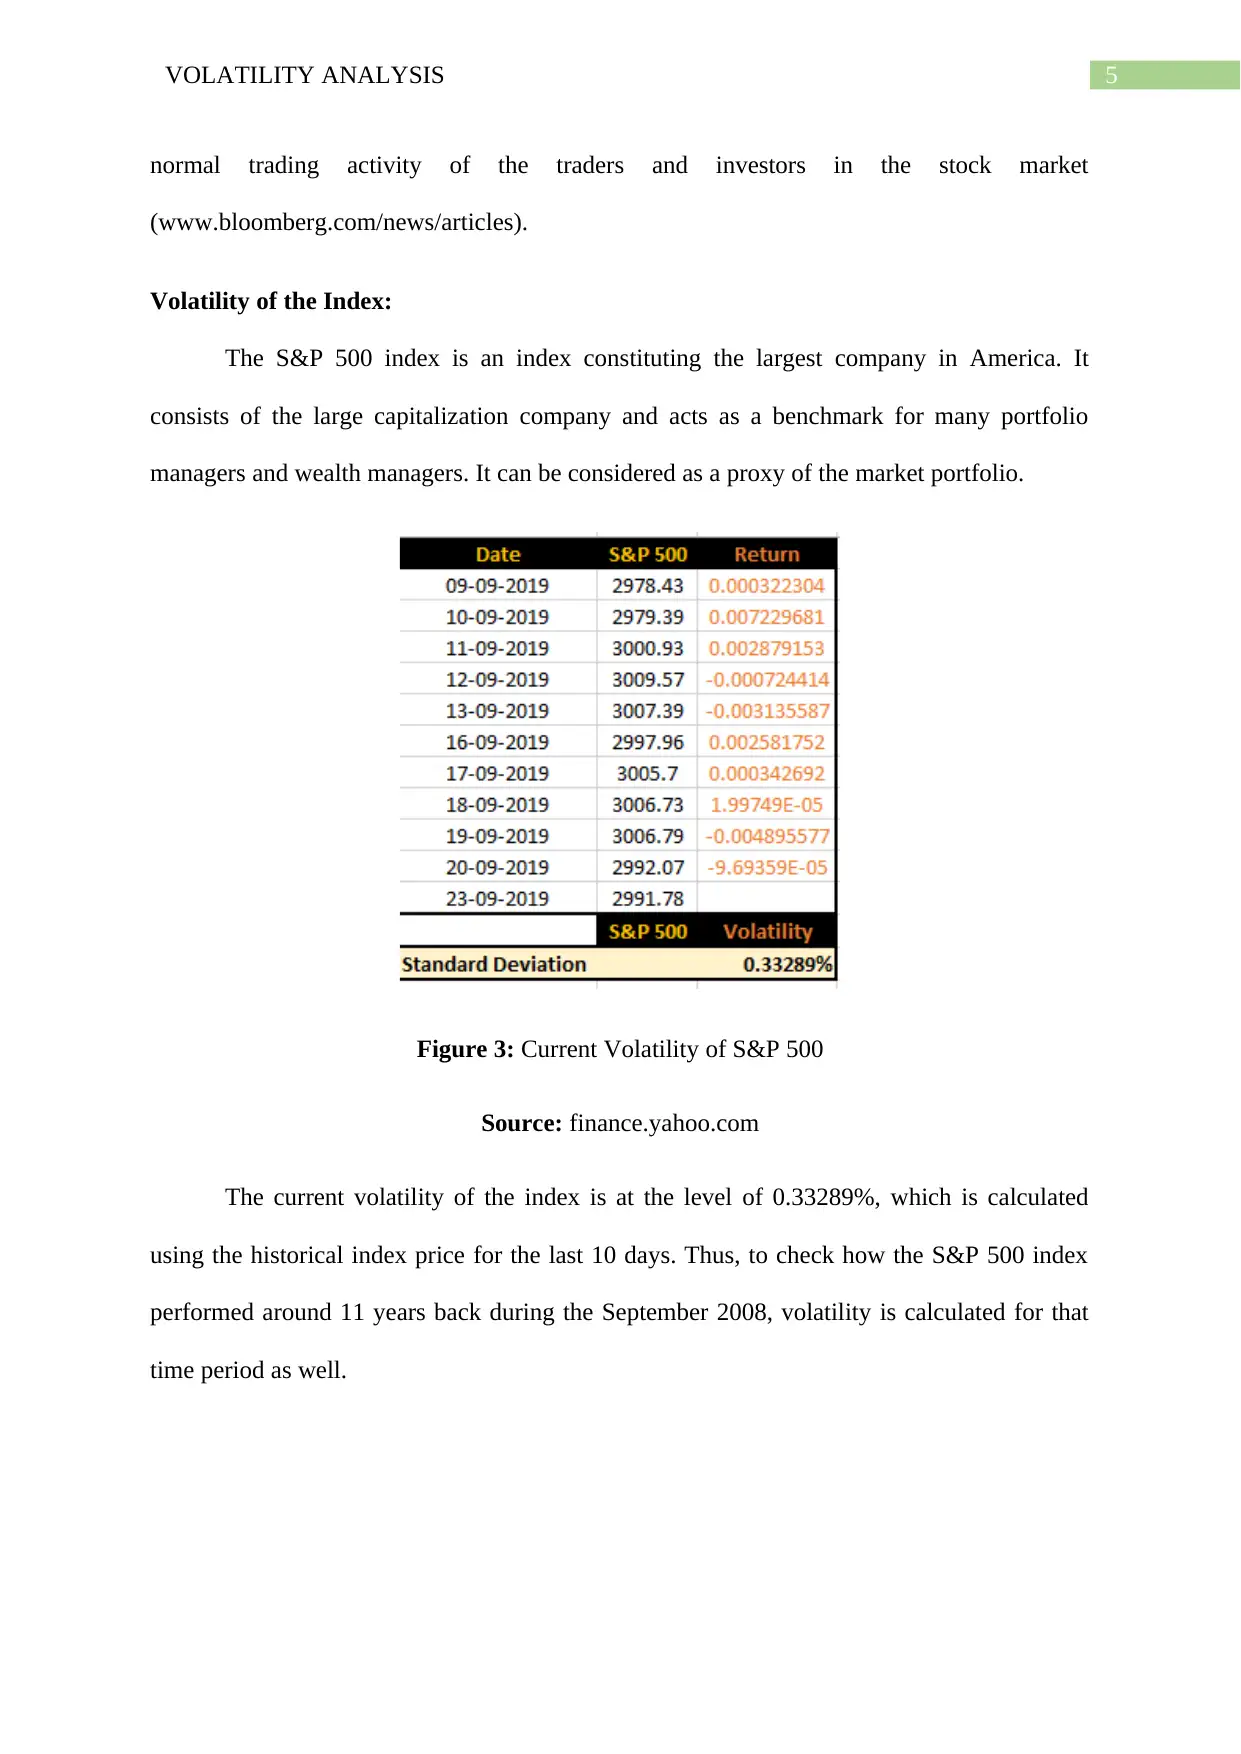
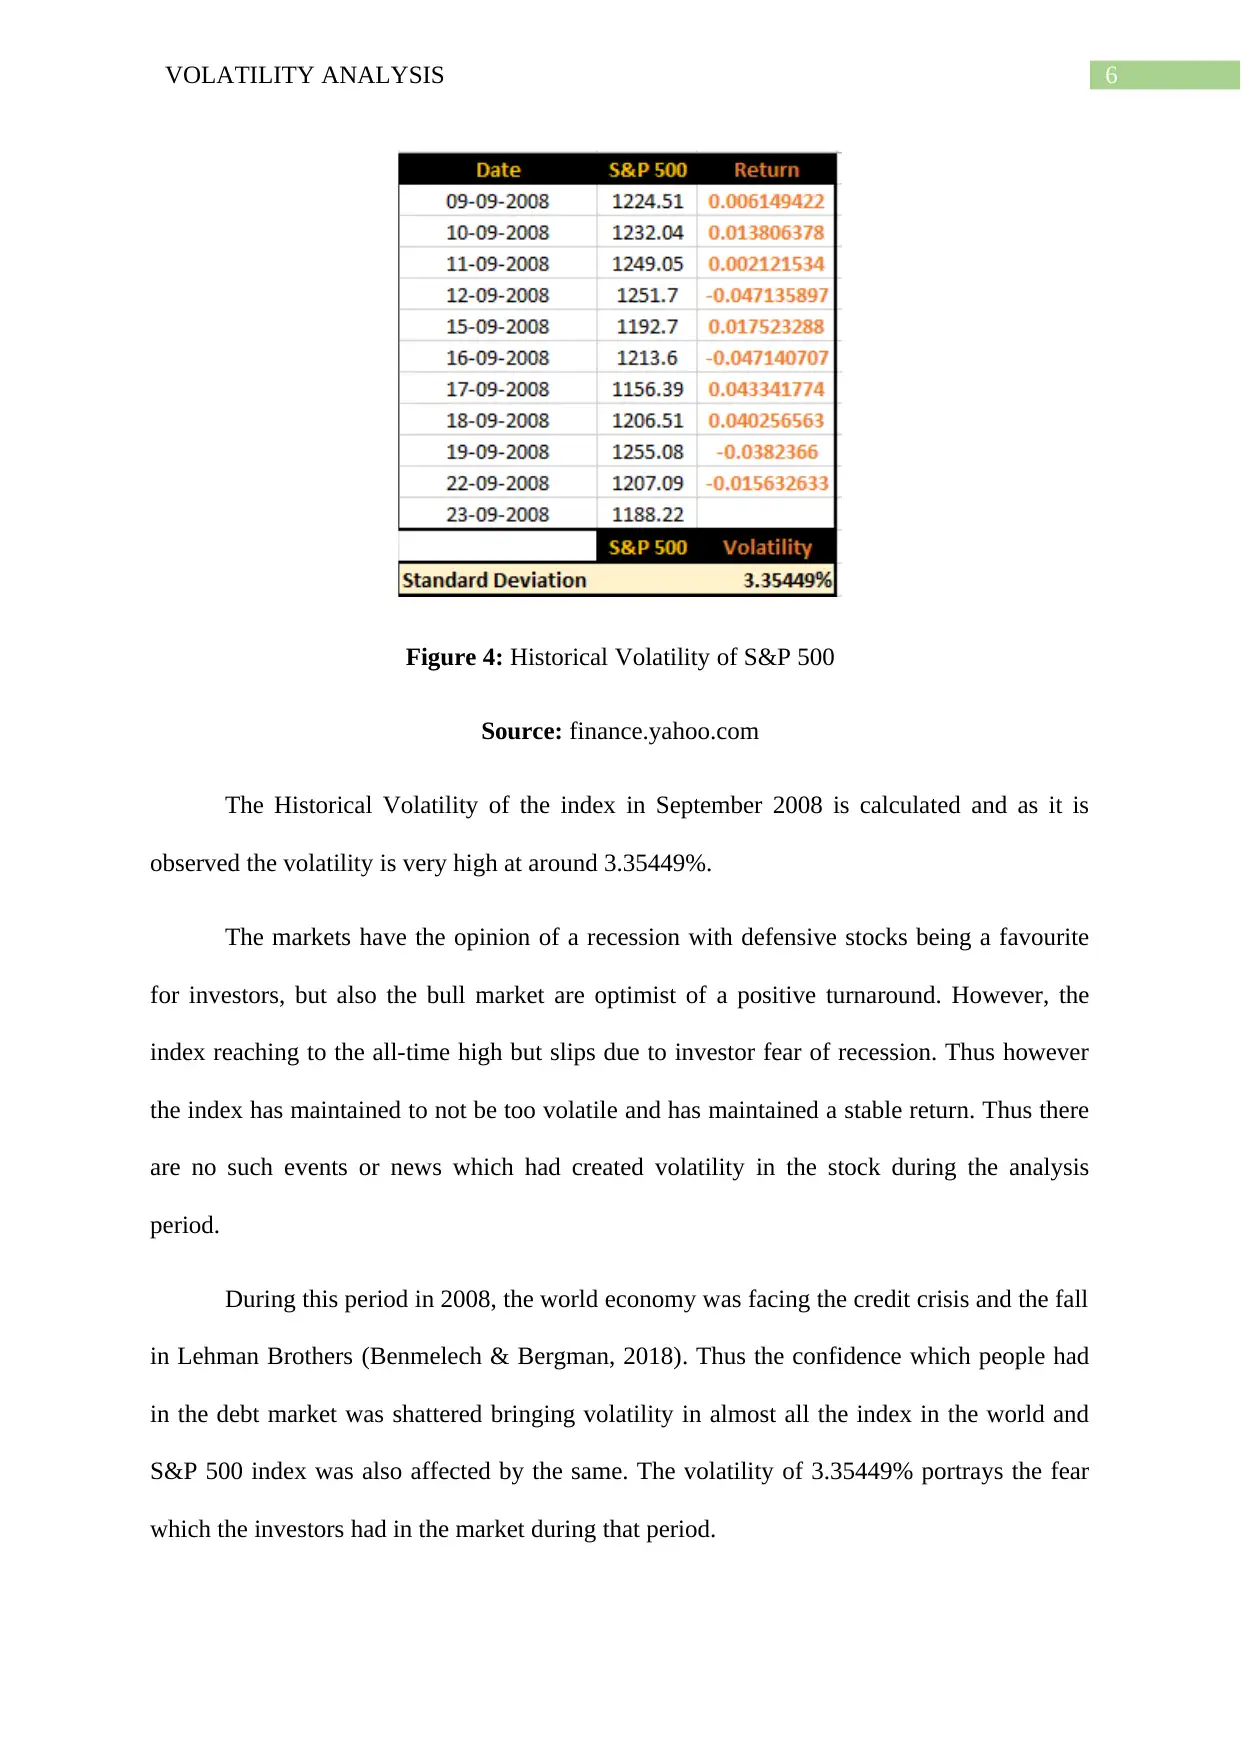
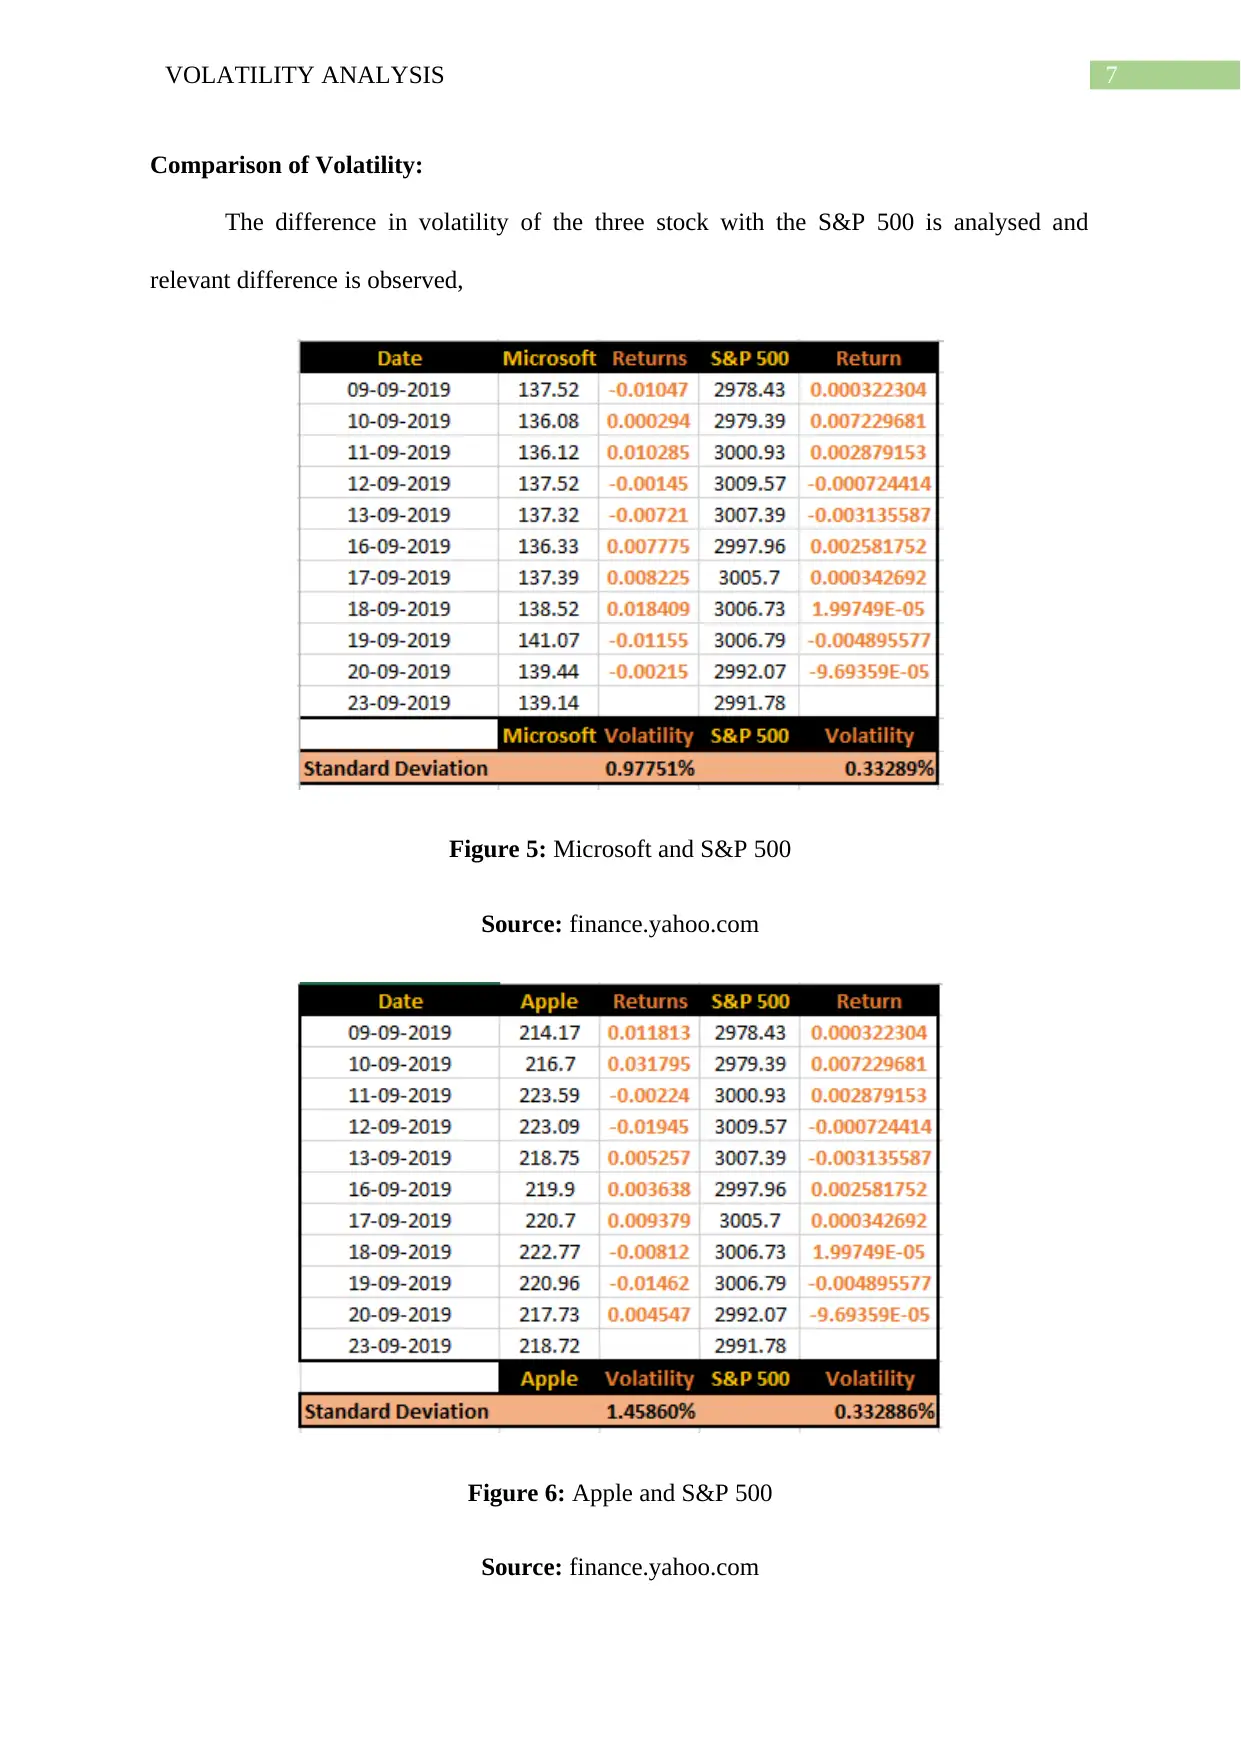
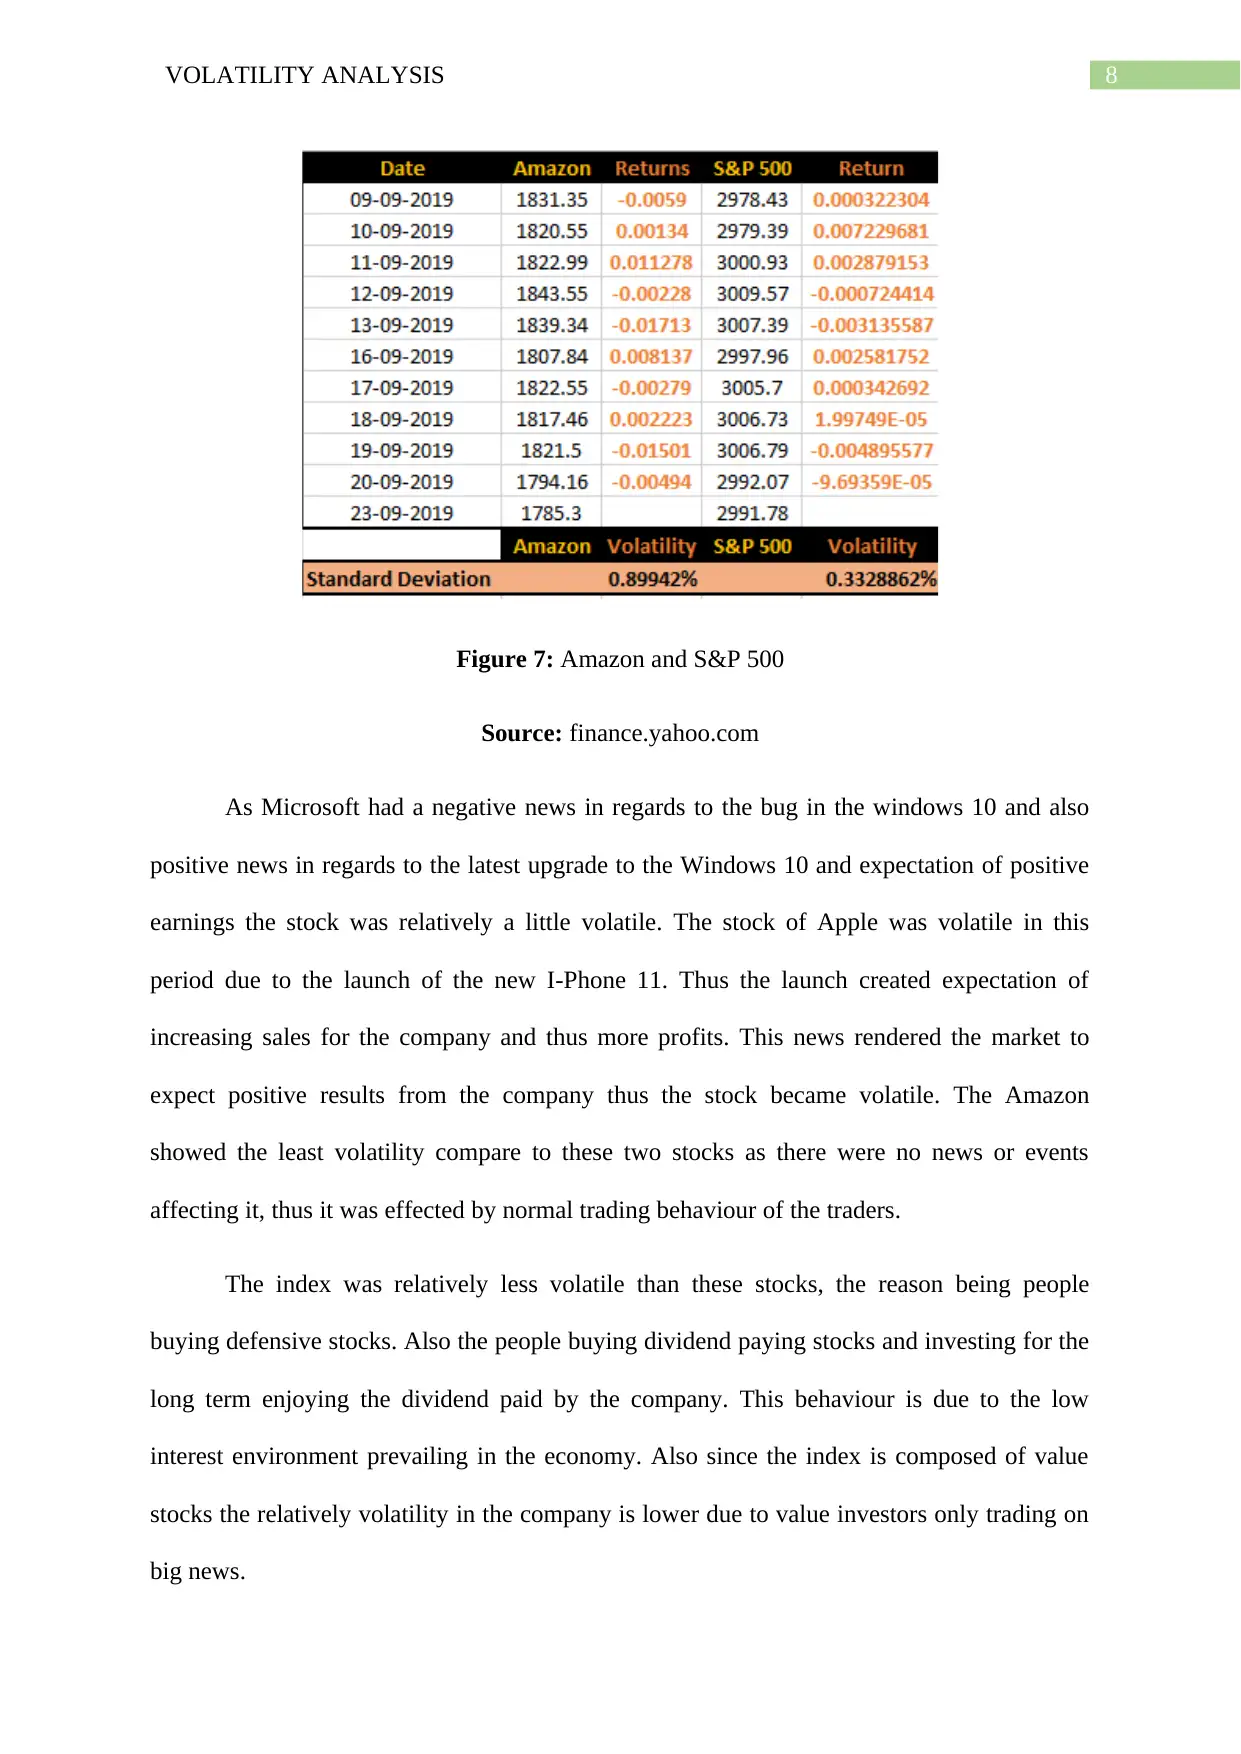
This report provides a detailed analysis of stock volatility for three major S&P 500 companies: Microsoft, Apple, and Amazon. The analysis includes calculating and comparing the volatility of these stocks over a 10-day period, along with an assessment of the S&P 500 index's volatility. The report examines the potential reasons behind the observed volatility, such as company-specific news (e.g., product launches, bug fixes) and overall market conditions. It compares the current volatility with the historical volatility during the 2008 financial crisis. The findings highlight the impact of news events on stock prices and the relationship between volatility and market sentiment, supported by references to financial publications and research.

Running head: VOLATILITY ANALYSIS
Volatility Analysis
Name of the Student:
Name of the University:
Author Note:
Volatility Analysis
Name of the Student:
Name of the University:
Author Note:
Paraphrase This Document
Need a fresh take? Get an instant paraphrase of this document with our AI Paraphraser

1VOLATILITY ANALYSIS
Executive Summary:
Volatility in the stocks is one of the most important part of any stock market analyst. As it
analyses the reason for the volatility and highlights any such volatility which might occur in
the future due to the reason. The report focuses on evaluating the volatility of three large
capitalization company of the S&P 500. The company being the Microsoft Corporation,
Apple Inc and Amazon Corporation. The stock prices of these company are taken for a 10
day period and volatility is measured. The reason are also determined for the volatility. The
S&P 500 index is also analysed and its volatility calculated and evaluated with the current
period and historical period of September 2008. Thus relevant conclusion and reason are
highlighted at the end of the report regarding volatility of these stocks and index.

2VOLATILITY ANALYSIS
Table of Contents
Introduction:...............................................................................................................................3
Discussion:.................................................................................................................................3
Volatility of the Stocks:.........................................................................................................3
Volatility of the Index:...........................................................................................................5
Comparison of Volatility:......................................................................................................7
Conclusion:................................................................................................................................9
References and Bibliographies:................................................................................................10
⊘ This is a preview!⊘
Do you want full access?
Subscribe today to unlock all pages.

Trusted by 1+ million students worldwide

3VOLATILITY ANALYSIS
Introduction:
The analysis of the volatility of the prices of large capitalization company is done to
evaluate how much a particular news or event has affected the price of a company. Thus the
changes in the volatility of the prices of the stock of a company helps analyst determine the
trend of the stock when there are expectation of any such news in future. The analysis is
conducted on three S&P 500 company. Microsoft Corporation, Apple Inc, and Amazon
Corporation. The benchmark is the index S&P 500, for the analysis purpose. The report aims
to highlight the volatility of the respective stocks and the index (Fadel & Al-Ajmi, 2018).
Discussion:
Volatility of the Stocks:
The volatility of the stocks of the three company is calculated by taking the historical
share price for the past 10 days. The holding period returns for the stocks or the daily returns
of the stock price is calculated.
Figure 1: Historical Share Price
Source: finance.yahoo.com
Paraphrase This Document
Need a fresh take? Get an instant paraphrase of this document with our AI Paraphraser

4VOLATILITY ANALYSIS
Thus by using the data for the stock price and the returns calculated with it, the daily
volatility of the stocks for a period of 10 days is shown below,
Figure 2: Volatility of Stocks
Source: By the Author
As it is seen from the table above the stock price of Apple Inc, is having the most
volatility at 1.45860%, while the volatility of the other two stocks Microsoft having a
volatility of 0.97751% and Amazon having a volatility of 0.89942%. Thus, Microsoft and
Amazon have volatility which is less than 1%, and Apple being the most volatile stock in our
analysis.
The Volatility in apple share price can be attributed to its launch of the new I-phone
11, this phone being one of the most important announcement of apple. Thus the phone was
launched on 20th September, the stock price being volatile due to the launch of this phone
(Stern, 2019).
The reason for volatility for the Microsoft stock was that the Windows 10 had a bug
problem which Microsoft tried to fix, but it led to more problems with the Start and the
Taskbar. The search function in the windows 10 were not working, also the launch of the new
Windows 10 upgrade is a positive news. Also the expectation of positive earnings in the
company has rendered the stock being a little volatile
(www.forbes.com/sites/sergeiklebnikov).
There were no recent big event news in amazon, thus the volatility in the stock can be
attributed to normal demand and supply of the market. The volatility can be attributed to

5VOLATILITY ANALYSIS
normal trading activity of the traders and investors in the stock market
(www.bloomberg.com/news/articles).
Volatility of the Index:
The S&P 500 index is an index constituting the largest company in America. It
consists of the large capitalization company and acts as a benchmark for many portfolio
managers and wealth managers. It can be considered as a proxy of the market portfolio.
Figure 3: Current Volatility of S&P 500
Source: finance.yahoo.com
The current volatility of the index is at the level of 0.33289%, which is calculated
using the historical index price for the last 10 days. Thus, to check how the S&P 500 index
performed around 11 years back during the September 2008, volatility is calculated for that
time period as well.
⊘ This is a preview!⊘
Do you want full access?
Subscribe today to unlock all pages.

Trusted by 1+ million students worldwide

6VOLATILITY ANALYSIS
Figure 4: Historical Volatility of S&P 500
Source: finance.yahoo.com
The Historical Volatility of the index in September 2008 is calculated and as it is
observed the volatility is very high at around 3.35449%.
The markets have the opinion of a recession with defensive stocks being a favourite
for investors, but also the bull market are optimist of a positive turnaround. However, the
index reaching to the all-time high but slips due to investor fear of recession. Thus however
the index has maintained to not be too volatile and has maintained a stable return. Thus there
are no such events or news which had created volatility in the stock during the analysis
period.
During this period in 2008, the world economy was facing the credit crisis and the fall
in Lehman Brothers (Benmelech & Bergman, 2018). Thus the confidence which people had
in the debt market was shattered bringing volatility in almost all the index in the world and
S&P 500 index was also affected by the same. The volatility of 3.35449% portrays the fear
which the investors had in the market during that period.
Paraphrase This Document
Need a fresh take? Get an instant paraphrase of this document with our AI Paraphraser

7VOLATILITY ANALYSIS
Comparison of Volatility:
The difference in volatility of the three stock with the S&P 500 is analysed and
relevant difference is observed,
Figure 5: Microsoft and S&P 500
Source: finance.yahoo.com
Figure 6: Apple and S&P 500
Source: finance.yahoo.com
Comparison of Volatility:
The difference in volatility of the three stock with the S&P 500 is analysed and
relevant difference is observed,
Figure 5: Microsoft and S&P 500
Source: finance.yahoo.com
Figure 6: Apple and S&P 500
Source: finance.yahoo.com

8VOLATILITY ANALYSIS
Figure 7: Amazon and S&P 500
Source: finance.yahoo.com
As Microsoft had a negative news in regards to the bug in the windows 10 and also
positive news in regards to the latest upgrade to the Windows 10 and expectation of positive
earnings the stock was relatively a little volatile. The stock of Apple was volatile in this
period due to the launch of the new I-Phone 11. Thus the launch created expectation of
increasing sales for the company and thus more profits. This news rendered the market to
expect positive results from the company thus the stock became volatile. The Amazon
showed the least volatility compare to these two stocks as there were no news or events
affecting it, thus it was effected by normal trading behaviour of the traders.
The index was relatively less volatile than these stocks, the reason being people
buying defensive stocks. Also the people buying dividend paying stocks and investing for the
long term enjoying the dividend paid by the company. This behaviour is due to the low
interest environment prevailing in the economy. Also since the index is composed of value
stocks the relatively volatility in the company is lower due to value investors only trading on
big news.
⊘ This is a preview!⊘
Do you want full access?
Subscribe today to unlock all pages.

Trusted by 1+ million students worldwide

9VOLATILITY ANALYSIS
Conclusion:
In this report it is concluded that the stocks of a company is affected by news which
tend to be positive or negative. This is measured by the difference in volatility which is seen
by the apple stock which reported positive news and its volatility was high. Also in case of
Microsoft stock the news was mixed and it was slightly volatile. While the Amazon stock
which had no news exhibited very low volatility. The index was affected by the credit crisis
and had a very high volatility at that time period while showing no volatility in the current
time period due to no significant news showing volatility.
Paraphrase This Document
Need a fresh take? Get an instant paraphrase of this document with our AI Paraphraser

10VOLATILITY ANALYSIS
References and Bibliographies:
Benmelech, E., & Bergman, N. K. (2018). Credit Market Freezes. NBER Macroeconomics
Annual, 32(1), 493-526.
Bloomberg - Are you a robot?. (2019). Bloomberg.com. Retrieved 24 September 2019, from
https://www.bloomberg.com/news/articles/2019-09-21/paranoia-written-all-over-s-p-
500-in-struggle-back-to-a-record
Fadel, S. M., & Al-Ajmi, J. (2018). Do Trading Volume and Volatility Relationship Differs
in Conventional and Islamic Stocks Evidence from Boursa Kuwait. Available at
SSRN 3331094.
Microsoft Stock Has Rallied 37% This Year. Now It Could Reach New Highs..
(2019). Forbes.com. Retrieved 24 September 2019, from
https://www.forbes.com/sites/sergeiklebnikov/2019/09/19/microsoft-stock-has-
rallied-37-this-year-now-it-could-reach-new-highs/
Stern, J. (2019). iOS 13, Apple’s Latest iPhone Update, Is Out—Just Be Cautious . WSJ.
Retrieved 24 September 2019, from https://www.wsj.com/articles/ios-13-apples-
latest-iphone-update-is-outproceed-with-caution-11568923253
Yahoo is now part of Oath. (2019). Finance.yahoo.com. Retrieved 24 September 2019, from
https://finance.yahoo.com/quote/%5EGSPC/community?p=%5EGSPC
Yahoo is now part of Oath. (2019). Finance.yahoo.com. Retrieved 24 September 2019, from
https://finance.yahoo.com/quote/AMZN/community?p=AMZN&.tsrc=fin-srch
Yahoo is now part of Oath. (2019). Finance.yahoo.com. Retrieved 24 September 2019, from
https://finance.yahoo.com/quote/AAPL/community?p=AAPL&.tsrc=fin-srch

11VOLATILITY ANALYSIS
Yahoo is now part of Oath. (2019). Finance.yahoo.com. Retrieved 24 September 2019, from
https://finance.yahoo.com/quote/MSFT/community?p=MSFT&.tsrc=fin-srch
Yahoo is now part of Oath. (2019). Finance.yahoo.com. Retrieved 24 September 2019, from
https://finance.yahoo.com/
Yahoo is now part of Oath. (2019). Finance.yahoo.com. Retrieved 24 September 2019, from
https://finance.yahoo.com/quote/MSFT/community?p=MSFT&.tsrc=fin-srch
Yahoo is now part of Oath. (2019). Finance.yahoo.com. Retrieved 24 September 2019, from
https://finance.yahoo.com/
⊘ This is a preview!⊘
Do you want full access?
Subscribe today to unlock all pages.

Trusted by 1+ million students worldwide
1 out of 12
Related Documents

Your All-in-One AI-Powered Toolkit for Academic Success.
+13062052269
info@desklib.com
Available 24*7 on WhatsApp / Email
Unlock your academic potential
Copyright © 2020–2025 A2Z Services. All Rights Reserved. Developed and managed by ZUCOL.