ECON1010, Sem 1 2019: Spain's Macroeconomic Policy Brief Analysis
VerifiedAdded on 2022/11/25
|12
|2199
|158
Report
AI Summary
This policy brief, prepared for ECON1010, examines the macroeconomic challenges facing Spain, specifically focusing on government debt and unemployment. The analysis utilizes data from Eurostat and The World Bank, presenting trends in government gross debt as a percentage of GDP and the unemployment rate. The brief identifies key issues, such as the rising debt-to-GDP ratio and persistently high unemployment, particularly among youth. It then proposes policy recommendations to address these challenges, including cutting public costs and enhancing tax collection to reduce the budget deficit, enhancing inter-regional migration to boost labor mobility, improving education and skills to increase employment prospects, and cutting regulatory hurdles for firms to increase the ease of doing business. The economic rationale behind each recommendation is provided, referencing sources such as the OECD and IMF, and justifying the proposed policy changes. This report serves as a comprehensive analysis and a set of actionable policy recommendations aimed at improving Spain's economic outlook.
Page 1 of 12
ECON1010, sem1 2019, assignment template
ECON 1010 – Macroeconomics 1
Policy Brief
(strictly follow the template below and use this template only for submission)
You must compose the policy brief according to the template detailed in this section. Instructions for each
required element of the brief are included within this template These instructions are reflected in the
requirements of the rubric detailed. Ensure that the policy brief includes each of the elements detailed in the
template, and that you do not reorder, rename, or omit any of these elements.
All members should agree with the following contribution weights to the group assignment.
Group members
Only one submission per group
Student name Student
number
% contribution
(must add up to 100%)
Signature (take a picture of
a signature and paste here)
Final mark
(tutors only)
Please indicate using * in student name who will be submitting the assignment in Turnitin (in Canvas) on the
group’s behalf.
Notes: Your final mark will then be calculated as the group work mark multiplied by
your contribution divided by the highest team member’s contribution. Note that if
equal contribution has been made by a group of 3 for example, the percentages should be
listed as “33.3%”. See the example below
Page 1 of 12
Paraphrase This Document
Need a fresh take? Get an instant paraphrase of this document with our AI Paraphraser
Page 2 of 12
ECON1010, sem1 2019, assignment template
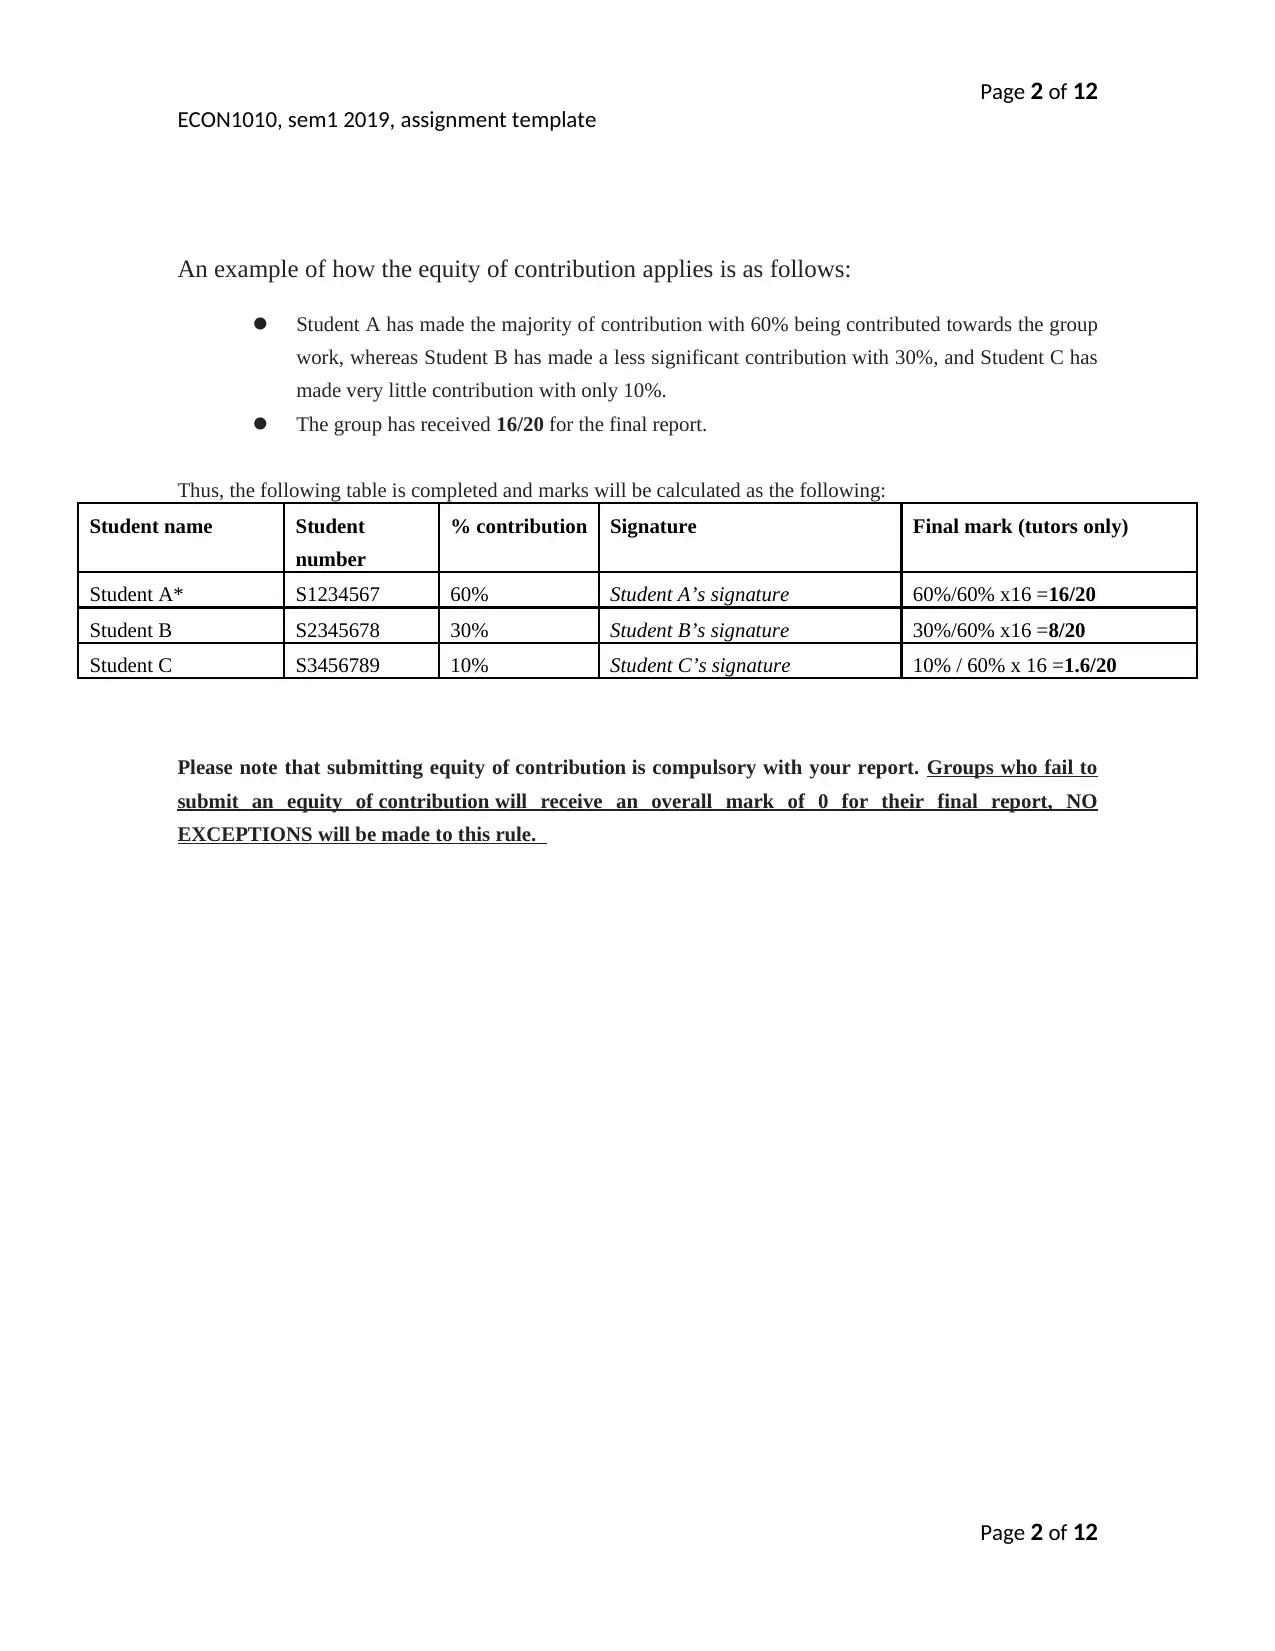
An example of how the equity of contribution applies is as follows:
Student A has made the majority of contribution with 60% being contributed towards the group
work, whereas Student B has made a less significant contribution with 30%, and Student C has
made very little contribution with only 10%.
The group has received 16/20 for the final report.
Thus, the following table is completed and marks will be calculated as the following:
Student name Student
number
% contribution Signature Final mark (tutors only)
Student A* S1234567 60% Student A’s signature 60%/60% x16 =16/20
Student B S2345678 30% Student B’s signature 30%/60% x16 =8/20
Student C S3456789 10% Student C’s signature 10% / 60% x 16 =1.6/20
Please note that submitting equity of contribution is compulsory with your report. Groups who fail to
submit an equity of contribution will receive an overall mark of 0 for their final report, NO
EXCEPTIONS will be made to this rule.
Page 2 of 12
ECON1010, sem1 2019, assignment template
An example of how the equity of contribution applies is as follows:
Student A has made the majority of contribution with 60% being contributed towards the group
work, whereas Student B has made a less significant contribution with 30%, and Student C has
made very little contribution with only 10%.
The group has received 16/20 for the final report.
Thus, the following table is completed and marks will be calculated as the following:
Student name Student
number
% contribution Signature Final mark (tutors only)
Student A* S1234567 60% Student A’s signature 60%/60% x16 =16/20
Student B S2345678 30% Student B’s signature 30%/60% x16 =8/20
Student C S3456789 10% Student C’s signature 10% / 60% x 16 =1.6/20
Please note that submitting equity of contribution is compulsory with your report. Groups who fail to
submit an equity of contribution will receive an overall mark of 0 for their final report, NO
EXCEPTIONS will be made to this rule.
Page 2 of 12
Page 3 of 12
ECON1010, sem1 2019, assignment template
Template
Part A: Diagnostics Analysis
Name of country: Spain
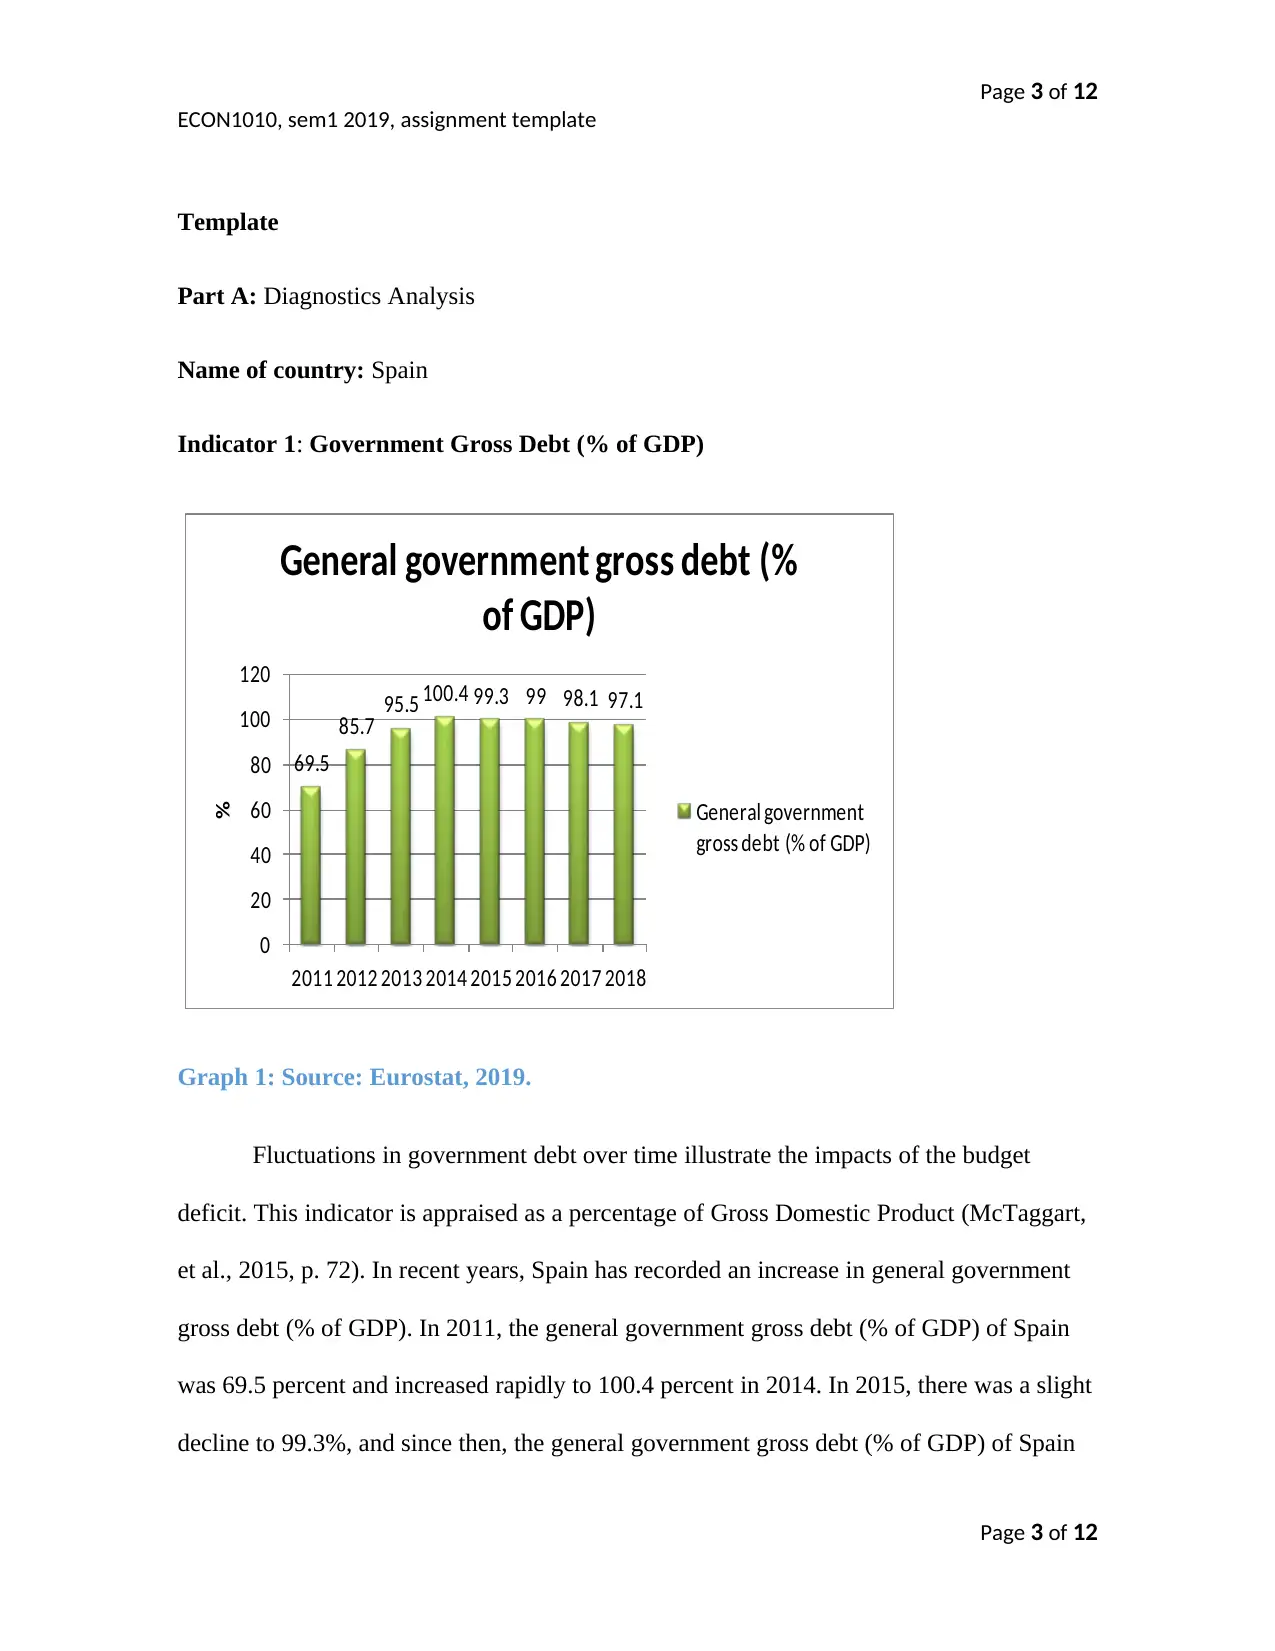
Indicator 1: Government Gross Debt (% of GDP)
69.5
85.7 95.5 100.4 99.3 99 98.1 97.1
0
20
40
60
80
100
120
2011 2012 2013 2014 2015 2016 2017 2018
%
General government gross debt (%
of GDP)
General government
gross debt (% of GDP)
Graph 1: Source: Eurostat, 2019.
Fluctuations in government debt over time illustrate the impacts of the budget
deficit. This indicator is appraised as a percentage of Gross Domestic Product (McTaggart,
et al., 2015, p. 72). In recent years, Spain has recorded an increase in general government
gross debt (% of GDP). In 2011, the general government gross debt (% of GDP) of Spain
was 69.5 percent and increased rapidly to 100.4 percent in 2014. In 2015, there was a slight
decline to 99.3%, and since then, the general government gross debt (% of GDP) of Spain
Page 3 of 12
ECON1010, sem1 2019, assignment template
Template
Part A: Diagnostics Analysis
Name of country: Spain
Indicator 1: Government Gross Debt (% of GDP)
69.5
85.7 95.5 100.4 99.3 99 98.1 97.1
0
20
40
60
80
100
120
2011 2012 2013 2014 2015 2016 2017 2018
%
General government gross debt (%
of GDP)
General government
gross debt (% of GDP)
Graph 1: Source: Eurostat, 2019.
Fluctuations in government debt over time illustrate the impacts of the budget
deficit. This indicator is appraised as a percentage of Gross Domestic Product (McTaggart,
et al., 2015, p. 72). In recent years, Spain has recorded an increase in general government
gross debt (% of GDP). In 2011, the general government gross debt (% of GDP) of Spain
was 69.5 percent and increased rapidly to 100.4 percent in 2014. In 2015, there was a slight
decline to 99.3%, and since then, the general government gross debt (% of GDP) of Spain
Page 3 of 12
⊘ This is a preview!⊘
Do you want full access?
Subscribe today to unlock all pages.
Trusted by 1+ million students worldwide
Page 4 of 12
ECON1010, sem1 2019, assignment template
has remained above 97 percent (Eurostat, 2019). The rising general government debt-to-
GDP ratio of this country is a sign of deteriorating health of economy and issues in the
sustainability of country finance.
2017Q1 2017Q2 2017Q3 2017Q4 2018Q1 2018Q2 2018Q3 2018Q4
95.5
96
96.5
97
97.5
98
98.5
99
99.5
100
99.7
99.4
98.4
98.1
98.7
98.2 98.3
97.1
General government gross debt % of GDP
Genera
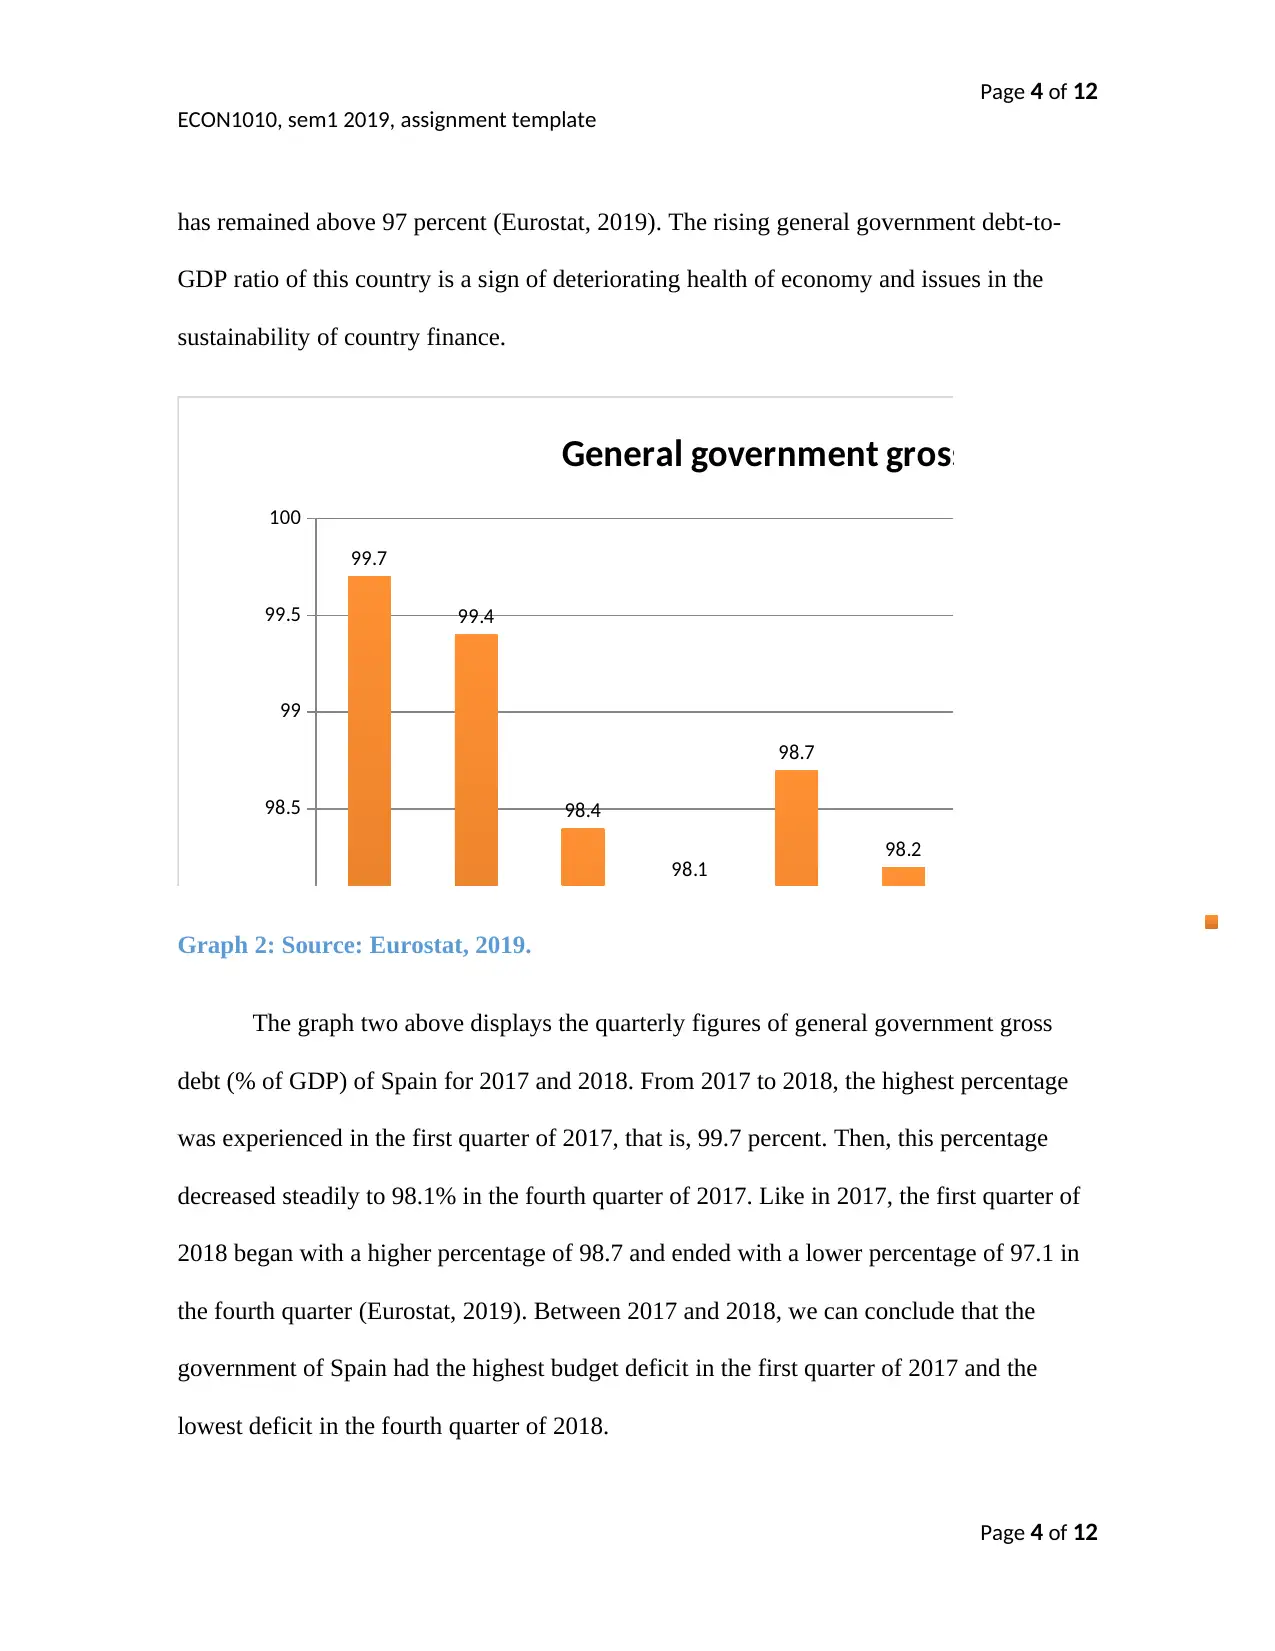
%Graph 2: Source: Eurostat, 2019.
The graph two above displays the quarterly figures of general government gross
debt (% of GDP) of Spain for 2017 and 2018. From 2017 to 2018, the highest percentage
was experienced in the first quarter of 2017, that is, 99.7 percent. Then, this percentage
decreased steadily to 98.1% in the fourth quarter of 2017. Like in 2017, the first quarter of
2018 began with a higher percentage of 98.7 and ended with a lower percentage of 97.1 in
the fourth quarter (Eurostat, 2019). Between 2017 and 2018, we can conclude that the
government of Spain had the highest budget deficit in the first quarter of 2017 and the
lowest deficit in the fourth quarter of 2018.
Page 4 of 12
ECON1010, sem1 2019, assignment template
has remained above 97 percent (Eurostat, 2019). The rising general government debt-to-
GDP ratio of this country is a sign of deteriorating health of economy and issues in the
sustainability of country finance.
2017Q1 2017Q2 2017Q3 2017Q4 2018Q1 2018Q2 2018Q3 2018Q4
95.5
96
96.5
97
97.5
98
98.5
99
99.5
100
99.7
99.4
98.4
98.1
98.7
98.2 98.3
97.1
General government gross debt % of GDP
Genera
%Graph 2: Source: Eurostat, 2019.
The graph two above displays the quarterly figures of general government gross
debt (% of GDP) of Spain for 2017 and 2018. From 2017 to 2018, the highest percentage
was experienced in the first quarter of 2017, that is, 99.7 percent. Then, this percentage
decreased steadily to 98.1% in the fourth quarter of 2017. Like in 2017, the first quarter of
2018 began with a higher percentage of 98.7 and ended with a lower percentage of 97.1 in
the fourth quarter (Eurostat, 2019). Between 2017 and 2018, we can conclude that the
government of Spain had the highest budget deficit in the first quarter of 2017 and the
lowest deficit in the fourth quarter of 2018.
Page 4 of 12
Paraphrase This Document
Need a fresh take? Get an instant paraphrase of this document with our AI Paraphraser
Page 5 of 12
ECON1010, sem1 2019, assignment template
Indicator 2: Unemployment Rate
2007 2008 2009 2010 2011 2012 2013 2014 2015 2016 201
0.0
5.0
10.0
15.0
20.0
25.0
30.0
8.2
11.3
17.9
19.9
21.4
24.8
26.1
24.4
22.1
19.6
17
Unemployment Rate
%
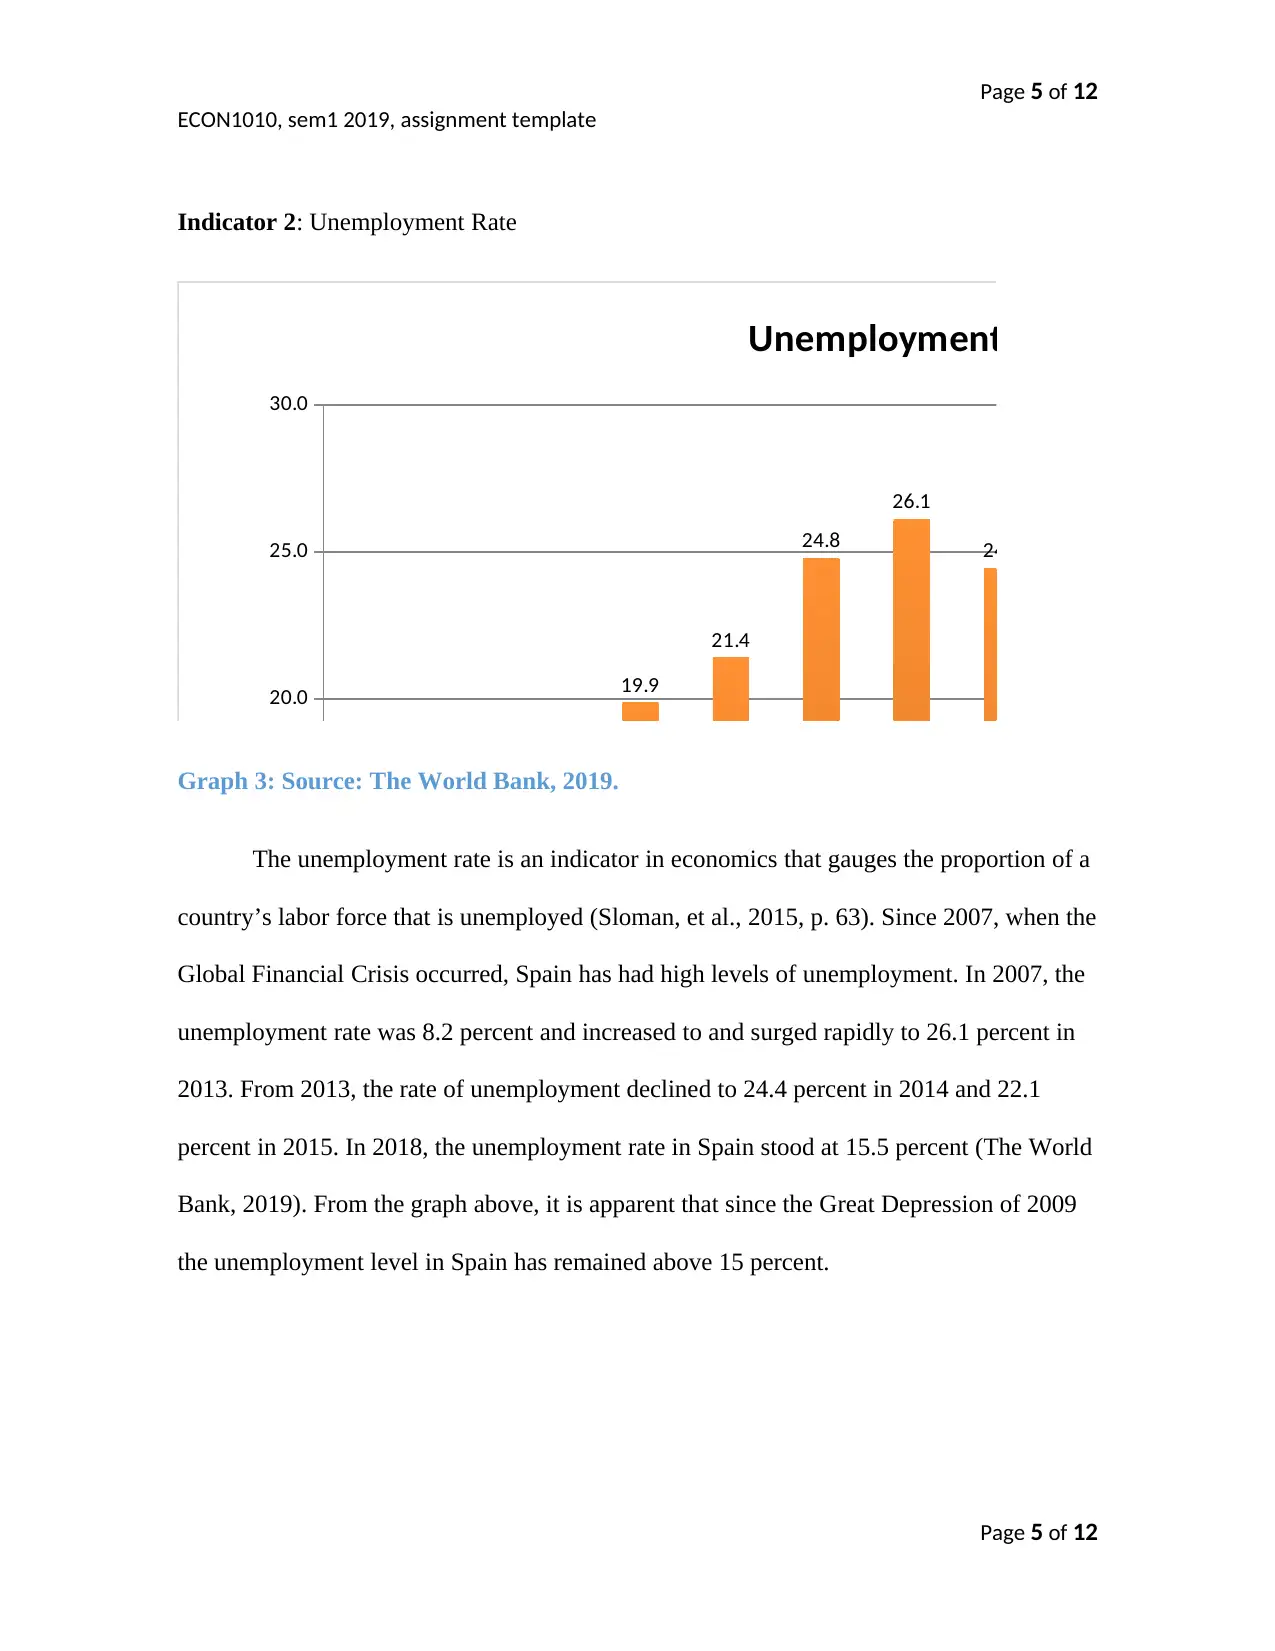
Graph 3: Source: The World Bank, 2019.
The unemployment rate is an indicator in economics that gauges the proportion of a
country’s labor force that is unemployed (Sloman, et al., 2015, p. 63). Since 2007, when the
Global Financial Crisis occurred, Spain has had high levels of unemployment. In 2007, the
unemployment rate was 8.2 percent and increased to and surged rapidly to 26.1 percent in
2013. From 2013, the rate of unemployment declined to 24.4 percent in 2014 and 22.1
percent in 2015. In 2018, the unemployment rate in Spain stood at 15.5 percent (The World
Bank, 2019). From the graph above, it is apparent that since the Great Depression of 2009
the unemployment level in Spain has remained above 15 percent.
Page 5 of 12
ECON1010, sem1 2019, assignment template
Indicator 2: Unemployment Rate
2007 2008 2009 2010 2011 2012 2013 2014 2015 2016 201
0.0
5.0
10.0
15.0
20.0
25.0
30.0
8.2
11.3
17.9
19.9
21.4
24.8
26.1
24.4
22.1
19.6
17
Unemployment Rate
%
Graph 3: Source: The World Bank, 2019.
The unemployment rate is an indicator in economics that gauges the proportion of a
country’s labor force that is unemployed (Sloman, et al., 2015, p. 63). Since 2007, when the
Global Financial Crisis occurred, Spain has had high levels of unemployment. In 2007, the
unemployment rate was 8.2 percent and increased to and surged rapidly to 26.1 percent in
2013. From 2013, the rate of unemployment declined to 24.4 percent in 2014 and 22.1
percent in 2015. In 2018, the unemployment rate in Spain stood at 15.5 percent (The World
Bank, 2019). From the graph above, it is apparent that since the Great Depression of 2009
the unemployment level in Spain has remained above 15 percent.
Page 5 of 12
Page 6 of 12
ECON1010, sem1 2019, assignment template
2017T1 2017T2 2017T3 2017T4 2018T1 2018T2 2018T3 2018T4 2019T
0.0
2.0
4.0
6.0
8.0
10.0
12.0
14.0
16.0
18.0
20.0
18.8
17.2
16.4 16.6 16.7
15.3
14.6 14.5 14.7
Unemployment Rate
%
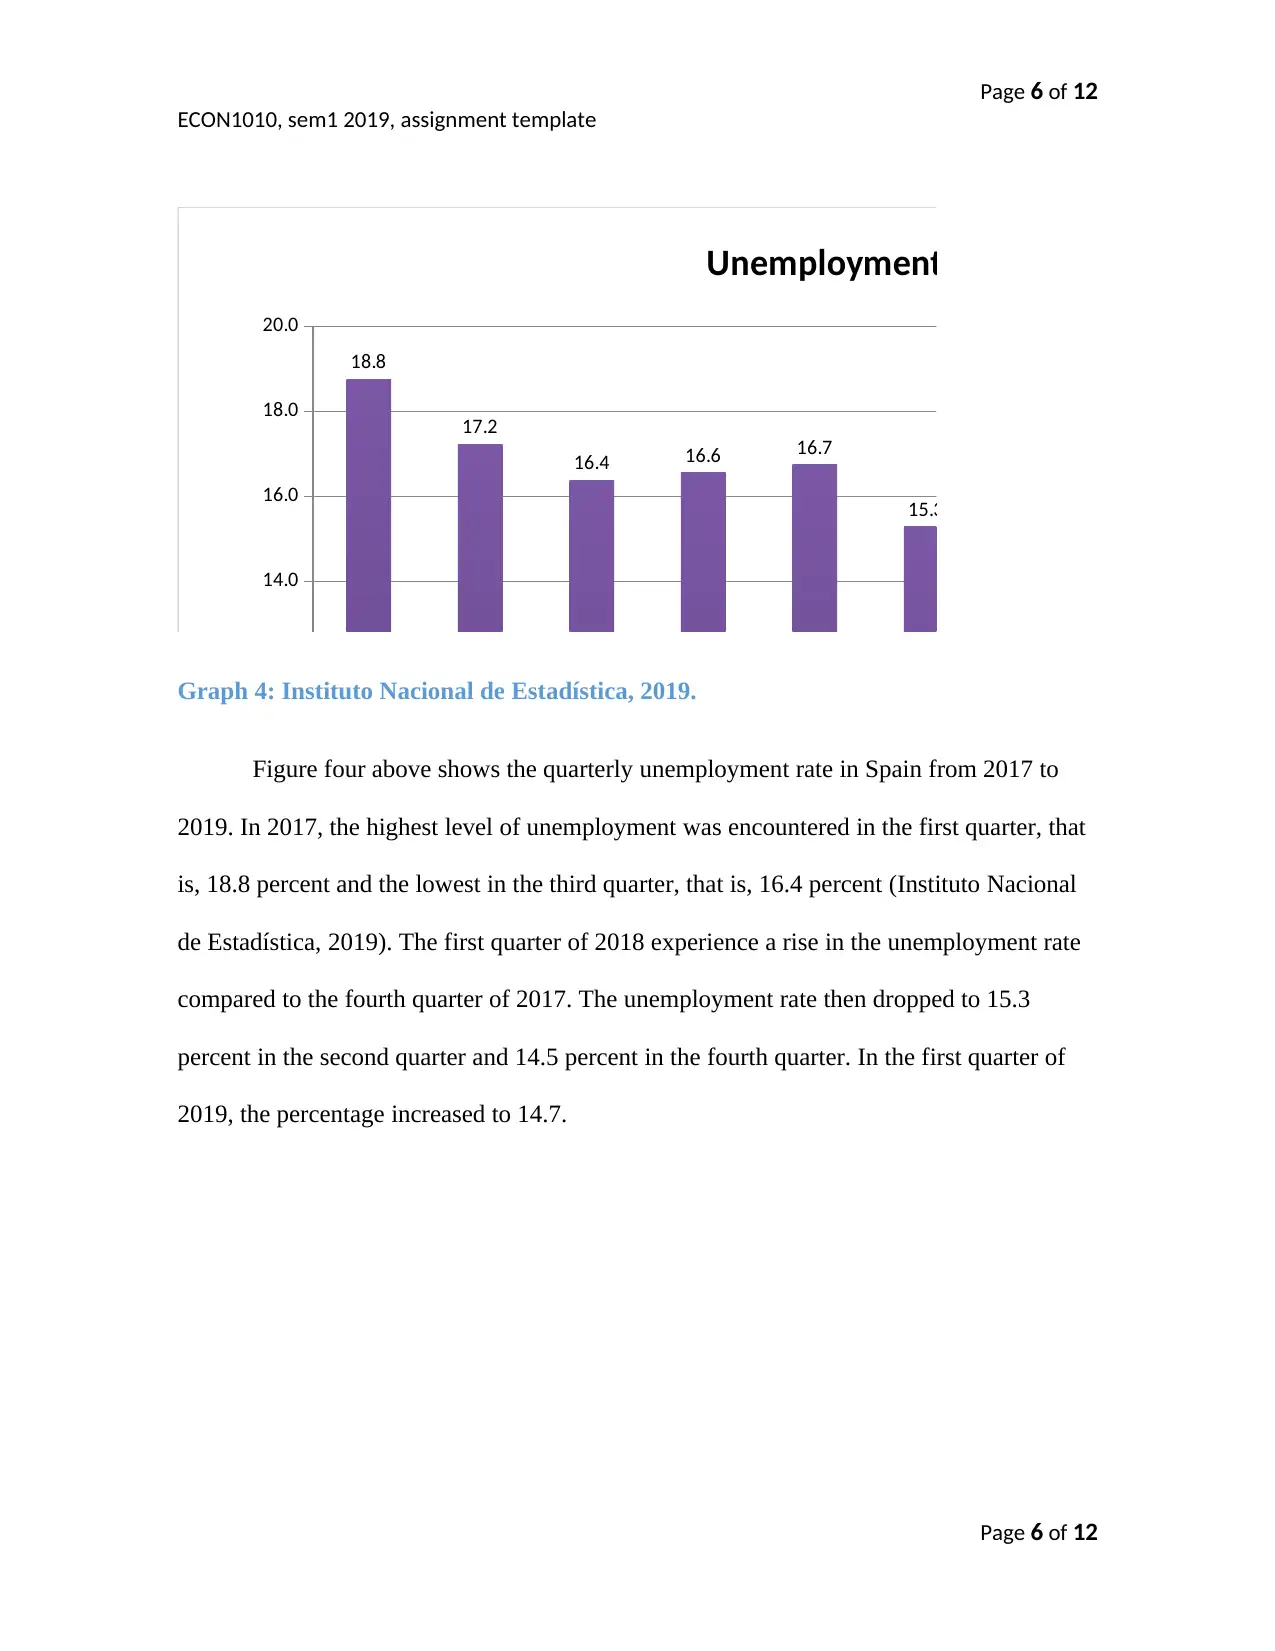
Graph 4: Instituto Nacional de Estadística, 2019.
Figure four above shows the quarterly unemployment rate in Spain from 2017 to
2019. In 2017, the highest level of unemployment was encountered in the first quarter, that
is, 18.8 percent and the lowest in the third quarter, that is, 16.4 percent (Instituto Nacional
de Estadística, 2019). The first quarter of 2018 experience a rise in the unemployment rate
compared to the fourth quarter of 2017. The unemployment rate then dropped to 15.3
percent in the second quarter and 14.5 percent in the fourth quarter. In the first quarter of
2019, the percentage increased to 14.7.
Page 6 of 12
ECON1010, sem1 2019, assignment template
2017T1 2017T2 2017T3 2017T4 2018T1 2018T2 2018T3 2018T4 2019T
0.0
2.0
4.0
6.0
8.0
10.0
12.0
14.0
16.0
18.0
20.0
18.8
17.2
16.4 16.6 16.7
15.3
14.6 14.5 14.7
Unemployment Rate
%
Graph 4: Instituto Nacional de Estadística, 2019.
Figure four above shows the quarterly unemployment rate in Spain from 2017 to
2019. In 2017, the highest level of unemployment was encountered in the first quarter, that
is, 18.8 percent and the lowest in the third quarter, that is, 16.4 percent (Instituto Nacional
de Estadística, 2019). The first quarter of 2018 experience a rise in the unemployment rate
compared to the fourth quarter of 2017. The unemployment rate then dropped to 15.3
percent in the second quarter and 14.5 percent in the fourth quarter. In the first quarter of
2019, the percentage increased to 14.7.
Page 6 of 12
⊘ This is a preview!⊘
Do you want full access?
Subscribe today to unlock all pages.
Trusted by 1+ million students worldwide
Page 7 of 12
ECON1010, sem1 2019, assignment template
Part B: Policy Brief
Briefing for the Prime Minister
Subject: Cutting government debt and reducing unemployment.
Executive summary
Since the Global Financial Crisis occurred in 2008, Spain has encountered an
increase in government debt as well as unemployment. Addressing these issues will help to
enhance economic growth. As a result, the leadership of this country should cut on public
costs and improve the tax collection to reduce government debt. Moreover, enhancing
education and skills, providing assistance to boost inter-regional migration, and slashing
regulatory hurdles for firms will contribute to a decline in the unemployment rate.
Recommendations
a) Cut public costs and enhance tax collection to reduce budget deficit.
b) Enhance inter-regional migration to boost labor mobility.
c) Enhance education and skills to boost employment prospects.
d) Cut regulatory hurdles for firms to increase the ease of doing business.
Economic rationale
The macro-financial exposures in Spain have been declining since 2007 since
private debt is falling and the financial system is becoming stronger (OECD, 2018).
However, macro-financial exposures when it comes to government debt have not
Page 7 of 12
Paraphrase This Document
Need a fresh take? Get an instant paraphrase of this document with our AI Paraphraser
Page 8 of 12
ECON1010, sem1 2019, assignment template
substantially declined. The high general government gross debt (% of GDP), that is, 97.1
percent in 2018 creates threats to medium-term sustainability.
The labor markets are improving given the previous labor market changes and wage
moderation (International Monetary Fund, 2017). The level of unemployment in Spain is
gradually declining. For instance, in 2013, the unemployment level in this country was at
its peak, that is, 26.1 percent. However, in 2018, the level of unemployment had declined to
15.5 percent showing a remarkable improvement in employment creation.
Despite this progress, the unemployment rate of 15 percent is still high, and in fact,
Spain is among countries in Europe with higher unemployment. Long term unemployment
and youth unemployment are particularly problematic in Spain are higher compared to the
OECD average (Rinke, 2019). Furthermore, the widespread of part-time and temporary
employees is resulting in vulnerabilities as well as contributing to the rise in income
inequalities.
The rapid surge in the unemployment rate in Spain during the Global Financial
Crisis also resulted from structural factors. The studies show that 31 percent of fall in
employment during the 2008-2009 economic downturn resulted from reduced labor
matching (OECD, 2018). Although Spain has experienced structural improvement in recent
years, reduced labor mobility, high long term unemployment, and skill mismatch are likely
to bar structural unemployment from decreasing to pre-crisis rate.
Justifications and the Rationale
Cut public costs and enhance tax collection
Page 8 of 12
Page 9 of 12
ECON1010, sem1 2019, assignment template
Government debt is a summation of budget deficits accumulated over the years.
Typically, budget deficit arises when government spending exceeds the revenue collected
through taxation. One way this government can reduce deficits is to public costs. Reducing
public costs is feasible and can be done in several ways. For instance, the government
should automate its services, such as procurement. Although the automation of services can
result in job loss, automation will result in several advantages such as reduced costs,
reduction in time for firms doing business with the government as well as a level playing
ground for firms. Furthermore, the government should broaden its tax base by collecting
funds from informal sectors and also put mechanisms in place to prevent tax evasion.
Enhance inter-regional migration
Labor mobility entails the ease with which workers can change location within the
economy or between different countries. Spain is experiencing low labor mobility because
of the absence of complete portability of housing and social rights (International Monetary
Fund, 2019). Therefore, the government should guarantee complete portability of the rights
across regions to enhance labor mobility and hence, unemployment reduction. Moreover,
the leadership of this country should introduce a single point of contact to support
employment seekers.
Enhance education and skills
In Spain, the unemployment rate is lower among those with tertiary education
compared to those with lower education levels. Also, skill mismatch is an issue in this
Page 9 of 12
⊘ This is a preview!⊘
Do you want full access?
Subscribe today to unlock all pages.
Trusted by 1+ million students worldwide
Page 10 of 12
ECON1010, sem1 2019, assignment template
country. As a result, the government should boost the quality of learning by ensuring that
the higher institutions of education are well equipped and also facilitate on- job-training.
Cut regulatory hurdles for firms
When related to other OECD countries, the ease of conducting business in Spain is
more difficult. Regulatory obstacles do not only increase the cost of doing business but also
keep away potential investors. Therefore, the leadership of Spain should ensure that both
the central government and regions enact policies that make it easy for businesses to
conduct their operations. Such a move will attract investors and result in employment
creation as well as an increase in government revenues.
Page 10 of 12
Paraphrase This Document
Need a fresh take? Get an instant paraphrase of this document with our AI Paraphraser
Page 11 of 12
ECON1010, sem1 2019, assignment template
Reference List
Eurostat, 2019. General government gross debt (Percentage of GDP) - annual data.
[Online]
Available at: https://ec.europa.eu/eurostat/tgm/table.do?
tab=table&init=1&language=en&pcode=teina225&plugin=1
[Accessed 16 May 2019].
Eurostat, 2019. General government gross debt (Percentage of GDP) - quarterly data.
[Online]
Available at: https://ec.europa.eu/eurostat/tgm/table.do?
tab=table&init=1&language=en&pcode=teina230&plugin=1
[Accessed 16 May 2019].
Instituto Nacional de Estadística, 2019. Economy. [Online]
Available at: https://www.ine.es/en/welcome.shtml
[Accessed 17 May 2019].
International Monetary Fund, 2017. Spanish Recovery: Key Numbers. [Online]
Available at: https://www.imf.org/en/News/Articles/2017/10/04/na100617-spanish-
recovery-key-numbers
[Accessed 19 May 2019].
International Monetary Fund, 2019. Spain: Time to Strengthen Resilience, Promote
Inclusive Growth. [Online]
Available at: https://www.imf.org/en/News/Articles/2018/11/20/na112018spain-time-to-
strengthen-resilience
[Accessed 19 May 2019].
McTaggart, D., Findlay, C. C. & Parkin, M., 2015. Economics. Frenchs Forest, N.S.W:
Pearson.
Page 11 of 12
Page 12 of 12
ECON1010, sem1 2019, assignment template
OECD, 2018. Economic Survey of Spain 2018. [Online]
Available at: https://www.oecd.org/eco/surveys/economic-survey-spain.htm
[Accessed 19 May 2019].
Rinke, A., 2019. Poorer EU countries should fight youth unemployment with reforms -
IMF’s Lagarde. [Online]
Available at: https://www.cnbc.com/2019/02/14/reuters-america-poorer-eu-countries-
should-fight-youth-unemployment-with-reforms--imfs-lagarde.html
[Accessed 19 May 2019].
Sloman, J., Wride, A. & Garratt, D., 2015. Economics. 9th ed. Harlow : Pearson.
The World Bank, 2019. Unemployment, total (% of total labor force) (modeled ILO
estimate). [Online]
Available at: https://data.worldbank.org/indicator/SL.UEM.TOTL.ZS
[Accessed 16 May 2019].
Page 12 of 12
⊘ This is a preview!⊘
Do you want full access?
Subscribe today to unlock all pages.
Trusted by 1+ million students worldwide
1 out of 12


Your All-in-One AI-Powered Toolkit for Academic Success.
+13062052269
info@desklib.com
Available 24*7 on WhatsApp / Email
![[object Object]](/_next/static/media/star-bottom.7253800d.svg)
Unlock your academic potential
Copyright © 2020–2026 A2Z Services. All Rights Reserved. Developed and managed by ZUCOL.