Komatsu Supply Chain: Spare Parts Inventory Management Analysis
VerifiedAdded on 2023/04/21
|48
|14320
|290
Report
AI Summary
This report delves into the inventory management challenges faced by Komatsu in its spare parts business, particularly concerning the high costs associated with Errors and Omissions (E&O) insurance and the difficulties in forecasting demand for spare parts. The analysis covers strategies for reducing E&O inventory, categorizing inventory items, identifying top items for targeted management, understanding obsolete and excess inventory, and developing plans for both disposition of O/E inventory and future prevention. It also explores opportunities for inventory pooling across locations, addressing price variances, and identifying cost reduction, lead time reduction, and inventory reduction opportunities. The report emphasizes the importance of improving supply chain design and forecasting procedures to enhance customer satisfaction and avoid potential customer loss due to stockouts. The ultimate goal is to assist Komatsu in optimizing its inventory management and forecasting processes for better overall performance.
University
Semester
Supply Chain Management
Student ID:
Student Name:
Submission Date:
1
Semester
Supply Chain Management
Student ID:
Student Name:
Submission Date:
1
Paraphrase This Document
Need a fresh take? Get an instant paraphrase of this document with our AI Paraphraser
Table of Contents
1. Introduction................................................................................................................................3
1.1 Problem Statement.................................................................................................................4
1.2 Aim .....................................................................................................................................4
1.3 Objectives...............................................................................................................................4
2. Question 1..................................................................................................................................4
2.1 Reduce E/O Inventory............................................................................................................5
2.2 Separate the Categories..........................................................................................................8
2.3 Determine the Top items to Target........................................................................................8
2.4 Understand the Obsolete and excess inventory......................................................................9
2.5 Develop plan to disposition O/E inventory............................................................................9
2.6 Develop plan for prevention in the future..............................................................................9
3. Question 2................................................................................................................................10
3.1 Opportunities for inventory to be “pooled” for all locations...............................................10
3.2 Same material numbers purchased in multiple locations?...................................................11
3.3 Price variances or different vendors.....................................................................................12
3.4 Opportunities for Cost Reduction, Lead Time Reduction, Inventory Reduction................26
4. Question 3................................................................................................................................28
5. Results and Discussion.............................................................................................................42
6. Conclusion................................................................................................................................44
7. Future work and Recommendations.........................................................................................46
References.......................................................................................................................................47
2
1. Introduction
In the inventory management of spare parts, the breakers are utilized in the
underground and surface mining industry for crushing the materials, where the materials such
as aggregate, coal etc., are moved from the mines to the collection points like ocean and train
vessels. The process of crushing the products into small pieces is denoted as the feeder
breaker operation, which is a self-destructive process. This process results in high rate of
replacement parts. To enhance customer satisfaction, the business of spare parts plays a major
role and it maximizes the opportunities of repurchasing. Thus, for the customers it ensures to
provide optimal service levels. In spare part inventory, forecasting is essential as it helps
with predictive management of the spare parts, by utilizing the previous and existing data.
When compared to the finished products, the supply chain management of spare parts is
highly complex. It is observed that forecasting is difficult, as the demand for the spare parts is
relatively inconsistent. The Supply chain performance is often evaluated against the speed of
the service measure like the OFLT (Order Fulfilment Lead Time). OFLT measures the time
taken from when the order is placed to customer receipt. As per the spare parts supply chain
management’s nature, it is important that to have short OFLT for effective performance.
Because, most of the customers don’t prefer ordering if the equipment breaks down.
However, some customers wait for the arrival of their order. But, due to stock out, there are
chances of satisfying the order, as the customers don’t wish to have downtime. This entire
problem arises due to the lack of spare parts in the shelves, as and when required. Hence,
results in manufacturing the replacements.
Such situation can be highly risky for the organizations like Komatsu. Because, the
poor inventory management can increase the chances of losing the customers. Therefore,
Komatsu is required to improve its supply chain management by efficiently improving its
supply chain design.
1.1 Problem Statement
The problem includes the company faces increased E&O (Errors and omissions
insurance) to 6 million. It is difficult and risky for the company to spend so much on liability
insurance claims made by the clients against the company and workers’ negligent actions or
inadequate work. The other problems include reducing the excess spare part inventory and
stocking the right amount of inventory for fulfilling the customer order.
3
⊘ This is a preview!⊘
Do you want full access?
Subscribe today to unlock all pages.
Trusted by 1+ million students worldwide
1.2 Aim
The main aim of this project is to help Komatsu Company improvise its inventory
management and forecasting procedures.
1.3 Objectives
The main objective of this project is to improve the inventory management of
Komatsu Company. At present, its inventory management fails to provide an effective
outcome thus resulting in loss of customers. Therefore, it aims for better utilization of
inventory management design along with an effective forecasting procedure.
According to the analysis of the inventory data, the following key points must be
understood, for improving the usage of inventory management design:
1) Evaluate the current inventory and separate by categories.
2) Determine the top items to be targeted.
3) Reduce the E/O inventory.
4) Develop a plan for the disposition of O/E inventory.
5) Develop a plan for the future prevention.
6) Look for areas to increase the turns and reduce the cost.
7) Avoid excess inventory.
2. Question 1
In this question, we use the current inventory data and display the total inventory at
the beginning of January globally. This data contains the all the CoCode category items and it
shows the 2 years and LWO based inventory data. In this question, we shall evaluate the
below mentioned points such as,
Reduce E/O Inventory
Separate the Categories
Determine the Top item to target
Understand the Obsolete and excess inventory
Develop plan to disposition O/E inventory
Develop plan for prevention in the future
4
Paraphrase This Document
Need a fresh take? Get an instant paraphrase of this document with our AI Paraphraser
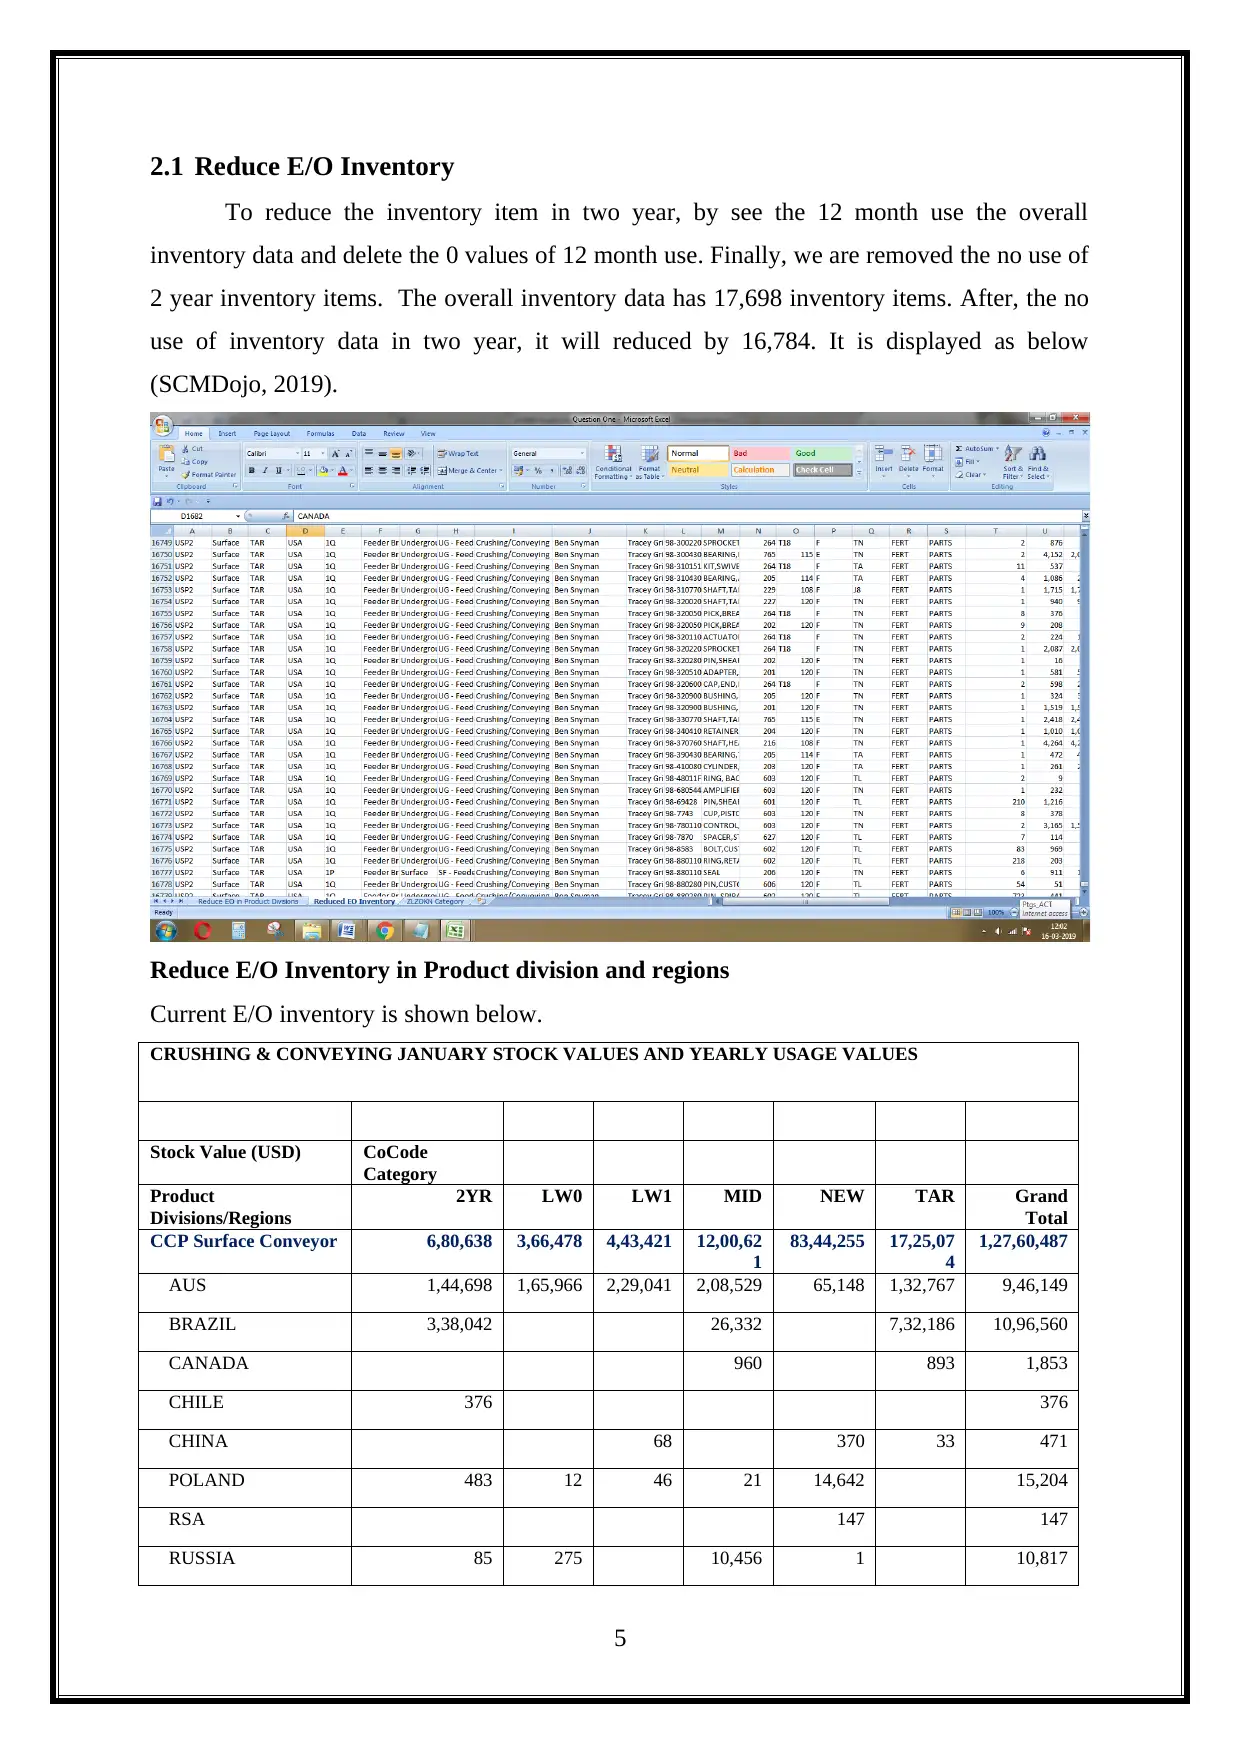
2.1 Reduce E/O Inventory
To reduce the inventory item in two year, by see the 12 month use the overall
inventory data and delete the 0 values of 12 month use. Finally, we are removed the no use of
2 year inventory items. The overall inventory data has 17,698 inventory items. After, the no
use of inventory data in two year, it will reduced by 16,784. It is displayed as below
(SCMDojo, 2019).
Reduce E/O Inventory in Product division and regions
Current E/O inventory is shown below.
CRUSHING & CONVEYING JANUARY STOCK VALUES AND YEARLY USAGE VALUES
Stock Value (USD) CoCode
Category
Product
Divisions/Regions
2YR LW0 LW1 MID NEW TAR Grand
Total
CCP Surface Conveyor 6,80,638 3,66,478 4,43,421 12,00,62
1
83,44,255 17,25,07
4
1,27,60,487
AUS 1,44,698 1,65,966 2,29,041 2,08,529 65,148 1,32,767 9,46,149
BRAZIL 3,38,042 26,332 7,32,186 10,96,560
CANADA 960 893 1,853
CHILE 376 376
CHINA 68 370 33 471
POLAND 483 12 46 21 14,642 15,204
RSA 147 147
RUSSIA 85 275 10,456 1 10,817
5
UK 1,65,929 1,06,391 91,234 6,87,296 82,42,811 2,97,045 95,90,706
USA 31,025 93,834 1,23,032 2,67,027 21,136 5,62,150 10,98,204
CCP Tunnel 80,109 1,742 26,381 10,11,417 4,315 11,23,964
RSA 16 16
UK 80,109 1,742 26,381 10,11,401 4,315 11,23,948
CCP Undrgrd
Conveyor
23,55,812 9,73,931 33,07,93
8
38,06,59
7
19,44,678 54,25,11
1
1,78,14,067
AUS 6,34,831 3,50,656 11,77,63
4
8,60,733 5,77,350 3,32,004 39,33,208
BRAZIL 1,34,126 1,34,126
CANADA 197 79,686 40,604 1,57,968 2,78,455
CHILE 333 333
CHINA 879 47 71 17 105 548 1,667
MEXICO 11,021 11,021
PERU 2,389 10,312 12,701
POLAND 1 40 1,847 1,888
RSA 169 0 169
RUSSIA 9,45,455 0 15,293 4,128 41,575 0 10,06,451
UK 1,52,109 1,14,958 5,20,278 7,39,848 4,02,172 10,35,98
7
29,65,352
USA 6,08,429 3,74,144 15,94,66
2
21,22,18
4
8,72,520 38,96,75
7
94,68,696
Goodman - Hewitt 2,24,171 1,64,171 3,17,792 2,67,626 6,481 2,58,276 12,38,517
AUS 198 153 351
CANADA 1,405 1,405
CHINA 42 42
MEXICO 2,065 2,065
RUSSIA 8 661 669
USA 2,22,106 1,64,163 3,17,792 2,66,221 6,241 2,57,462 12,33,985
Grand Total 33,40,730 15,06,32
2
40,69,15
1
53,01,22
5
1,13,06,83
1
74,12,77
6
3,29,37,035
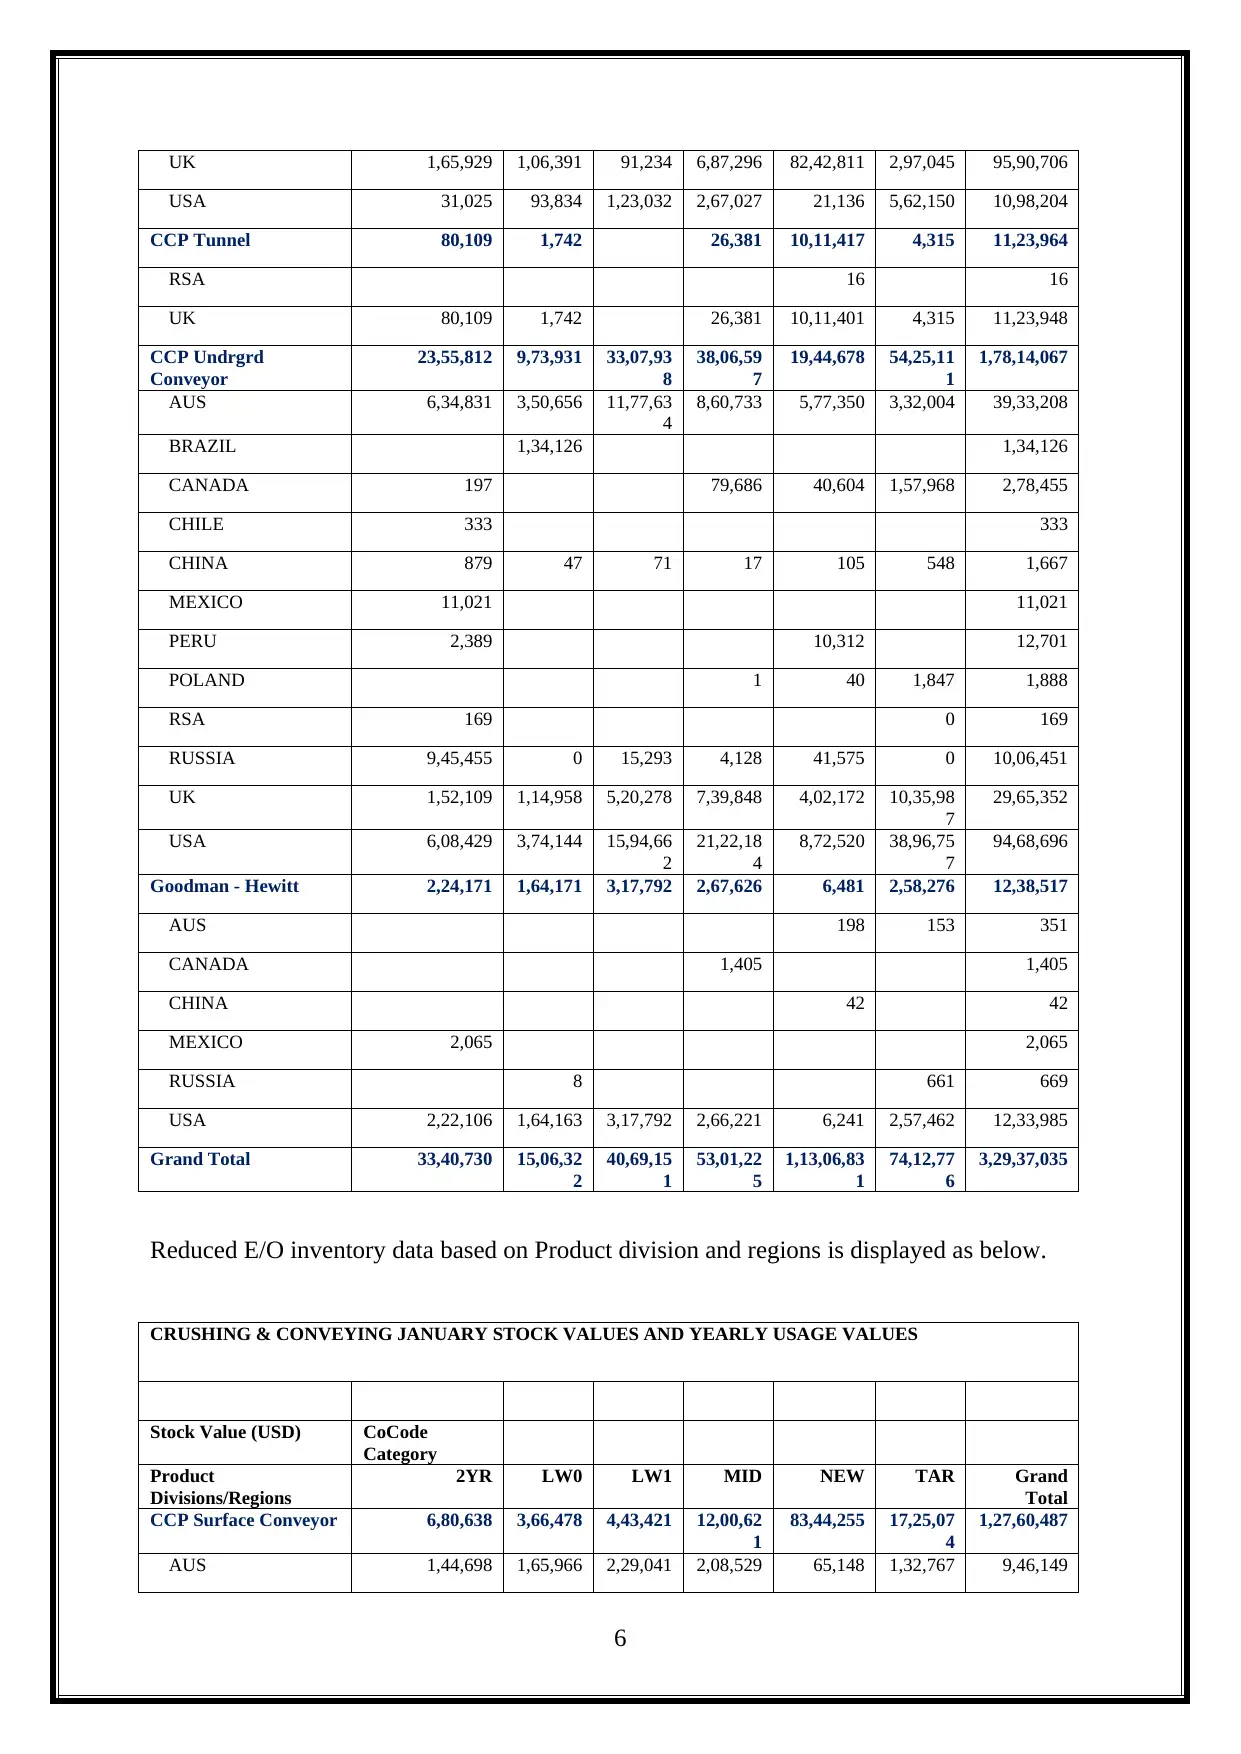
Reduced E/O inventory data based on Product division and regions is displayed as below.
CRUSHING & CONVEYING JANUARY STOCK VALUES AND YEARLY USAGE VALUES
Stock Value (USD) CoCode
Category
Product
Divisions/Regions
2YR LW0 LW1 MID NEW TAR Grand
Total
CCP Surface Conveyor 6,80,638 3,66,478 4,43,421 12,00,62
1
83,44,255 17,25,07
4
1,27,60,487
AUS 1,44,698 1,65,966 2,29,041 2,08,529 65,148 1,32,767 9,46,149
6
USA 31,025 93,834 1,23,032 2,67,027 21,136 5,62,150 10,98,204
CCP Tunnel 80,109 1,742 26,381 10,11,417 4,315 11,23,964
RSA 16 16
UK 80,109 1,742 26,381 10,11,401 4,315 11,23,948
CCP Undrgrd
Conveyor
23,55,812 9,73,931 33,07,93
8
38,06,59
7
19,44,678 54,25,11
1
1,78,14,067
AUS 6,34,831 3,50,656 11,77,63
4
8,60,733 5,77,350 3,32,004 39,33,208
BRAZIL 1,34,126 1,34,126
CANADA 197 79,686 40,604 1,57,968 2,78,455
CHILE 333 333
CHINA 879 47 71 17 105 548 1,667
MEXICO 11,021 11,021
PERU 2,389 10,312 12,701
POLAND 1 40 1,847 1,888
RSA 169 0 169
RUSSIA 9,45,455 0 15,293 4,128 41,575 0 10,06,451
UK 1,52,109 1,14,958 5,20,278 7,39,848 4,02,172 10,35,98
7
29,65,352
USA 6,08,429 3,74,144 15,94,66
2
21,22,18
4
8,72,520 38,96,75
7
94,68,696
Goodman - Hewitt 2,24,171 1,64,171 3,17,792 2,67,626 6,481 2,58,276 12,38,517
AUS 198 153 351
CANADA 1,405 1,405
CHINA 42 42
MEXICO 2,065 2,065
RUSSIA 8 661 669
USA 2,22,106 1,64,163 3,17,792 2,66,221 6,241 2,57,462 12,33,985
Grand Total 33,40,730 15,06,32
2
40,69,15
1
53,01,22
5
1,13,06,83
1
74,12,77
6
3,29,37,035
Reduced E/O inventory data based on Product division and regions is displayed as below.
CRUSHING & CONVEYING JANUARY STOCK VALUES AND YEARLY USAGE VALUES
Stock Value (USD) CoCode
Category
Product
Divisions/Regions
2YR LW0 LW1 MID NEW TAR Grand
Total
CCP Surface Conveyor 6,80,638 3,66,478 4,43,421 12,00,62
1
83,44,255 17,25,07
4
1,27,60,487
AUS 1,44,698 1,65,966 2,29,041 2,08,529 65,148 1,32,767 9,46,149
6
⊘ This is a preview!⊘
Do you want full access?
Subscribe today to unlock all pages.
Trusted by 1+ million students worldwide
BRAZIL 3,38,042 26,332 7,32,186 10,96,560
CHILE 376 376
POLAND 483 12 46 21 14,642 15,204
RUSSIA 85 275 10,456 1 10,817
UK 1,65,929 1,06,391 91,234 6,87,296 82,42,811 2,97,045 95,90,706
USA 31,025 93,834 1,23,032 2,67,027 21,136 5,62,150 10,98,204
CCP Tunnel 80,109 1,742 26,381 10,11,417 4,315 11,23,964
UK 80,109 1,742 26,381 10,11,401 4,315 11,23,948
CCP Undrgrd
Conveyor
23,55,812 9,73,931 33,07,93
8
38,06,59
7
19,44,678 54,25,11
1
1,78,14,067
AUS 6,34,831 3,50,656 11,77,63
4
8,60,733 5,77,350 3,32,004 39,33,208
CANADA 197 79,686 40,604 1,57,968 2,78,455
CHILE 333 333
CHINA 879 47 71 17 105 548 1,667
MEXICO 11,021 11,021
PERU 2,389 10,312 12,701
RSA 169 0 169
RUSSIA 9,45,455 0 15,293 4,128 41,575 0 10,06,451
UK 1,52,109 1,14,958 5,20,278 7,39,848 4,02,172 10,35,98
7
29,65,352
USA 6,08,429 3,74,144 15,94,66
2
21,22,18
4
8,72,520 38,96,75
7
94,68,696
Goodman - Hewitt 2,24,171 1,64,171 3,17,792 2,67,626 6,481 2,58,276 12,38,517
MEXICO 2,065 2,065
USA 2,22,106 1,64,163 3,17,792 2,66,221 6,241 2,57,462 12,33,985
Grand Total 33,40,730 15,06,32
2
40,69,15
1
53,01,22
5
1,13,06,83
1
74,12,77
6
3,29,37,035
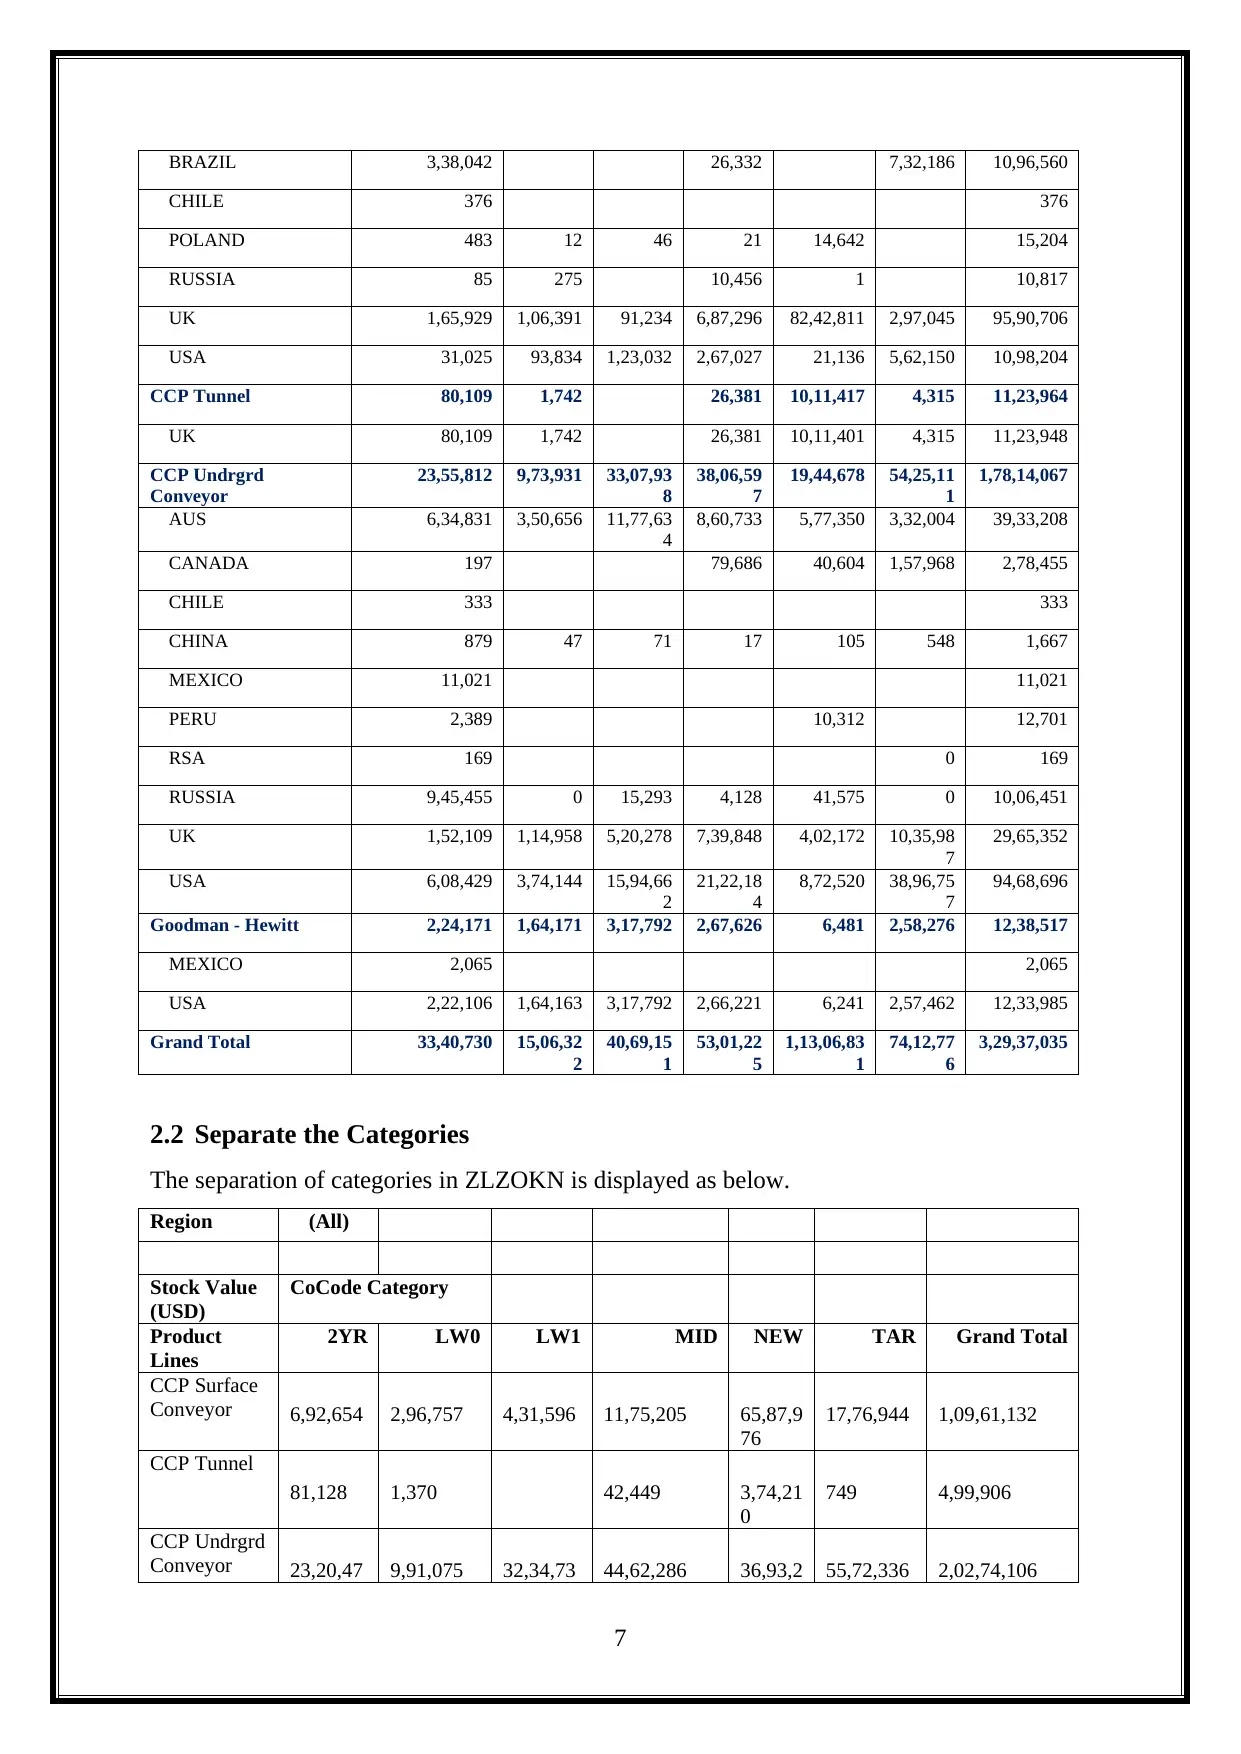
2.2 Separate the Categories
The separation of categories in ZLZOKN is displayed as below.
Region (All)
Stock Value
(USD)
CoCode Category
Product
Lines
2YR LW0 LW1 MID NEW TAR Grand Total
CCP Surface
Conveyor 6,92,654 2,96,757 4,31,596 11,75,205 65,87,9
76
17,76,944 1,09,61,132
CCP Tunnel
81,128 1,370 42,449 3,74,21
0
749 4,99,906
CCP Undrgrd
Conveyor 23,20,47 9,91,075 32,34,73 44,62,286 36,93,2 55,72,336 2,02,74,106
7
CHILE 376 376
POLAND 483 12 46 21 14,642 15,204
RUSSIA 85 275 10,456 1 10,817
UK 1,65,929 1,06,391 91,234 6,87,296 82,42,811 2,97,045 95,90,706
USA 31,025 93,834 1,23,032 2,67,027 21,136 5,62,150 10,98,204
CCP Tunnel 80,109 1,742 26,381 10,11,417 4,315 11,23,964
UK 80,109 1,742 26,381 10,11,401 4,315 11,23,948
CCP Undrgrd
Conveyor
23,55,812 9,73,931 33,07,93
8
38,06,59
7
19,44,678 54,25,11
1
1,78,14,067
AUS 6,34,831 3,50,656 11,77,63
4
8,60,733 5,77,350 3,32,004 39,33,208
CANADA 197 79,686 40,604 1,57,968 2,78,455
CHILE 333 333
CHINA 879 47 71 17 105 548 1,667
MEXICO 11,021 11,021
PERU 2,389 10,312 12,701
RSA 169 0 169
RUSSIA 9,45,455 0 15,293 4,128 41,575 0 10,06,451
UK 1,52,109 1,14,958 5,20,278 7,39,848 4,02,172 10,35,98
7
29,65,352
USA 6,08,429 3,74,144 15,94,66
2
21,22,18
4
8,72,520 38,96,75
7
94,68,696
Goodman - Hewitt 2,24,171 1,64,171 3,17,792 2,67,626 6,481 2,58,276 12,38,517
MEXICO 2,065 2,065
USA 2,22,106 1,64,163 3,17,792 2,66,221 6,241 2,57,462 12,33,985
Grand Total 33,40,730 15,06,32
2
40,69,15
1
53,01,22
5
1,13,06,83
1
74,12,77
6
3,29,37,035
2.2 Separate the Categories
The separation of categories in ZLZOKN is displayed as below.
Region (All)
Stock Value
(USD)
CoCode Category
Product
Lines
2YR LW0 LW1 MID NEW TAR Grand Total
CCP Surface
Conveyor 6,92,654 2,96,757 4,31,596 11,75,205 65,87,9
76
17,76,944 1,09,61,132
CCP Tunnel
81,128 1,370 42,449 3,74,21
0
749 4,99,906
CCP Undrgrd
Conveyor 23,20,47 9,91,075 32,34,73 44,62,286 36,93,2 55,72,336 2,02,74,106
7
Paraphrase This Document
Need a fresh take? Get an instant paraphrase of this document with our AI Paraphraser
8 1 00
Feeder Brk
AbovG 4,11,409 2,13,683 1,49,794 3,35,105 8,80,51
9
2,28,790 22,19,300
Feeder Brk
UndG 24,60,09
2
10,28,939 17,28,80
2
39,49,821 25,72,8
58
22,16,354 1,39,56,866
Goodman -
Hewitt 2,00,736 2,41,657 3,06,409 2,83,948 32,041 2,67,793 13,32,584
Sizer
15,720 2,947 9,170 24,369 1,75,38
7
7,870 2,35,463
Grand Total
61,82,21
7
27,76,428 58,60,50
2
1,02,73,183 1,43,16
,191
1,00,70,83
6
4,94,79,357
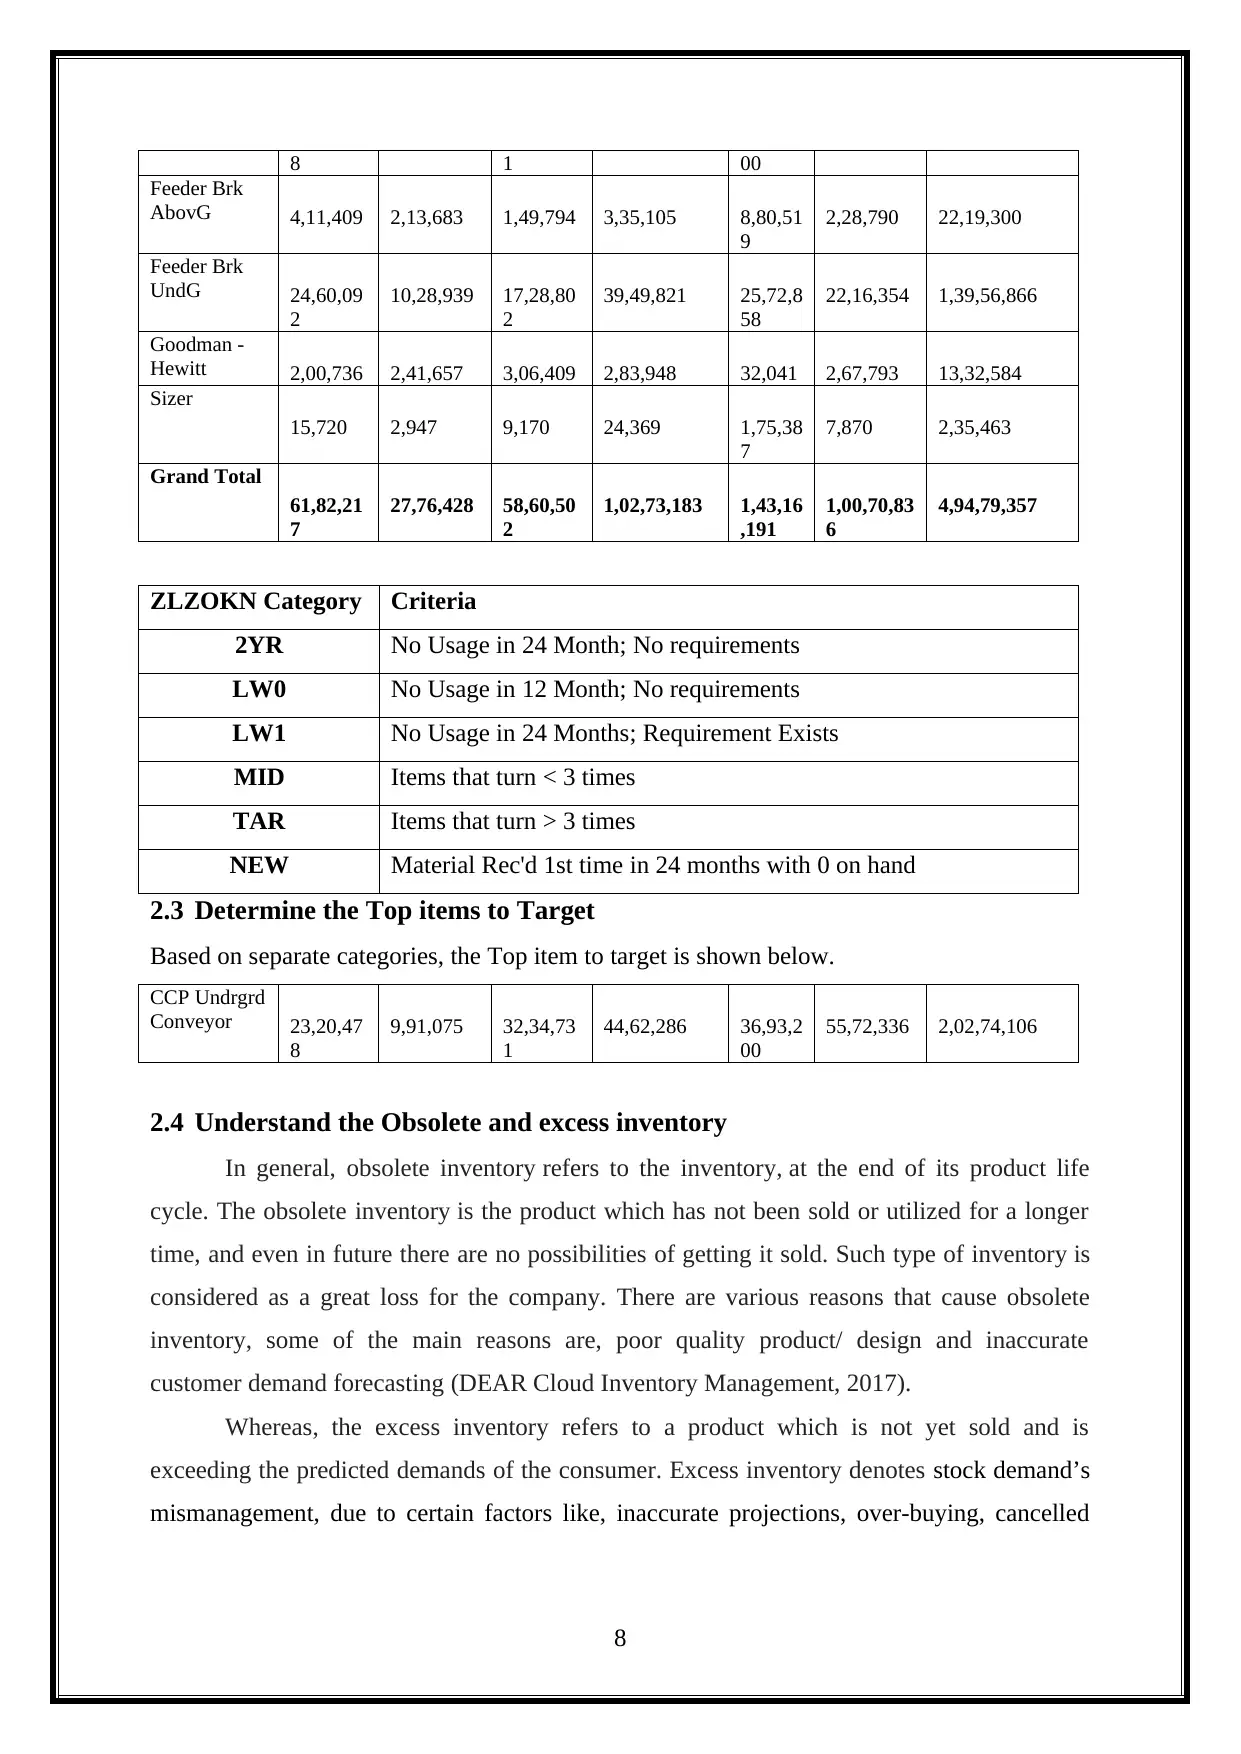
ZLZOKN Category Criteria
2YR No Usage in 24 Month; No requirements
LW0 No Usage in 12 Month; No requirements
LW1 No Usage in 24 Months; Requirement Exists
MID Items that turn < 3 times
TAR Items that turn > 3 times
NEW Material Rec'd 1st time in 24 months with 0 on hand
2.3 Determine the Top items to Target
Based on separate categories, the Top item to target is shown below.
CCP Undrgrd
Conveyor 23,20,47
8
9,91,075 32,34,73
1
44,62,286 36,93,2
00
55,72,336 2,02,74,106
2.4 Understand the Obsolete and excess inventory
In general, obsolete inventory refers to the inventory, at the end of its product life
cycle. The obsolete inventory is the product which has not been sold or utilized for a longer
time, and even in future there are no possibilities of getting it sold. Such type of inventory is
considered as a great loss for the company. There are various reasons that cause obsolete
inventory, some of the main reasons are, poor quality product/ design and inaccurate
customer demand forecasting (DEAR Cloud Inventory Management, 2017).
Whereas, the excess inventory refers to a product which is not yet sold and is
exceeding the predicted demands of the consumer. Excess inventory denotes stock demand’s
mismanagement, due to certain factors like, inaccurate projections, over-buying, cancelled
8
Feeder Brk
AbovG 4,11,409 2,13,683 1,49,794 3,35,105 8,80,51
9
2,28,790 22,19,300
Feeder Brk
UndG 24,60,09
2
10,28,939 17,28,80
2
39,49,821 25,72,8
58
22,16,354 1,39,56,866
Goodman -
Hewitt 2,00,736 2,41,657 3,06,409 2,83,948 32,041 2,67,793 13,32,584
Sizer
15,720 2,947 9,170 24,369 1,75,38
7
7,870 2,35,463
Grand Total
61,82,21
7
27,76,428 58,60,50
2
1,02,73,183 1,43,16
,191
1,00,70,83
6
4,94,79,357
ZLZOKN Category Criteria
2YR No Usage in 24 Month; No requirements
LW0 No Usage in 12 Month; No requirements
LW1 No Usage in 24 Months; Requirement Exists
MID Items that turn < 3 times
TAR Items that turn > 3 times
NEW Material Rec'd 1st time in 24 months with 0 on hand
2.3 Determine the Top items to Target
Based on separate categories, the Top item to target is shown below.
CCP Undrgrd
Conveyor 23,20,47
8
9,91,075 32,34,73
1
44,62,286 36,93,2
00
55,72,336 2,02,74,106
2.4 Understand the Obsolete and excess inventory
In general, obsolete inventory refers to the inventory, at the end of its product life
cycle. The obsolete inventory is the product which has not been sold or utilized for a longer
time, and even in future there are no possibilities of getting it sold. Such type of inventory is
considered as a great loss for the company. There are various reasons that cause obsolete
inventory, some of the main reasons are, poor quality product/ design and inaccurate
customer demand forecasting (DEAR Cloud Inventory Management, 2017).
Whereas, the excess inventory refers to a product which is not yet sold and is
exceeding the predicted demands of the consumer. Excess inventory denotes stock demand’s
mismanagement, due to certain factors like, inaccurate projections, over-buying, cancelled
8
orders, unexpected changes in weather, late or early delivery of goods and company’s bad
economy situation (INTURN, 2017).
Therefore, it is essential for a company to balance the inventory, and avoid both
obsolete and excess inventory, by utilizing software.
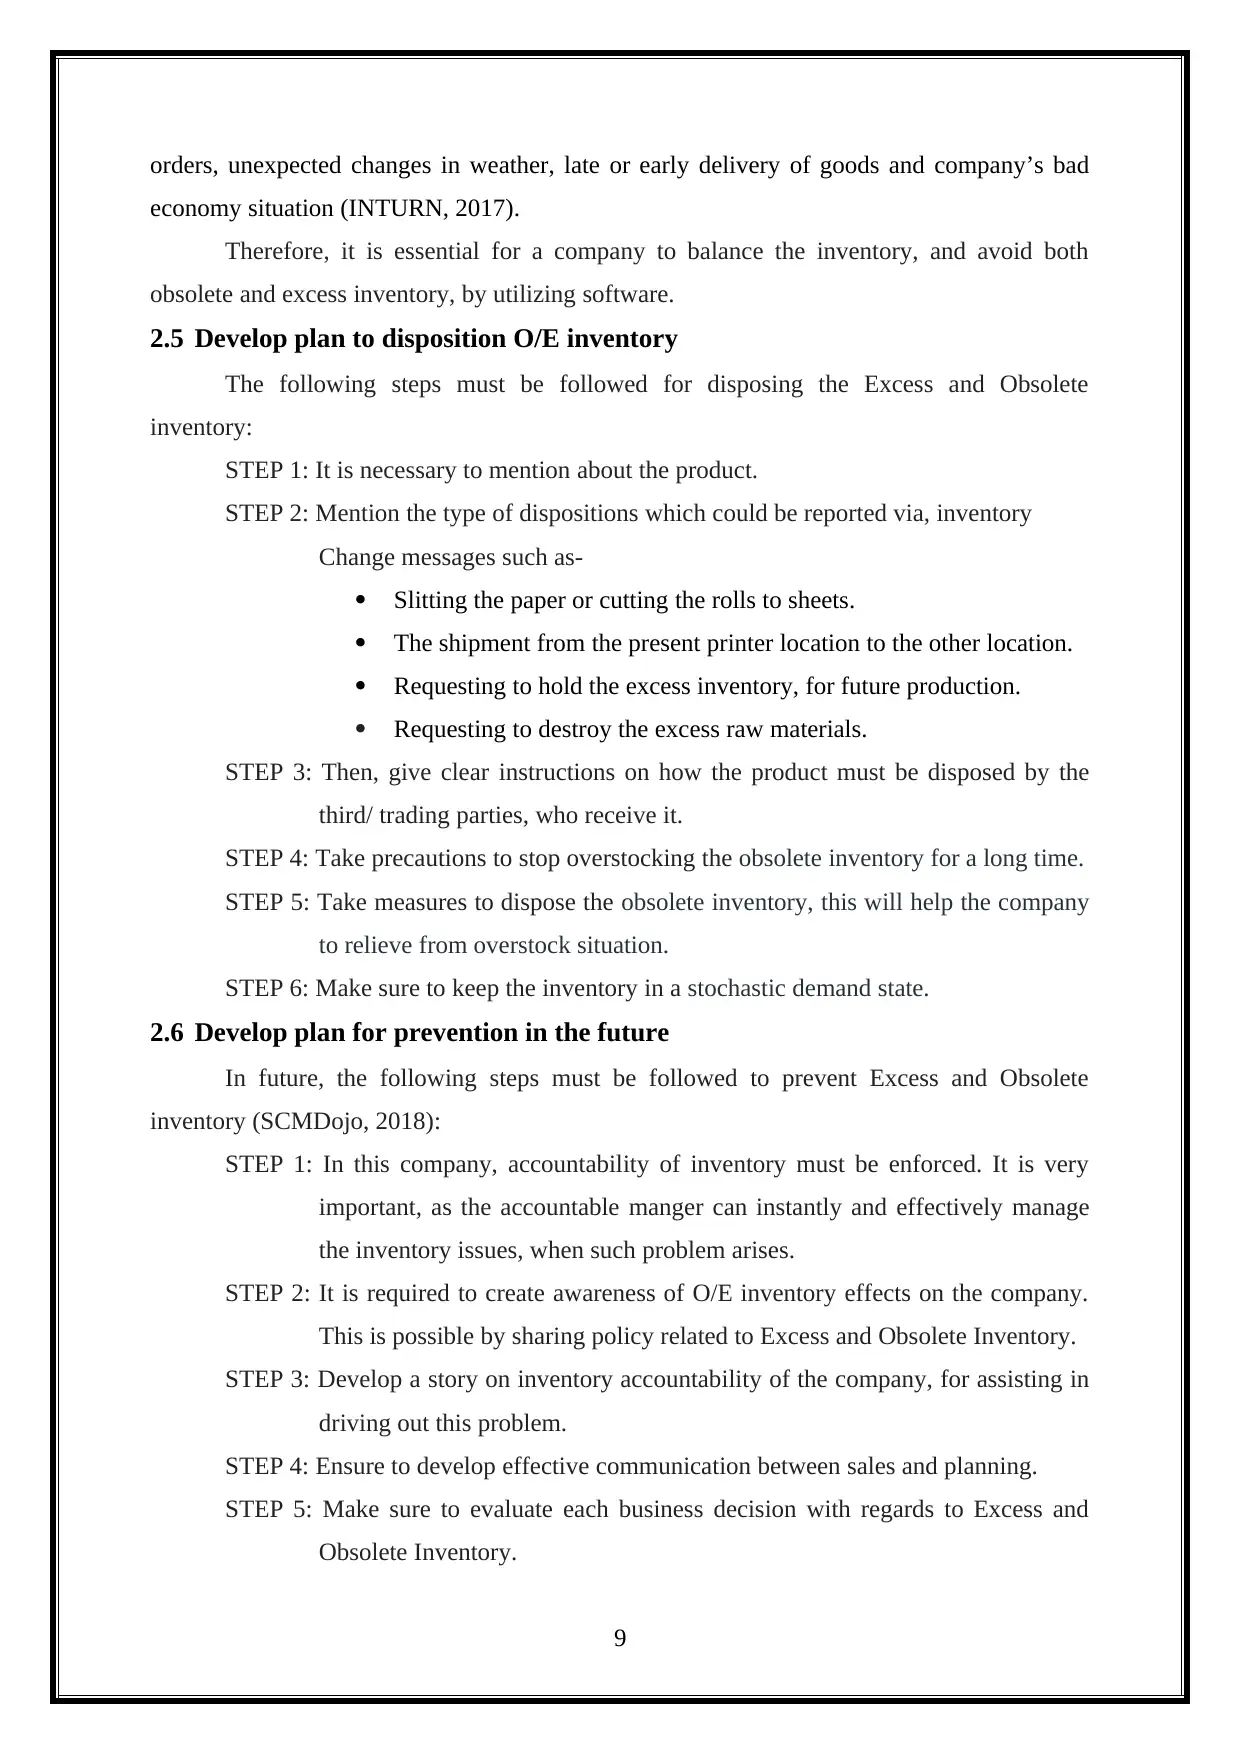
2.5 Develop plan to disposition O/E inventory
The following steps must be followed for disposing the Excess and Obsolete
inventory:
STEP 1: It is necessary to mention about the product.
STEP 2: Mention the type of dispositions which could be reported via, inventory
Change messages such as-
Slitting the paper or cutting the rolls to sheets.
The shipment from the present printer location to the other location.
Requesting to hold the excess inventory, for future production.
Requesting to destroy the excess raw materials.
STEP 3: Then, give clear instructions on how the product must be disposed by the
third/ trading parties, who receive it.
STEP 4: Take precautions to stop overstocking the obsolete inventory for a long time.
STEP 5: Take measures to dispose the obsolete inventory, this will help the company
to relieve from overstock situation.
STEP 6: Make sure to keep the inventory in a stochastic demand state.
2.6 Develop plan for prevention in the future
In future, the following steps must be followed to prevent Excess and Obsolete
inventory (SCMDojo, 2018):
STEP 1: In this company, accountability of inventory must be enforced. It is very
important, as the accountable manger can instantly and effectively manage
the inventory issues, when such problem arises.
STEP 2: It is required to create awareness of O/E inventory effects on the company.
This is possible by sharing policy related to Excess and Obsolete Inventory.
STEP 3: Develop a story on inventory accountability of the company, for assisting in
driving out this problem.
STEP 4: Ensure to develop effective communication between sales and planning.
STEP 5: Make sure to evaluate each business decision with regards to Excess and
Obsolete Inventory.
9
economy situation (INTURN, 2017).
Therefore, it is essential for a company to balance the inventory, and avoid both
obsolete and excess inventory, by utilizing software.
2.5 Develop plan to disposition O/E inventory
The following steps must be followed for disposing the Excess and Obsolete
inventory:
STEP 1: It is necessary to mention about the product.
STEP 2: Mention the type of dispositions which could be reported via, inventory
Change messages such as-
Slitting the paper or cutting the rolls to sheets.
The shipment from the present printer location to the other location.
Requesting to hold the excess inventory, for future production.
Requesting to destroy the excess raw materials.
STEP 3: Then, give clear instructions on how the product must be disposed by the
third/ trading parties, who receive it.
STEP 4: Take precautions to stop overstocking the obsolete inventory for a long time.
STEP 5: Take measures to dispose the obsolete inventory, this will help the company
to relieve from overstock situation.
STEP 6: Make sure to keep the inventory in a stochastic demand state.
2.6 Develop plan for prevention in the future
In future, the following steps must be followed to prevent Excess and Obsolete
inventory (SCMDojo, 2018):
STEP 1: In this company, accountability of inventory must be enforced. It is very
important, as the accountable manger can instantly and effectively manage
the inventory issues, when such problem arises.
STEP 2: It is required to create awareness of O/E inventory effects on the company.
This is possible by sharing policy related to Excess and Obsolete Inventory.
STEP 3: Develop a story on inventory accountability of the company, for assisting in
driving out this problem.
STEP 4: Ensure to develop effective communication between sales and planning.
STEP 5: Make sure to evaluate each business decision with regards to Excess and
Obsolete Inventory.
9
⊘ This is a preview!⊘
Do you want full access?
Subscribe today to unlock all pages.
Trusted by 1+ million students worldwide
STEP 6: Stress more of forecasting the outcomes, instead of the final product.
STEP 7: Plan the life cycle cost of each inventory.
STEP 8: It is required to set effective rules, which must be followed in both the excess
inventory.
STEP 9: Identify the items that are in excess, and take instant actions.
STEP 10: Monitor the company's inventory, as it will help to have clear picture of the
inventory, and can help to take better decisions.
STEP 11: The important step is to analyze the causes for excess and obsolete
inventory.
3. Question 2
In this question, we are using the purchase parts and material for the past 12 months. The
files display the manufacturing location by plant number. This task focuses on the global
purchased parts inventory. So, it is able to look for areas where it can increase the turns and
reduce the cost (Fastening Supply and Inventory Management - Falcon Fastening Solutions,
2019).
3.1 Opportunities for inventory to be “pooled” for all locations
The inventory pooling is used to serving the two or more separate the markets using the
common inventory stocks. The pooled inventory is refers to a organization ability to serve the
multiple markets with their own uncertain demand form a single stock of inventory. The
multiple location pooling inventory is refers to the practice of pooling demands from the
separate geographic markets it has following opportunities such as,
Combining the inventory from stores in the two different physical locations.
It has become the optional norm as large geographic regions are increasingly served
by centralized stocks.
To successfully implement the single stock pool for Komatsu management, it needs real
time visibility of business inventory available in all locations and channels. The solutions of
inventory management that integrate with Enterprise resource planning and point of sale
system can deliver the visibility. The successfully implementation of single stock pool in
multiple location is requires the comprehensive approaches such as (EazyStock, 2019),
Imports management
Warehouse management
Weekly sales and stock intake
10
Paraphrase This Document
Need a fresh take? Get an instant paraphrase of this document with our AI Paraphraser
Distributed order management
Pre and post allocations
Merchandise planning
Reintegrating stock
Returns management
Demand and planning forecasting
Pool inventory strategy is used to provide the following benefits such as.
Manage several channels
Automation
More revenue
Respond to the Market
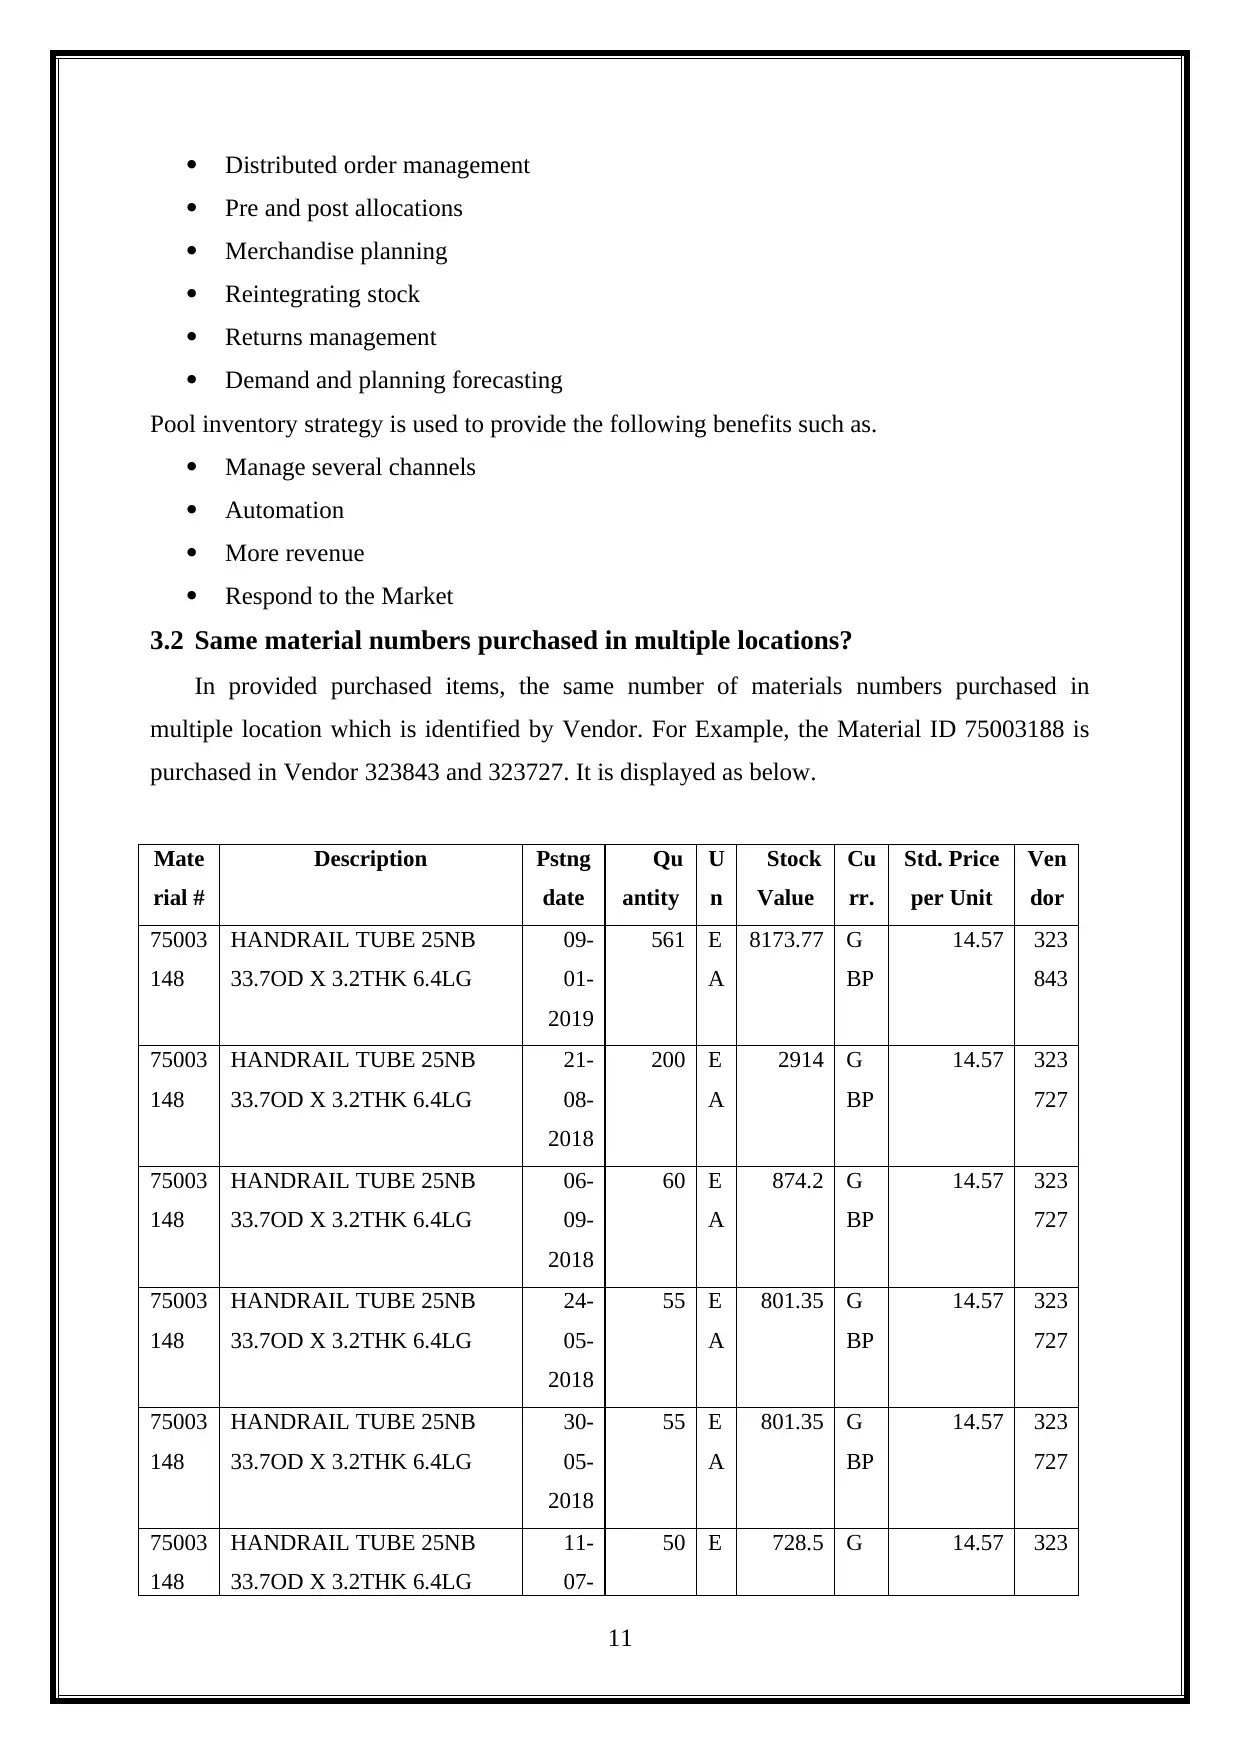
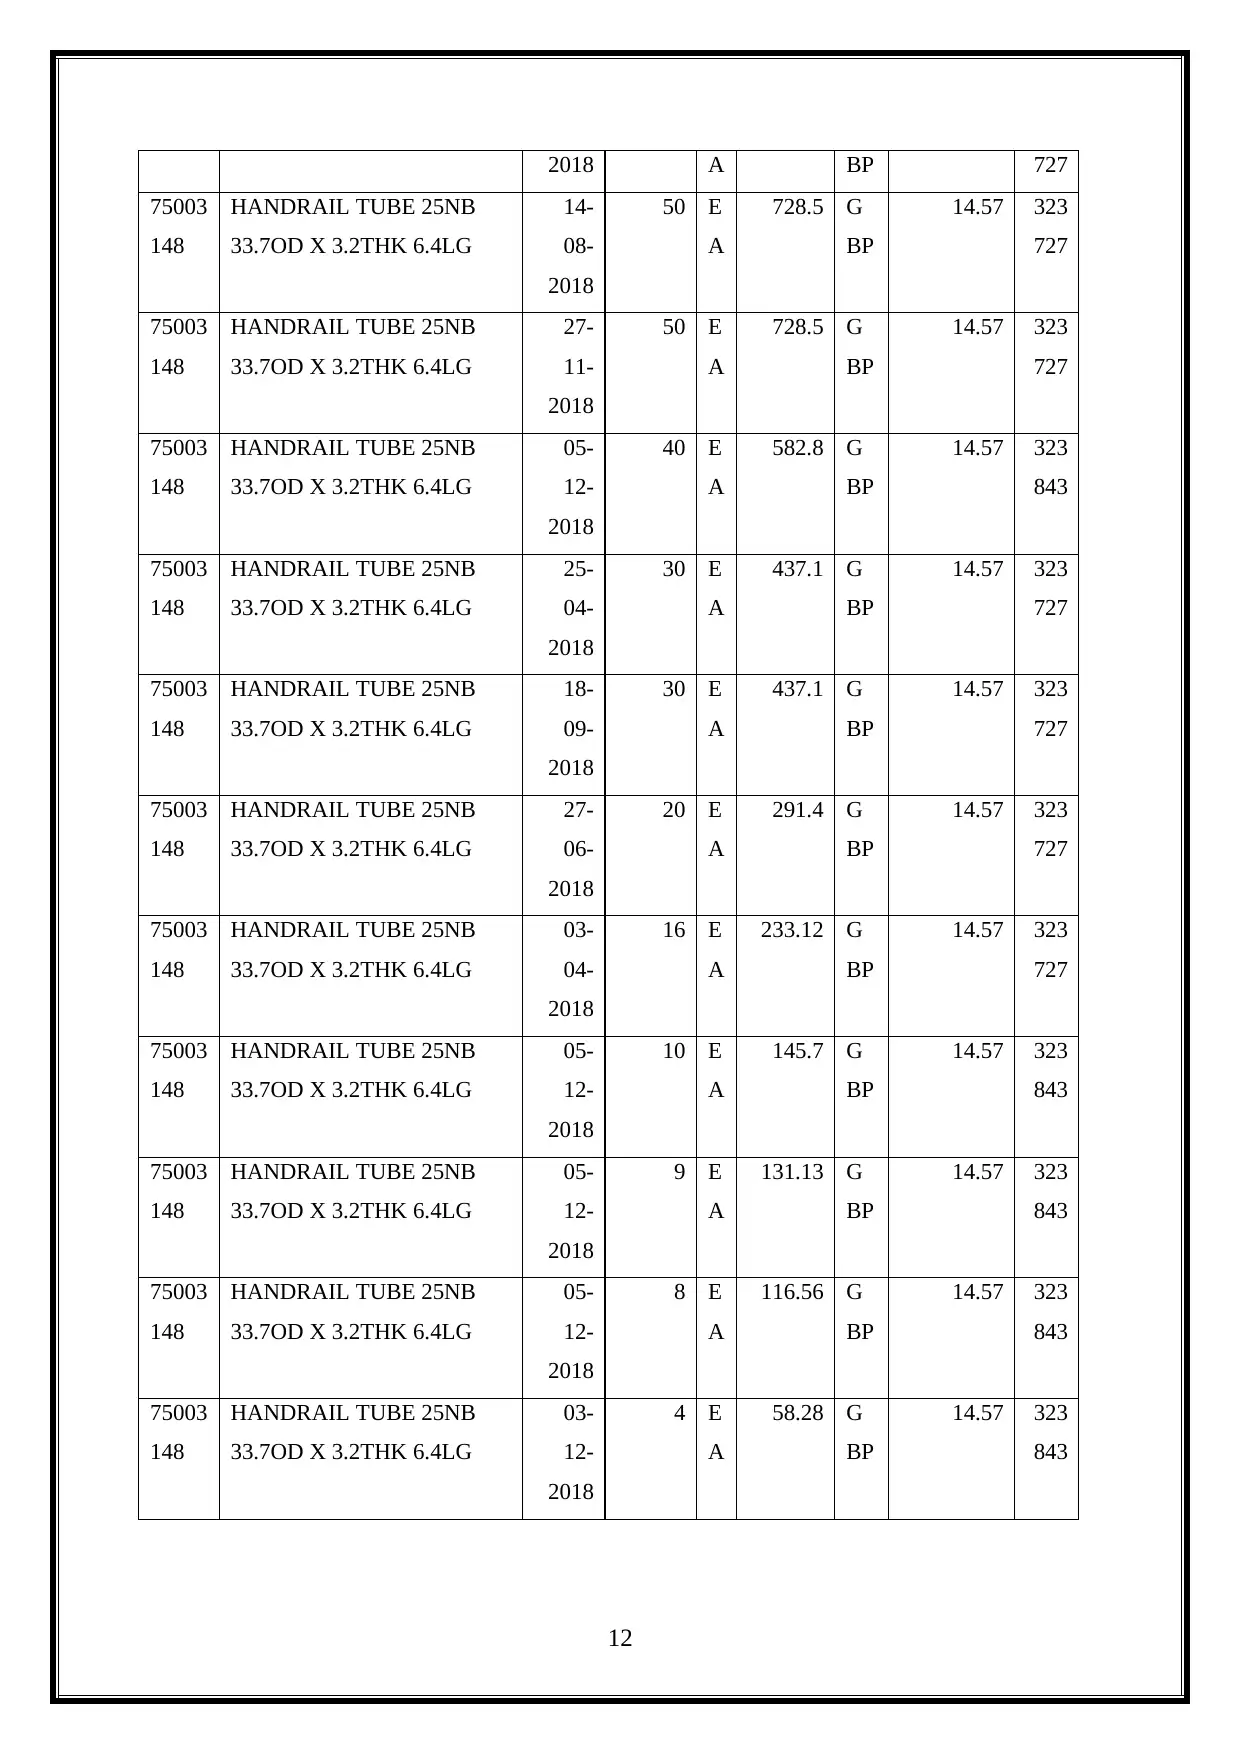
3.2 Same material numbers purchased in multiple locations?
In provided purchased items, the same number of materials numbers purchased in
multiple location which is identified by Vendor. For Example, the Material ID 75003188 is
purchased in Vendor 323843 and 323727. It is displayed as below.
Mate
rial #
Description Pstng
date
Qu
antity
U
n
Stock
Value
Cu
rr.
Std. Price
per Unit
Ven
dor
75003
148
HANDRAIL TUBE 25NB
33.7OD X 3.2THK 6.4LG
09-
01-
2019
561 E
A
8173.77 G
BP
14.57 323
843
75003
148
HANDRAIL TUBE 25NB
33.7OD X 3.2THK 6.4LG
21-
08-
2018
200 E
A
2914 G
BP
14.57 323
727
75003
148
HANDRAIL TUBE 25NB
33.7OD X 3.2THK 6.4LG
06-
09-
2018
60 E
A
874.2 G
BP
14.57 323
727
75003
148
HANDRAIL TUBE 25NB
33.7OD X 3.2THK 6.4LG
24-
05-
2018
55 E
A
801.35 G
BP
14.57 323
727
75003
148
HANDRAIL TUBE 25NB
33.7OD X 3.2THK 6.4LG
30-
05-
2018
55 E
A
801.35 G
BP
14.57 323
727
75003
148
HANDRAIL TUBE 25NB
33.7OD X 3.2THK 6.4LG
11-
07-
50 E 728.5 G 14.57 323
11
Pre and post allocations
Merchandise planning
Reintegrating stock
Returns management
Demand and planning forecasting
Pool inventory strategy is used to provide the following benefits such as.
Manage several channels
Automation
More revenue
Respond to the Market
3.2 Same material numbers purchased in multiple locations?
In provided purchased items, the same number of materials numbers purchased in
multiple location which is identified by Vendor. For Example, the Material ID 75003188 is
purchased in Vendor 323843 and 323727. It is displayed as below.
Mate
rial #
Description Pstng
date
Qu
antity
U
n
Stock
Value
Cu
rr.
Std. Price
per Unit
Ven
dor
75003
148
HANDRAIL TUBE 25NB
33.7OD X 3.2THK 6.4LG
09-
01-
2019
561 E
A
8173.77 G
BP
14.57 323
843
75003
148
HANDRAIL TUBE 25NB
33.7OD X 3.2THK 6.4LG
21-
08-
2018
200 E
A
2914 G
BP
14.57 323
727
75003
148
HANDRAIL TUBE 25NB
33.7OD X 3.2THK 6.4LG
06-
09-
2018
60 E
A
874.2 G
BP
14.57 323
727
75003
148
HANDRAIL TUBE 25NB
33.7OD X 3.2THK 6.4LG
24-
05-
2018
55 E
A
801.35 G
BP
14.57 323
727
75003
148
HANDRAIL TUBE 25NB
33.7OD X 3.2THK 6.4LG
30-
05-
2018
55 E
A
801.35 G
BP
14.57 323
727
75003
148
HANDRAIL TUBE 25NB
33.7OD X 3.2THK 6.4LG
11-
07-
50 E 728.5 G 14.57 323
11
2018 A BP 727
75003
148
HANDRAIL TUBE 25NB
33.7OD X 3.2THK 6.4LG
14-
08-
2018
50 E
A
728.5 G
BP
14.57 323
727
75003
148
HANDRAIL TUBE 25NB
33.7OD X 3.2THK 6.4LG
27-
11-
2018
50 E
A
728.5 G
BP
14.57 323
727
75003
148
HANDRAIL TUBE 25NB
33.7OD X 3.2THK 6.4LG
05-
12-
2018
40 E
A
582.8 G
BP
14.57 323
843
75003
148
HANDRAIL TUBE 25NB
33.7OD X 3.2THK 6.4LG
25-
04-
2018
30 E
A
437.1 G
BP
14.57 323
727
75003
148
HANDRAIL TUBE 25NB
33.7OD X 3.2THK 6.4LG
18-
09-
2018
30 E
A
437.1 G
BP
14.57 323
727
75003
148
HANDRAIL TUBE 25NB
33.7OD X 3.2THK 6.4LG
27-
06-
2018
20 E
A
291.4 G
BP
14.57 323
727
75003
148
HANDRAIL TUBE 25NB
33.7OD X 3.2THK 6.4LG
03-
04-
2018
16 E
A
233.12 G
BP
14.57 323
727
75003
148
HANDRAIL TUBE 25NB
33.7OD X 3.2THK 6.4LG
05-
12-
2018
10 E
A
145.7 G
BP
14.57 323
843
75003
148
HANDRAIL TUBE 25NB
33.7OD X 3.2THK 6.4LG
05-
12-
2018
9 E
A
131.13 G
BP
14.57 323
843
75003
148
HANDRAIL TUBE 25NB
33.7OD X 3.2THK 6.4LG
05-
12-
2018
8 E
A
116.56 G
BP
14.57 323
843
75003
148
HANDRAIL TUBE 25NB
33.7OD X 3.2THK 6.4LG
03-
12-
2018
4 E
A
58.28 G
BP
14.57 323
843
12
75003
148
HANDRAIL TUBE 25NB
33.7OD X 3.2THK 6.4LG
14-
08-
2018
50 E
A
728.5 G
BP
14.57 323
727
75003
148
HANDRAIL TUBE 25NB
33.7OD X 3.2THK 6.4LG
27-
11-
2018
50 E
A
728.5 G
BP
14.57 323
727
75003
148
HANDRAIL TUBE 25NB
33.7OD X 3.2THK 6.4LG
05-
12-
2018
40 E
A
582.8 G
BP
14.57 323
843
75003
148
HANDRAIL TUBE 25NB
33.7OD X 3.2THK 6.4LG
25-
04-
2018
30 E
A
437.1 G
BP
14.57 323
727
75003
148
HANDRAIL TUBE 25NB
33.7OD X 3.2THK 6.4LG
18-
09-
2018
30 E
A
437.1 G
BP
14.57 323
727
75003
148
HANDRAIL TUBE 25NB
33.7OD X 3.2THK 6.4LG
27-
06-
2018
20 E
A
291.4 G
BP
14.57 323
727
75003
148
HANDRAIL TUBE 25NB
33.7OD X 3.2THK 6.4LG
03-
04-
2018
16 E
A
233.12 G
BP
14.57 323
727
75003
148
HANDRAIL TUBE 25NB
33.7OD X 3.2THK 6.4LG
05-
12-
2018
10 E
A
145.7 G
BP
14.57 323
843
75003
148
HANDRAIL TUBE 25NB
33.7OD X 3.2THK 6.4LG
05-
12-
2018
9 E
A
131.13 G
BP
14.57 323
843
75003
148
HANDRAIL TUBE 25NB
33.7OD X 3.2THK 6.4LG
05-
12-
2018
8 E
A
116.56 G
BP
14.57 323
843
75003
148
HANDRAIL TUBE 25NB
33.7OD X 3.2THK 6.4LG
03-
12-
2018
4 E
A
58.28 G
BP
14.57 323
843
12
⊘ This is a preview!⊘
Do you want full access?
Subscribe today to unlock all pages.
Trusted by 1+ million students worldwide
1 out of 48


Your All-in-One AI-Powered Toolkit for Academic Success.
+13062052269
info@desklib.com
Available 24*7 on WhatsApp / Email
![[object Object]](/_next/static/media/star-bottom.7253800d.svg)
Unlock your academic potential
Copyright © 2020–2026 A2Z Services. All Rights Reserved. Developed and managed by ZUCOL.