Spark NZ: Business Processes, IT Infrastructure, Risks and Mitigation
VerifiedAdded on 2023/06/10
|23
|4516
|105
Report
AI Summary
This report provides a comprehensive overview of Spark NZ, a telecommunications company in New Zealand, detailing its commercial activities, business processes, and IT infrastructure. It explores Spark NZ's vision, current IT state, asset register, and application portfolio, along with a gap analysis identifying areas for improvement. The report outlines an operational plan, including schedules, resources, and budget, and assesses potential risks and their mitigation strategies. Furthermore, it examines performance metrics across finance, customer relations, processes, and personnel, highlighting IT management issues and challenges. The report also includes an organizational chart and a staff training plan, concluding with key findings and recommendations for enhancing Spark NZ's operations and strategic goals.

Running head: SPARK NZ
SPARK NZ
Name of Student
Name of University
Author note
SPARK NZ
Name of Student
Name of University
Author note
Paraphrase This Document
Need a fresh take? Get an instant paraphrase of this document with our AI Paraphraser
1SPARK NZ
Executive Summary
The Spark NZ is a company that provides telecommunication services to people in
New Zealand. It also provides data analysis services. These services help the customer in
various ways. It helps the customers to get assistance of experts for decision-making,
planning and many more. This report includes various information regarding the services
provided by the organization, the matrices that it has. It further discuses the risks faced by the
company and their mitigations.
2SPARK NZ
Table of Contents
Introduction................................................................................................................................2
Commercial activities and business processes.......................................................................2
Vision.....................................................................................................................................3
Present state of IT in the organization....................................................................................3
IT asset register and application portfolio..............................................................................3
IT vision.....................................................................................................................................4
Gap analysis and required projects........................................................................................4
Operational plan.....................................................................................................................4
Schedule and resources......................................................................................................4
Budget................................................................................................................................5
Risks...................................................................................................................................6
Performance Metris....................................................................................................................7
Finance Metris........................................................................................................................7
Customer Metris.....................................................................................................................8
Process Metris........................................................................................................................9
People Metris.........................................................................................................................9
IT management.........................................................................................................................10
Present issues and challenges...............................................................................................10
Organization Chart...............................................................................................................11
Staff training Plan................................................................................................................11
Conclusion................................................................................................................................12
⊘ This is a preview!⊘
Do you want full access?
Subscribe today to unlock all pages.
Trusted by 1+ million students worldwide
3SPARK NZ
Introduction
SPARKZ NZ also known as Spark New Zealand is a company that provides
telecommunication services in New Zealand. This company provides telephone services,
mobile network and internet services (Sparknz.co.nz. 2018). This company is also a huge ICT
provider to the businesses dwelling in New Zealand. It has been providing services to the
country since 1987 (Sparknz.co.nz. 2018). This company belongs in the list of the largest
organizations that provide these services.
This report discusses regarding the company SPARK NZ (Sparknz.co.nz. 2018). It
further discusses the some activities that can be implemented by the company in order to
improve their business strategies.
Commercial activities and business processes
Spark helps in unleashing potential in all the New Zealanders. It is the largest supplier
of phone lines that are fixed (Sparknz.co.nz. 2018). It is also one of the biggest providers of
internet (Sparknz.co.nz. 2018). Almost half of the New Zealand uses the telecommunication
services provided by Spark. It has nearly 700000 customers that use its broadband services
(Sparknz.co.nz. 2018). This company is also the biggest provider of mobile.
The business processes used by the company in order to enhance its growth and
productivity are as follows
Enhance the program model. The company designs a good program model in order to
function efficiently.
The company takes initiative to improve the quality of partnerships with its
stakeholders as well as customers.
Spark NZ takes initiative to empower as well as align the organization.
The company drives depth into markets and adds new markets as well.
Paraphrase This Document
Need a fresh take? Get an instant paraphrase of this document with our AI Paraphraser
4SPARK NZ
The company ensures that desired steps are taken for improving its performance and
increase the amount of customers using their services.
Vision
Spark NZ aims in serving its customers and earn revenues. They serve their customers
with their best online as well as offline services and experiences. Spark NZ also targets in
capturing global markets.
Present state of IT in the organization
Mobile as well as broadband data has been in demand since some decades. The power
of Information Technology inspires the company to innovate new technologies in order to
meet the needs of customers. This is because the company believes that their success depends
on the demand of their services. Presently Spark NZ has been investing in the best network
providers in data (Rappaport, Sun & Shafi, 2017). They also work for bringing innovation
with the help of recent digital solutions. The company also ensures they are updated with the
needs and wants of customers. They maintain a continuous touch with their customers. They
are currently investing in the growth areas like Light box and Cloud Services.
IT asset register and application portfolio
The asset register and application portfolio consists of complex networks, mobile
phones, telephones along with PCs having access to internet. These assembled in a system
allows people to share thoughts, speak as well as it helps in business (Strategy, 2015). The
business can be done with anyone irrespective of his geographical location. The company
also comprises of a group of national and regional operators. The offices where the functions
under this company are carried out are equipped with IT hardware as well as software. The
software is updated very often. The equipped hardware and software are of the categories
sales analysis tools, tools of data management, systems designed for processing the orders,

5SPARK NZ
protocols of information security, web services, system that manages customer relationship
and many more.
Some software applications used by Spark NZ include Microsoft Office. Excel is used
mostly for reporting. Microsoft Project, Microsoft Visio and a Terminal Emulation software
is used. These applications are used for various purposes. It also uses a software called
Operations Support Systems in order to manage the functioning of the back-end
telecommunication functions.
IT vision
Spark aims in making daily life of people easy by providing better IT services
(Oldham, 2017). They aim in turning the users’ data in actionable insights. This is done by
the smart use of data (Sparkdigital.co.nz. 2018). They also aim in helping people to find the
most effective solution. This is done with the help of the experts of strategic sourcing.
Gap analysis and required projects
In order to analyze the gaps the IT vision is divided into three major portions. First
being the integration of technology with business, second being familiar with clients and the
last being loved by the staffs.
Integrate the business with technology: the company needs to integrate its
business with technology. The technology needs to be updated. Updated
technology would help the business to grow faster.
Become familiar to clients: nowadays people tend to use net from their
phones. There has been an increment in people using internet. In order to be
familiar to the clients their app should be updated very often and they should
bring innovations in the app.
⊘ This is a preview!⊘
Do you want full access?
Subscribe today to unlock all pages.
Trusted by 1+ million students worldwide
6SPARK NZ
Loved by the staff: an international collaboration should be initiated in order
to keep staffs happy. Latest version of technologies should be used in order to
make the work of the staffs easier.
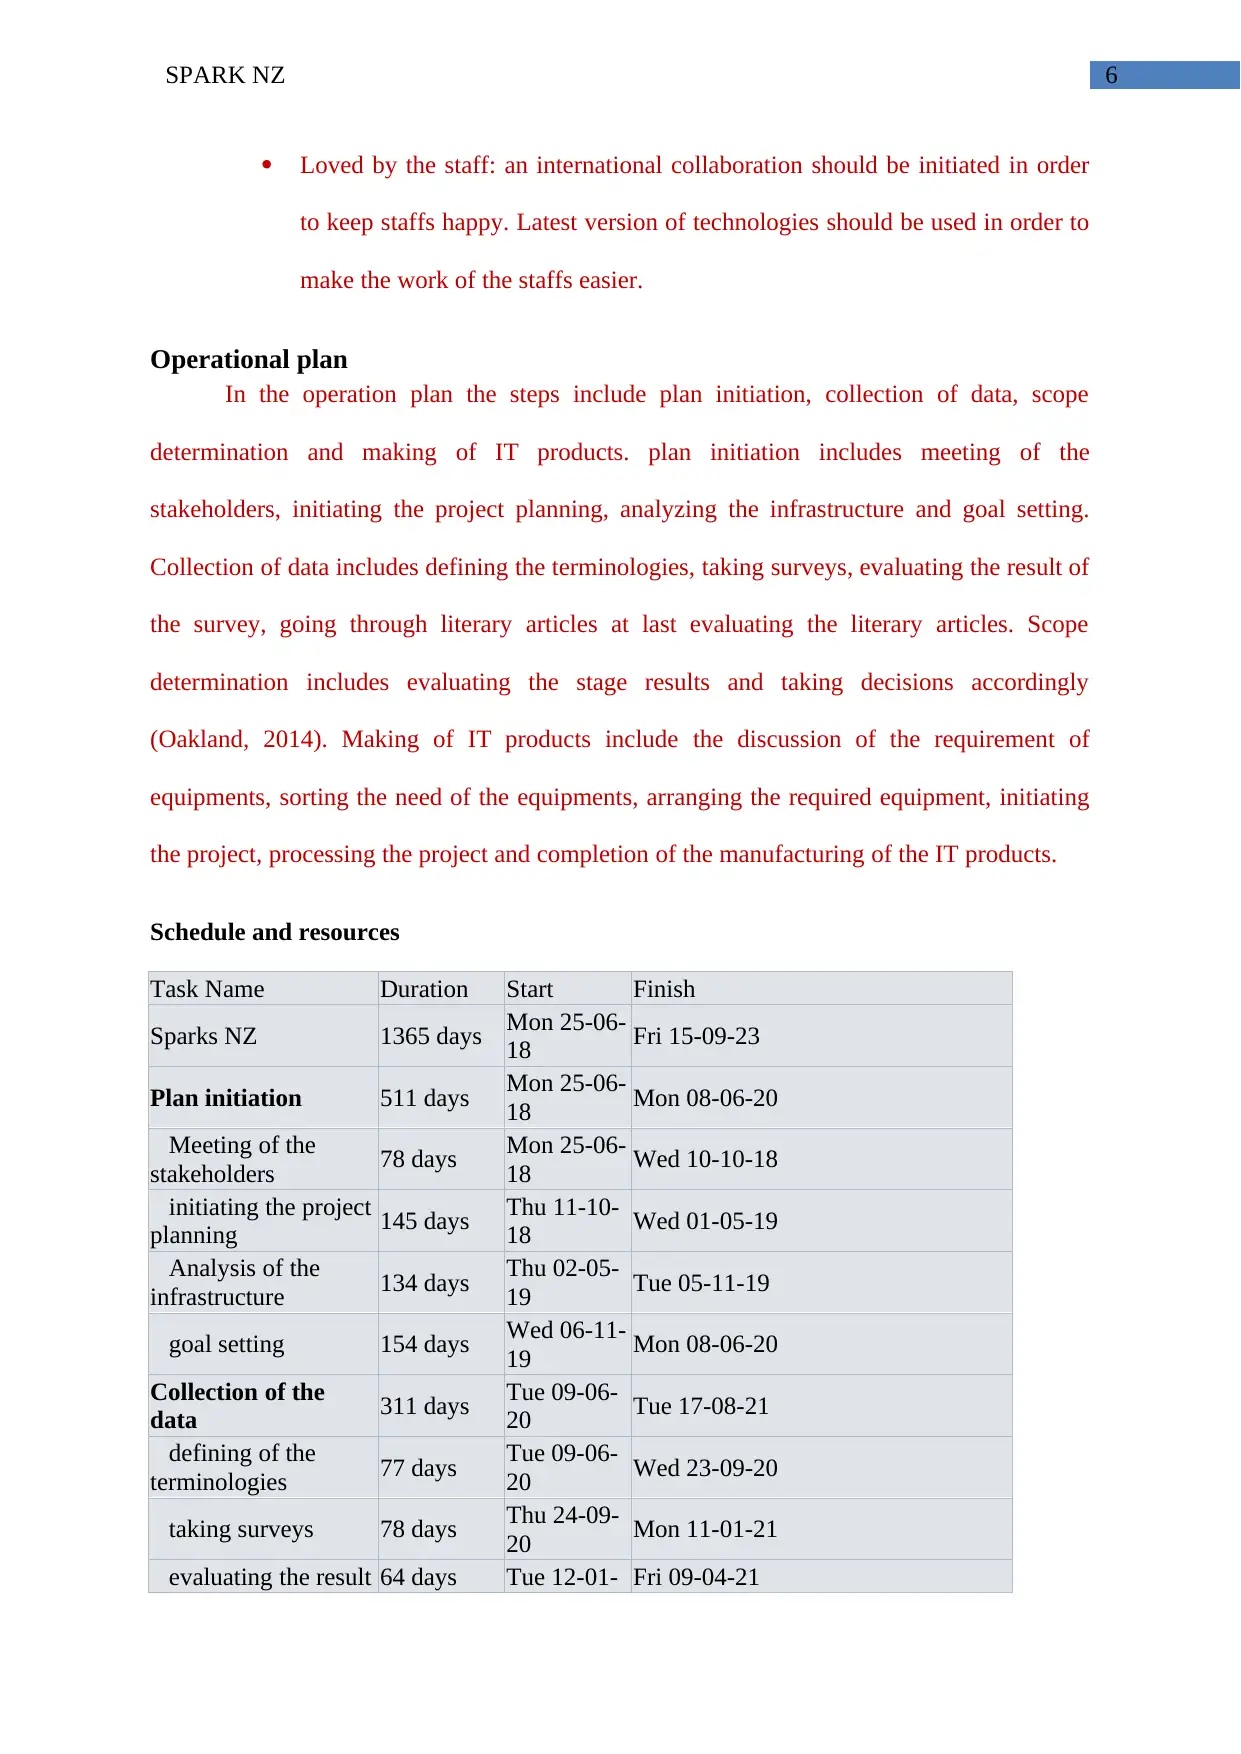
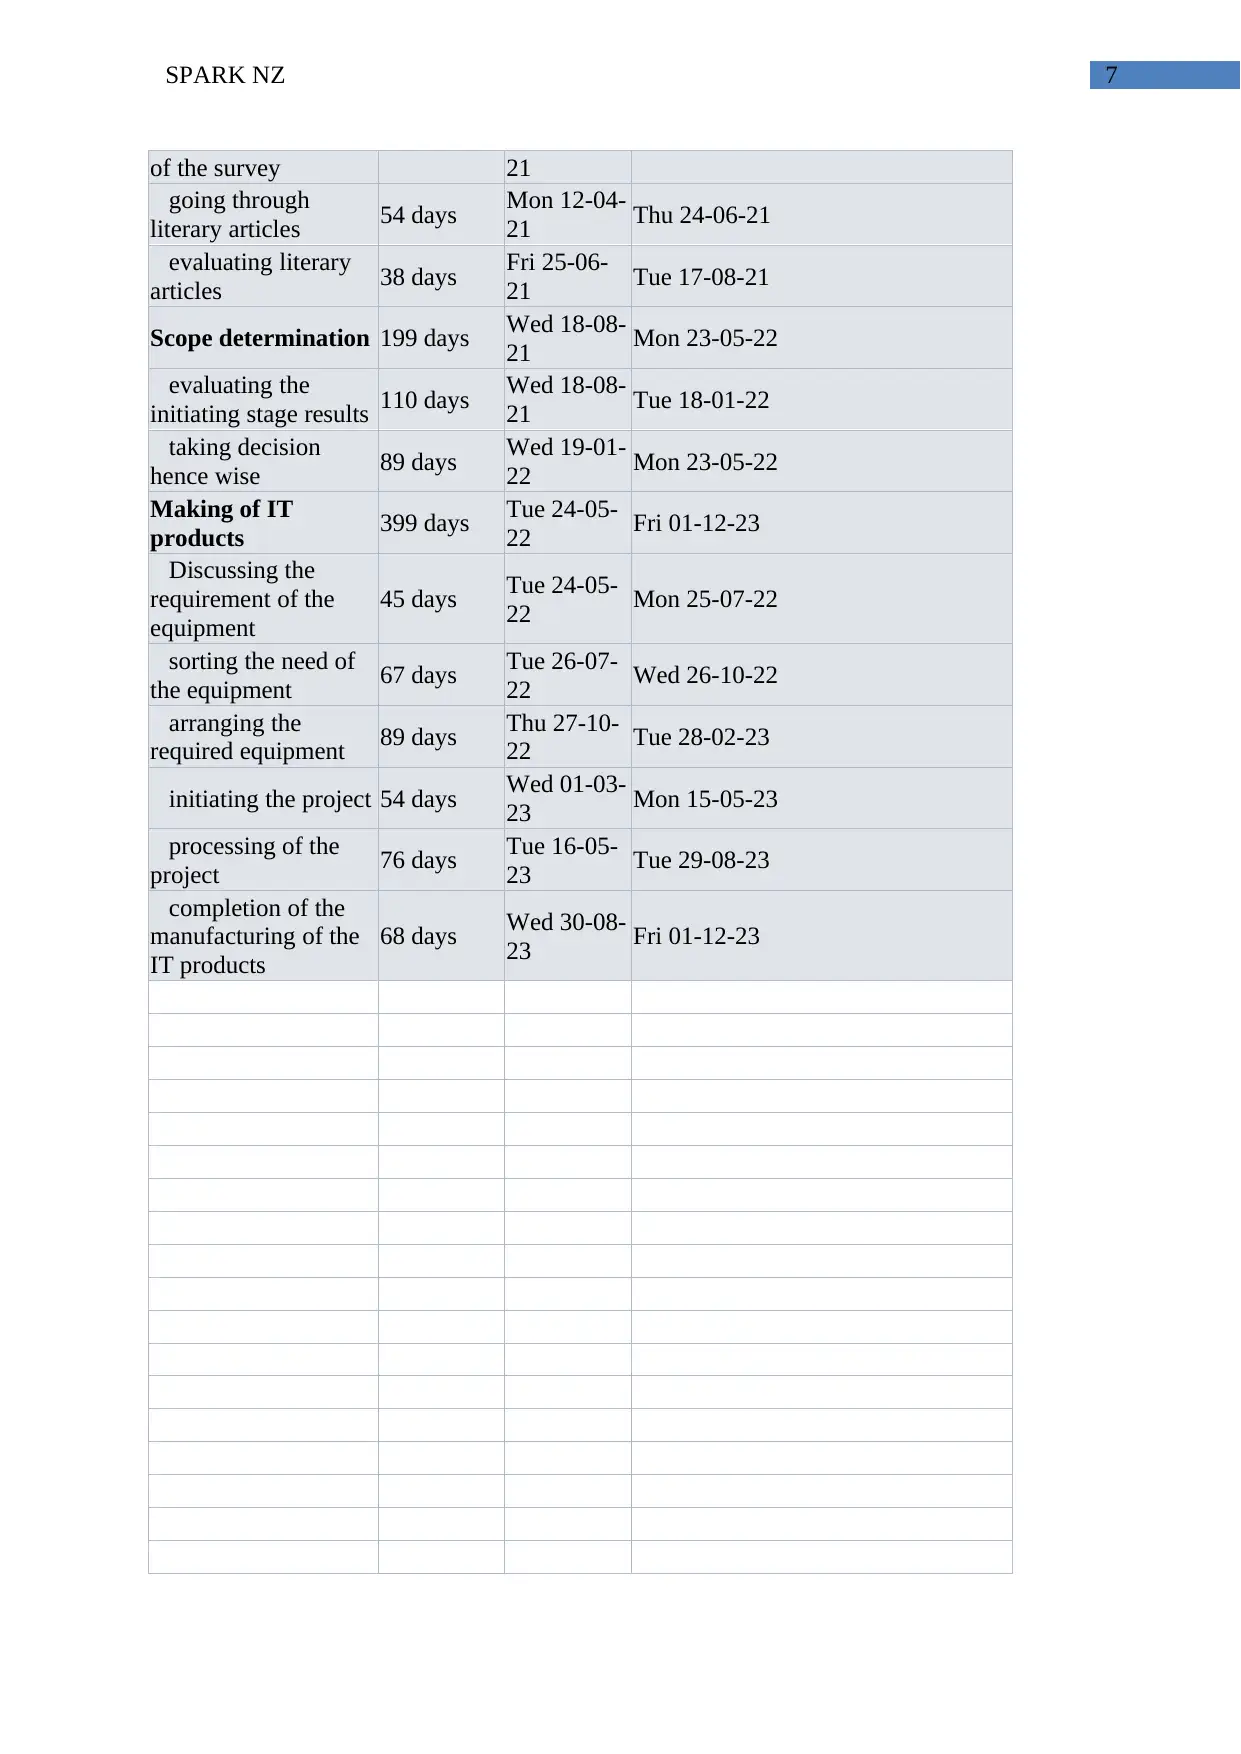
Operational plan
In the operation plan the steps include plan initiation, collection of data, scope
determination and making of IT products. plan initiation includes meeting of the
stakeholders, initiating the project planning, analyzing the infrastructure and goal setting.
Collection of data includes defining the terminologies, taking surveys, evaluating the result of
the survey, going through literary articles at last evaluating the literary articles. Scope
determination includes evaluating the stage results and taking decisions accordingly
(Oakland, 2014). Making of IT products include the discussion of the requirement of
equipments, sorting the need of the equipments, arranging the required equipment, initiating
the project, processing the project and completion of the manufacturing of the IT products.
Schedule and resources
Task Name Duration Start Finish
Sparks NZ 1365 days Mon 25-06-
18 Fri 15-09-23
Plan initiation 511 days Mon 25-06-
18 Mon 08-06-20
Meeting of the
stakeholders 78 days Mon 25-06-
18 Wed 10-10-18
initiating the project
planning 145 days Thu 11-10-
18 Wed 01-05-19
Analysis of the
infrastructure 134 days Thu 02-05-
19 Tue 05-11-19
goal setting 154 days Wed 06-11-
19 Mon 08-06-20
Collection of the
data 311 days Tue 09-06-
20 Tue 17-08-21
defining of the
terminologies 77 days Tue 09-06-
20 Wed 23-09-20
taking surveys 78 days Thu 24-09-
20 Mon 11-01-21
evaluating the result 64 days Tue 12-01- Fri 09-04-21
Loved by the staff: an international collaboration should be initiated in order
to keep staffs happy. Latest version of technologies should be used in order to
make the work of the staffs easier.
Operational plan
In the operation plan the steps include plan initiation, collection of data, scope
determination and making of IT products. plan initiation includes meeting of the
stakeholders, initiating the project planning, analyzing the infrastructure and goal setting.
Collection of data includes defining the terminologies, taking surveys, evaluating the result of
the survey, going through literary articles at last evaluating the literary articles. Scope
determination includes evaluating the stage results and taking decisions accordingly
(Oakland, 2014). Making of IT products include the discussion of the requirement of
equipments, sorting the need of the equipments, arranging the required equipment, initiating
the project, processing the project and completion of the manufacturing of the IT products.
Schedule and resources
Task Name Duration Start Finish
Sparks NZ 1365 days Mon 25-06-
18 Fri 15-09-23
Plan initiation 511 days Mon 25-06-
18 Mon 08-06-20
Meeting of the
stakeholders 78 days Mon 25-06-
18 Wed 10-10-18
initiating the project
planning 145 days Thu 11-10-
18 Wed 01-05-19
Analysis of the
infrastructure 134 days Thu 02-05-
19 Tue 05-11-19
goal setting 154 days Wed 06-11-
19 Mon 08-06-20
Collection of the
data 311 days Tue 09-06-
20 Tue 17-08-21
defining of the
terminologies 77 days Tue 09-06-
20 Wed 23-09-20
taking surveys 78 days Thu 24-09-
20 Mon 11-01-21
evaluating the result 64 days Tue 12-01- Fri 09-04-21
Paraphrase This Document
Need a fresh take? Get an instant paraphrase of this document with our AI Paraphraser
7SPARK NZ
of the survey 21
going through
literary articles 54 days Mon 12-04-
21 Thu 24-06-21
evaluating literary
articles 38 days Fri 25-06-
21 Tue 17-08-21
Scope determination 199 days Wed 18-08-
21 Mon 23-05-22
evaluating the
initiating stage results 110 days Wed 18-08-
21 Tue 18-01-22
taking decision
hence wise 89 days Wed 19-01-
22 Mon 23-05-22
Making of IT
products 399 days Tue 24-05-
22 Fri 01-12-23
Discussing the
requirement of the
equipment
45 days Tue 24-05-
22 Mon 25-07-22
sorting the need of
the equipment 67 days Tue 26-07-
22 Wed 26-10-22
arranging the
required equipment 89 days Thu 27-10-
22 Tue 28-02-23
initiating the project 54 days Wed 01-03-
23 Mon 15-05-23
processing of the
project 76 days Tue 16-05-
23 Tue 29-08-23
completion of the
manufacturing of the
IT products
68 days Wed 30-08-
23 Fri 01-12-23
8SPARK NZ
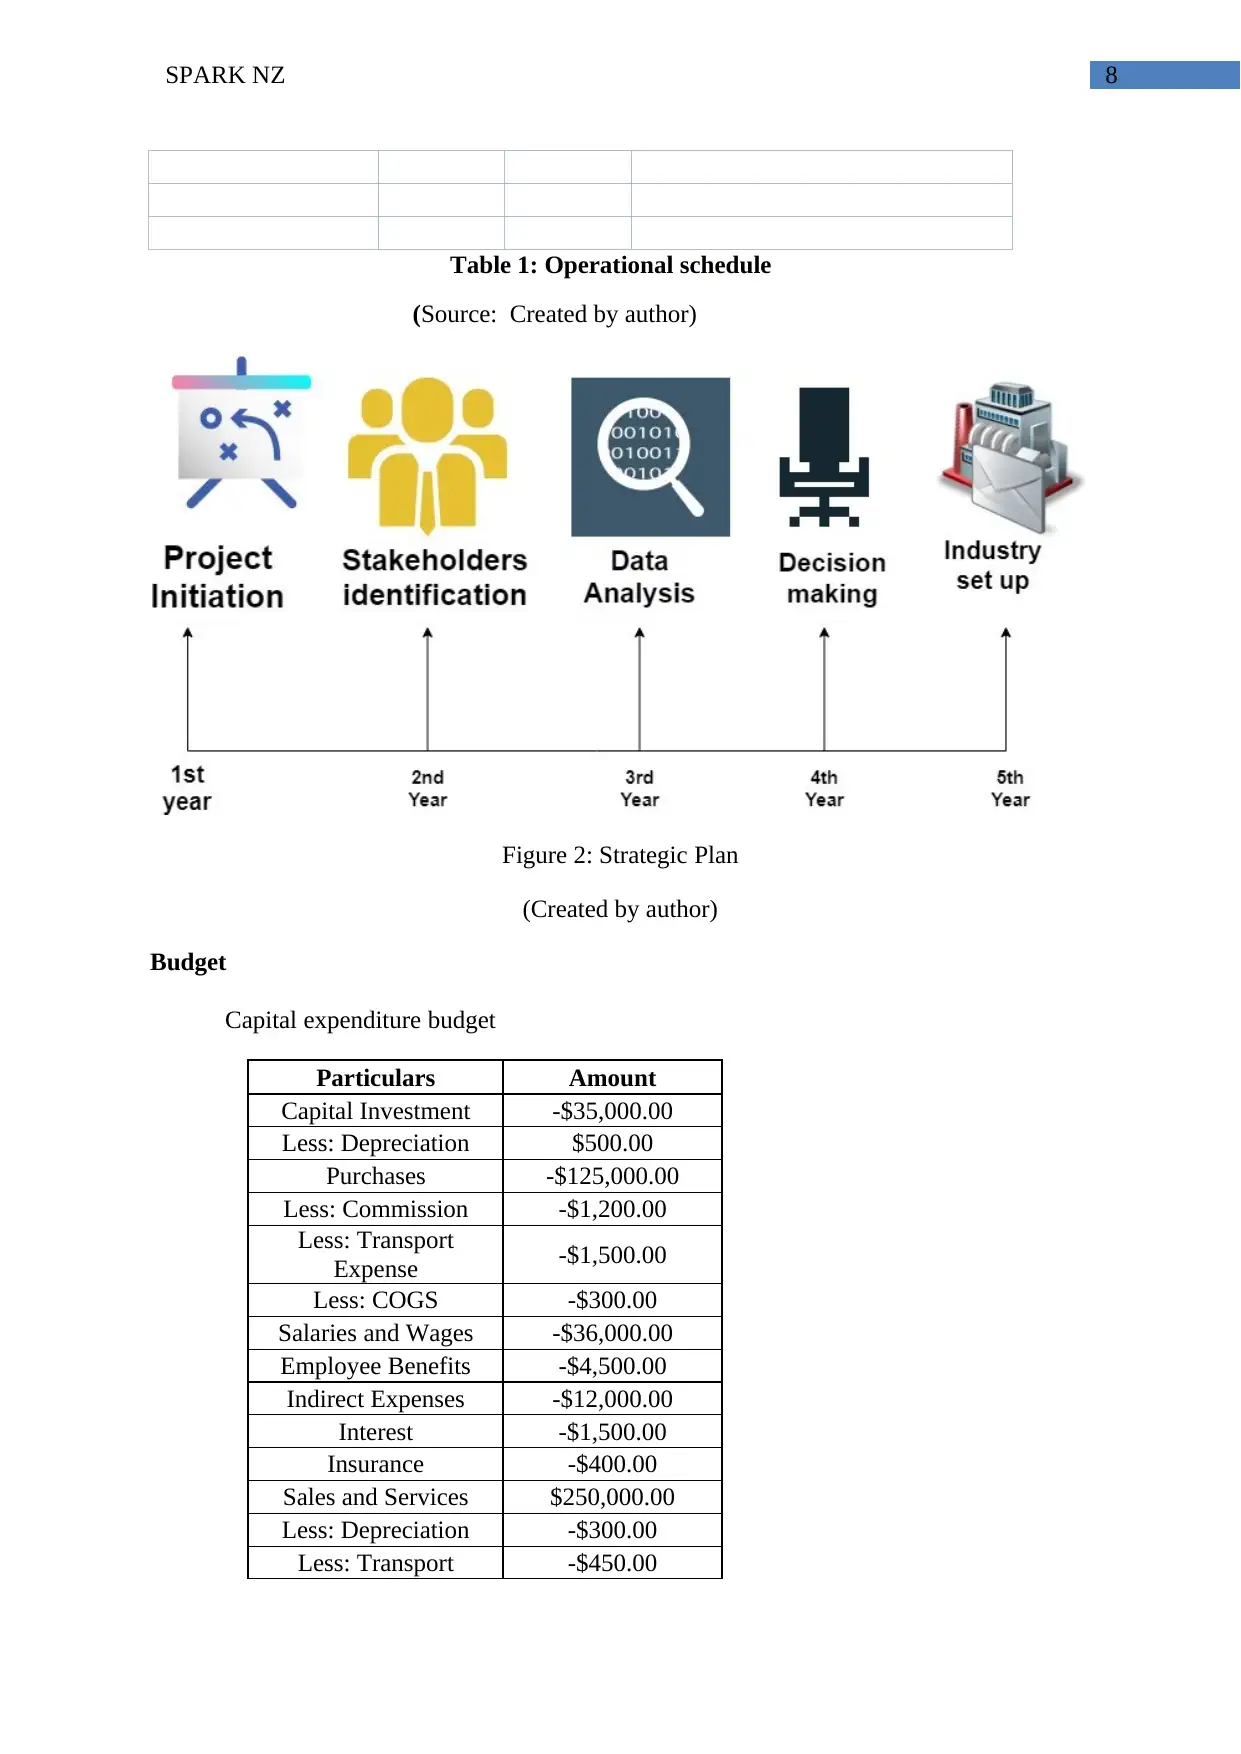
Table 1: Operational schedule
(Source: Created by author)
Figure 2: Strategic Plan
(Created by author)
Budget
Capital expenditure budget
Particulars Amount
Capital Investment -$35,000.00
Less: Depreciation $500.00
Purchases -$125,000.00
Less: Commission -$1,200.00
Less: Transport
Expense -$1,500.00
Less: COGS -$300.00
Salaries and Wages -$36,000.00
Employee Benefits -$4,500.00
Indirect Expenses -$12,000.00
Interest -$1,500.00
Insurance -$400.00
Sales and Services $250,000.00
Less: Depreciation -$300.00
Less: Transport -$450.00
⊘ This is a preview!⊘
Do you want full access?
Subscribe today to unlock all pages.
Trusted by 1+ million students worldwide
9SPARK NZ
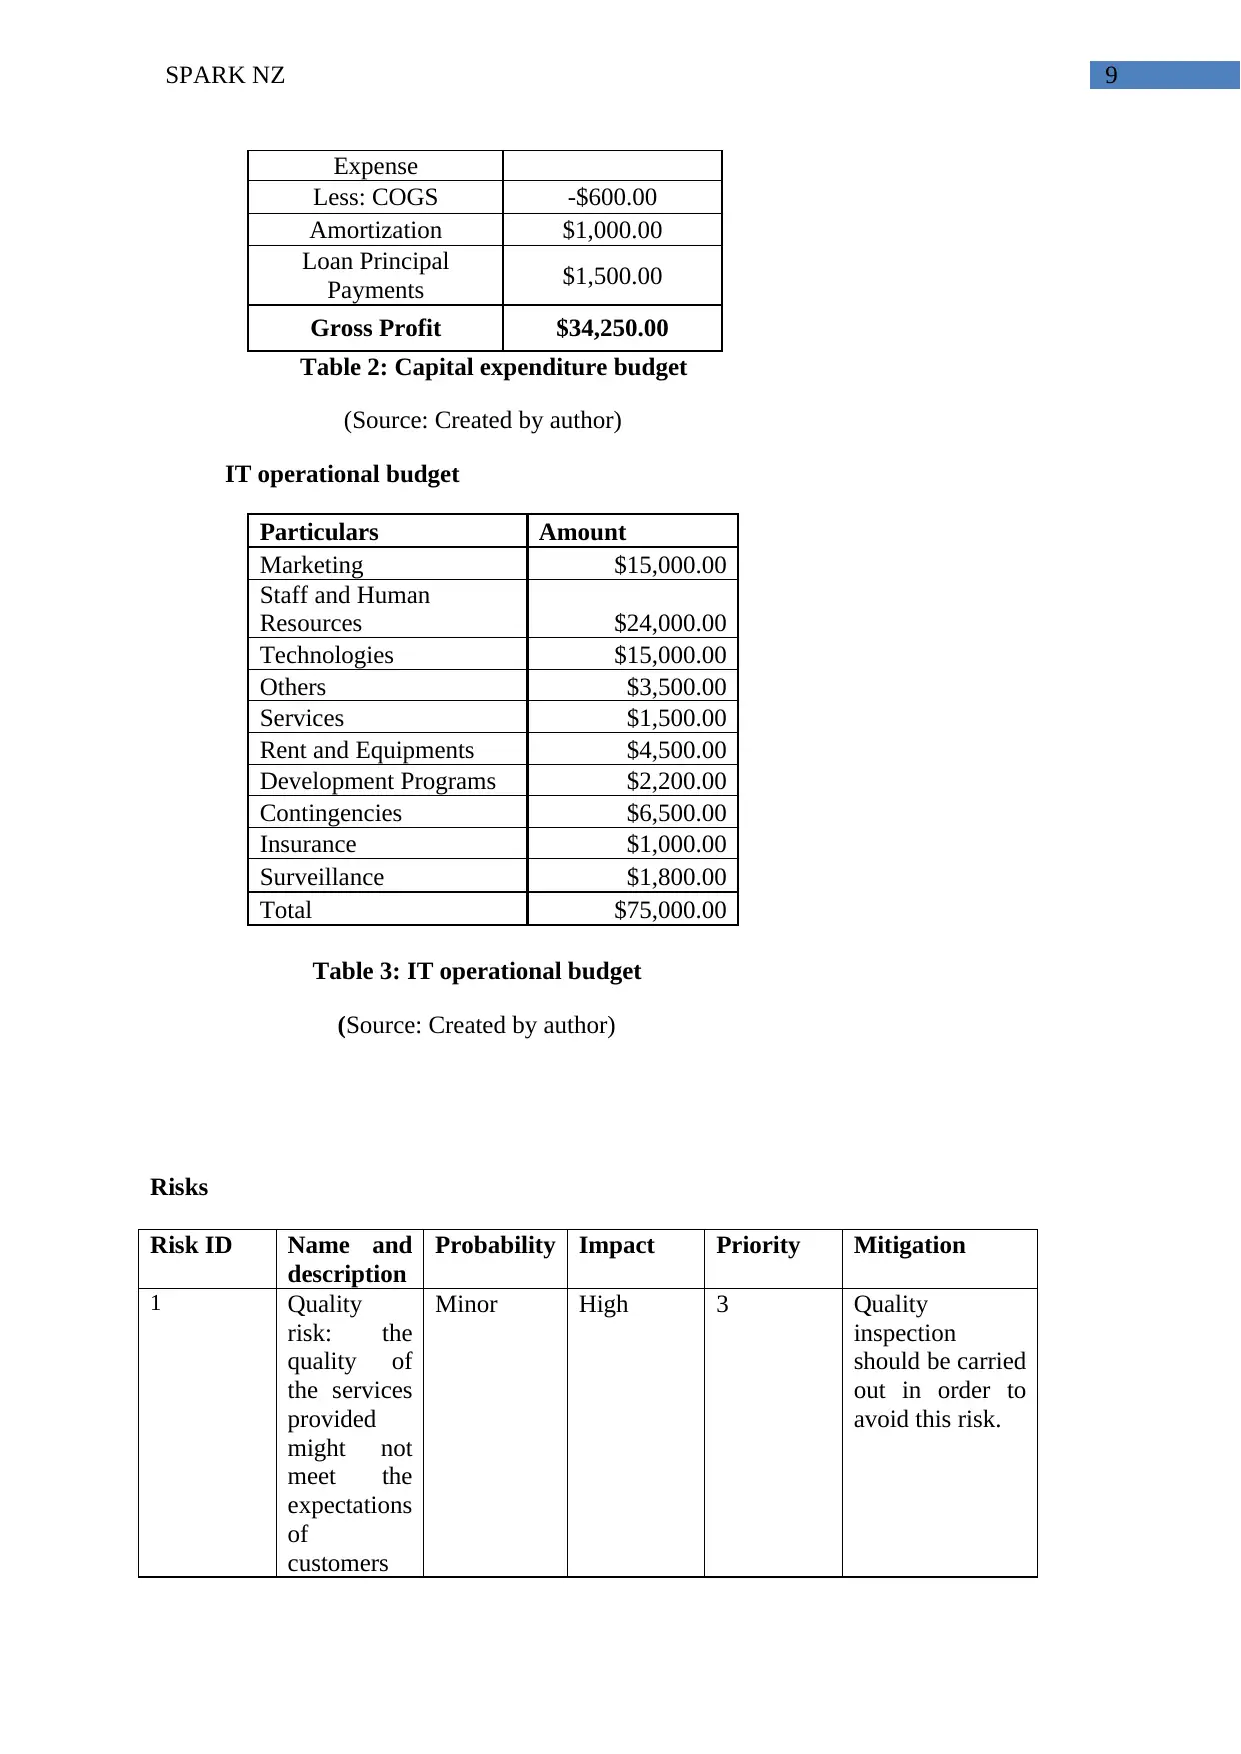
Expense
Less: COGS -$600.00
Amortization $1,000.00
Loan Principal
Payments $1,500.00
Gross Profit $34,250.00
Table 2: Capital expenditure budget
(Source: Created by author)
IT operational budget
Particulars Amount
Marketing $15,000.00
Staff and Human
Resources $24,000.00
Technologies $15,000.00
Others $3,500.00
Services $1,500.00
Rent and Equipments $4,500.00
Development Programs $2,200.00
Contingencies $6,500.00
Insurance $1,000.00
Surveillance $1,800.00
Total $75,000.00
Table 3: IT operational budget
(Source: Created by author)
Risks
Risk ID Name and
description
Probability Impact Priority Mitigation
1 Quality
risk: the
quality of
the services
provided
might not
meet the
expectations
of
customers
Minor High 3 Quality
inspection
should be carried
out in order to
avoid this risk.
Paraphrase This Document
Need a fresh take? Get an instant paraphrase of this document with our AI Paraphraser
10SPARK NZ
(Langer and
McGee,
2017).
2 Security:
the
renovation
must not
reveal
identity of
any
customer
(Viani,
2015)
High High 1 This risk should
be avoided by
installing the
latest and
updated security
control methods.
3 Risk of
exceeding
the Budget:
the
exceeding
of budget
might cause
problem for
the
company.
Low High 5 The budget
should be
decided in such a
way that it does
not affect the
company.
4 Technical:
technical
equipments
might fail to
perform
during the
project
(Kelsey,
2015).
Medium Medium 2 This risk must be
avoided by
looking after the
technical
procedures
carried out by
the company.
5 Operational
risk: the
resources
might not
be efficient
enough
while
performing
(Hughes,
and Smart,
2018).
Medium High 4 This risk should
be avoided by
proper training.
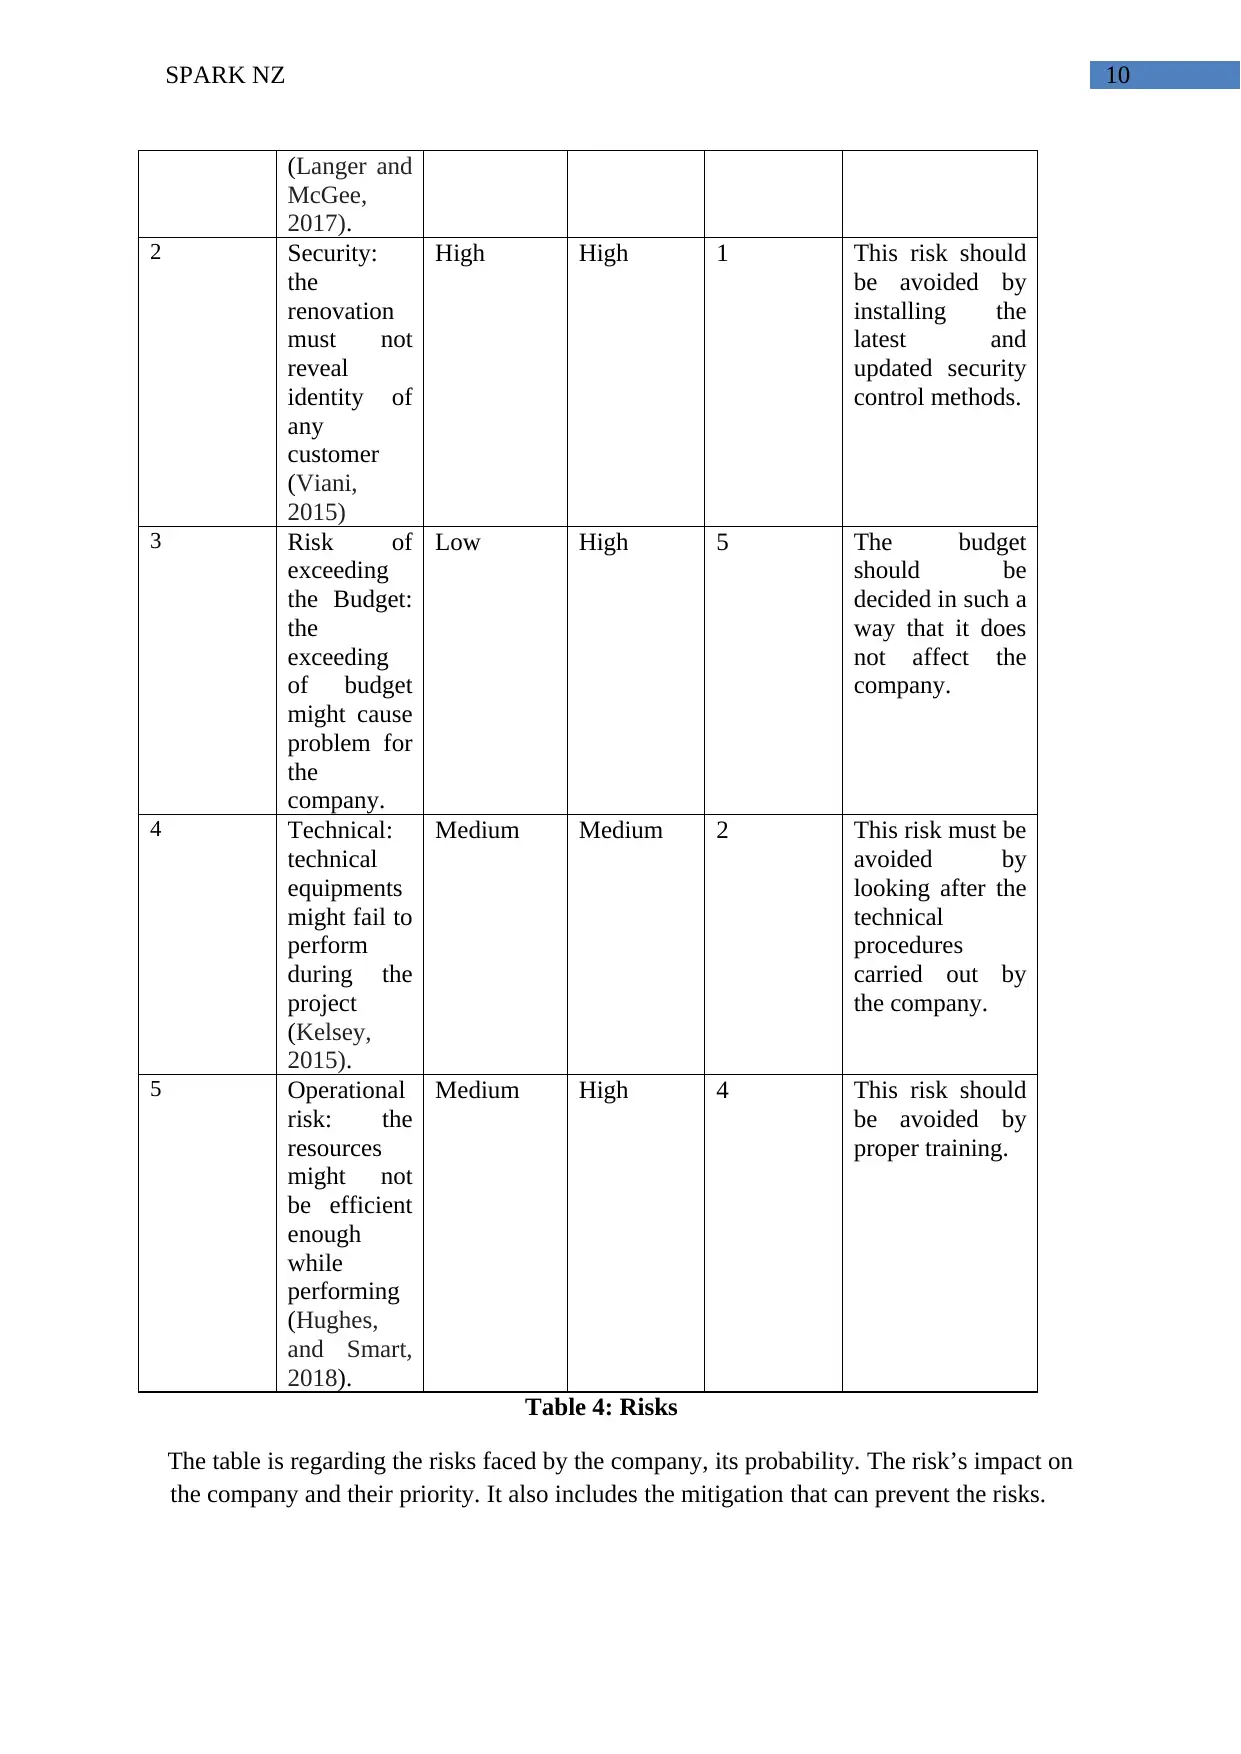
Table 4: Risks
The table is regarding the risks faced by the company, its probability. The risk’s impact on
the company and their priority. It also includes the mitigation that can prevent the risks.
(Langer and
McGee,
2017).
2 Security:
the
renovation
must not
reveal
identity of
any
customer
(Viani,
2015)
High High 1 This risk should
be avoided by
installing the
latest and
updated security
control methods.
3 Risk of
exceeding
the Budget:
the
exceeding
of budget
might cause
problem for
the
company.
Low High 5 The budget
should be
decided in such a
way that it does
not affect the
company.
4 Technical:
technical
equipments
might fail to
perform
during the
project
(Kelsey,
2015).
Medium Medium 2 This risk must be
avoided by
looking after the
technical
procedures
carried out by
the company.
5 Operational
risk: the
resources
might not
be efficient
enough
while
performing
(Hughes,
and Smart,
2018).
Medium High 4 This risk should
be avoided by
proper training.
Table 4: Risks
The table is regarding the risks faced by the company, its probability. The risk’s impact on
the company and their priority. It also includes the mitigation that can prevent the risks.
11SPARK NZ
Performance Metris
Speed vs. Plan
This Metris looks after the fact that weather the organization is spending on whatever
it wanted to spend (Chen, Chen and Jiang, 2017). It also looks after the fields when the
organization would spend are over or under plan (Chen, Chen and Jiang, 2017). It helps in
detecting appropriate anomalies before the organization faces crises. It dives an
accountability culture within the IT organization (Chen, Chen and Jiang, 2017). It is
important for managing the adherence to budget of the organization.
Unit Cost of Infrastructure vs. Target
It measures the efficiency of the organization. It compares the organization with its
opponent organizations (Butcher and Sparks, 2011). It compares the alternatives in order to
decide on outsource or in source or cloud. It also demonstrates the efficiency of defending
budget to its business peers.
Business-Facing Services
It ensures that the company delivers a good quality of performance as well as quality.
It helps meeting the service obligations to its business (James, & Culkin, 2017). It identifies
and corrects the quality slippage (Beltagui, 2018). This has to be done before it is too late and
the project goes out of hand.
Project spent on initiatives of Customer-Facing
This field looks after weather the organization is investing enough on its projects. The
projects on which it has invested should affect the business (Kumar and Reinartz, 2018). It
also looks after that the customer experience is prioritized (Kumar and Reinartz, 2018). It
ensures that the services provided by the organization create an impact on it s external
⊘ This is a preview!⊘
Do you want full access?
Subscribe today to unlock all pages.
Trusted by 1+ million students worldwide
1 out of 23
Related Documents


Your All-in-One AI-Powered Toolkit for Academic Success.
+13062052269
info@desklib.com
Available 24*7 on WhatsApp / Email
![[object Object]](/_next/static/media/star-bottom.7253800d.svg)
Unlock your academic potential
Copyright © 2020–2026 A2Z Services. All Rights Reserved. Developed and managed by ZUCOL.