Analysis of Spatial Technology Inc.'s IPO Strategies and Outcomes
VerifiedAdded on 2020/12/09
|21
|5963
|147
Case Study
AI Summary
This case study examines the financial performance and strategic decisions of Spatial Technology Inc., focusing on its two failed Initial Public Offerings (IPOs). The analysis delves into the company's market penetration strategies, particularly its 3D modeling software, ACIS, and the challenges it faced in attracting investors. The report explores the impact of the management team on the IPO process, including the decision to broaden the team and the subsequent attempts to stabilize ACIS. It also evaluates the reasons behind the withdrawal of the 1992 IPO and the postponement of the 1996 IPO, considering factors such as customer relationships, product stability, and market conditions. The study assesses Spatial's strategy to penetrate the market, highlighting the company's struggles with product instability and customer dissatisfaction. The case study concludes with an evaluation of whether Spatial was a good investment deal, considering the financial challenges the company faced and the impact of its strategic decisions on its IPO outcomes. The case study provides a detailed overview of the content, including the company's financial struggles, strategic decisions, and the impact of its management team on the IPO process.

FINANCE CASE QUESTIONS
Paraphrase This Document
Need a fresh take? Get an instant paraphrase of this document with our AI Paraphraser
Table of Contents
INTRODUCTION...........................................................................................................................3
MAIN BODY...................................................................................................................................3
The success or other wise of Spatial's strategy to penetrate the market......................................5
Impact of Spatial management team on IPO process is enumerated below................................7
At what valuation share price would you recommend to potential investor as a fair price.........8
Is Spatial a good investment deal or not....................................................................................11
Summarizing Impact of Analysis..............................................................................................12
CONCLUSION..............................................................................................................................12
REFERENCE.................................................................................................................................14
APPENDICES...............................................................................................................................16
INTRODUCTION
Financial valuation implies for the process which in turn used for determining the present
value pertaining to expected future cash flow of assets. In this regard, discounted cash flow
(DCF) model is highly significant which assists in estimating investment value referring future
cash flows (Antipin and Khoroshilova, 2016). It emphasizes on assessing expected future cash
flow by taking into account discounting rate. Further, IPO (initial public offering) implies for the
process where shares of the company are sold to institutional investors. Usually, IPO is
underwritten by one or more investment banks for funding purpose. The present report is based
on the case scenario of Spatial technology Inc. which involved in designing and offering
modelling software as well as applications. In this, report will provide deeper insight about the
aspects due to which latest and previous IPO failed to generate interest of investors. Besides this,
report will also shed light on Spatial’s strategy in relation to penetrating the market. Report also
depicts influence of Spatial management team on IPO process.
MAIN BODY
Since Spatial's inception, the main loan provider of the business was Nazem & Company
that used to receive its paybacks from the business in the form of Series B, C or D financing. In
October 1987, machine tool industry declined due to stock market as Venture Capitalists (VCs)
lost faith in investing with new technologies. In 1988, a 3D Modelling Engine was developed
called ACIS. This product was facilitate other CAD/CAM Software developers who would
further integrate this into a end-user applications software.
Spatial Technology Inc. has undergone a lot of changes since its inception including its
core business model. The company aimed to design, develop and market 3D Modelling Software
with targeted Applications. This product was intended to serve the Machine Tool Industry of
1986. In September 1986, with an initial capitalization of $1M, seven talented developers and
two year long development process, the company officially started its operations. The company
also had a strategic development partnership with Three Space Ltd. which was based in England.
Over its initial years, the company carried out two IPOs (Initial Public Offering) which failed to
garner much interest from the investors. Out of the two, the first one was held in 1992 whereas
the latest one was held in 1996 (BĂBUŢ, Moraru and DURA, 2015).
⊘ This is a preview!⊘
Do you want full access?
Subscribe today to unlock all pages.
Trusted by 1+ million students worldwide
IPO 1992:
Based on the success of this product, reluctance of investors to supply additional working
capital, support of customers such as Hewlett Packard (HP) as well as growing industry presence
of Spatial, the company decided to go ahead with the 1992 IPO (Baggen and et.al., 2017). In
addition to this, object-oriented programming also took off in the market with a positive note that
led to ACIS' acceptance in universities and research institutions all around the world. This IPO
aimed to generate revenues in three ways:
Initial License Fees charged to the software companies;
Royalty Fees for those organizations that come under the agreement of end-user software
integrating ACIS; and
Customer Support generated revenue for ACIS Users.
The company had licensees, specifically in terms of technology with a different
perspective capable of remodelling the entire CAD/CAM Market. The company was unable to
go ahead with the plan as:
The investors were of the idea that the company had only used their funds to facilitate
Spatial's interest in Low-end PC Markets (Burhop, Chambers and Cheffins, 2014).
One of the main reason for this failure was that capitalists did not find the management
team of Spatial Technology Inc. broad enough. The aggressive style of CEO was also
criticized heavily that led to disagreement between the company and its customers as well
as investors.
Customer complaints increased in regards to the stability of ACIS as a product that could
enable safe shipment of ACIS-based applications developed by organizations.
After due diligence, the investors concluded that the company was not ready for an IPO
yet, it needed a much more stable product that would be able to fulfil the requirements of Low-
End PC Markets as well as the Customers or Investors of Spatial Technology effectively
(Chemmanur and Fulghieri, 2013). Eventually, the IPO was withdrawn as revenue projections
were not met on time or as expected.
Paraphrase This Document
Need a fresh take? Get an instant paraphrase of this document with our AI Paraphraser
IPO 1996:
The failure of 1992 Initial Public offering had a lot of far-reaching consequences in the
later years of the business. The company was unable to accumulate necessary revenues in the
form of Preferred Stock Series D that was only able to garner $1.2M. Left with due lawyer
payments and other outstanding bills added to the woes of the company. By 1995, the company
had lost $419,000 as a compensation made to the CEO. However, by 1996 the company's
management was able to turnaround much of company's situation from negative to positive
especially from operations point of view. Financially, Spatial was still struggling to keep up with
its competitors. The company wanted to continue investing in the new technologies.
Spatial's ACIS Product garnered a lot of interest after its stabilization. As a result, the
company decided to establish it as an industry standard for 3D Modelling. Pursuant of this
rationale, the company published the ACIS File Format known as SAT in Mid-1996 (Gregory,
Tharyan and Christidis, 2013).
Early 1996 IPO Market exhibited ideal situations for Spatial to consider an Initial Public
Offering as an alternative to solve its financial problems. The main reasons for IPO also
included:
Growing enthusiasm among the banks for company's technology;
Spatial's position in the CAD/CAM Market; and
Expansion of 3D Markets.
The success or other wise of Spatial's strategy to penetrate the market
During IPO of 1992, instability of ACIS as a product itself was one of the reasons that
led to withdrawal of IPO, altogether, from investors side as well as loss of huge customers such
as Autodesk from Spatial's business. Personal ACIS was one of the reasons why the customers
and investors had become reluctant to invest any more in the company as it served as an enabler
for low-end PC Markets rather than the investors itself. This was in violation of the End-User
Software agreement signed by the big investors with Spatial in return for Royalty fees paid to the
organization on their part. Spatial failed miserably at this attempt as all the investors as well as
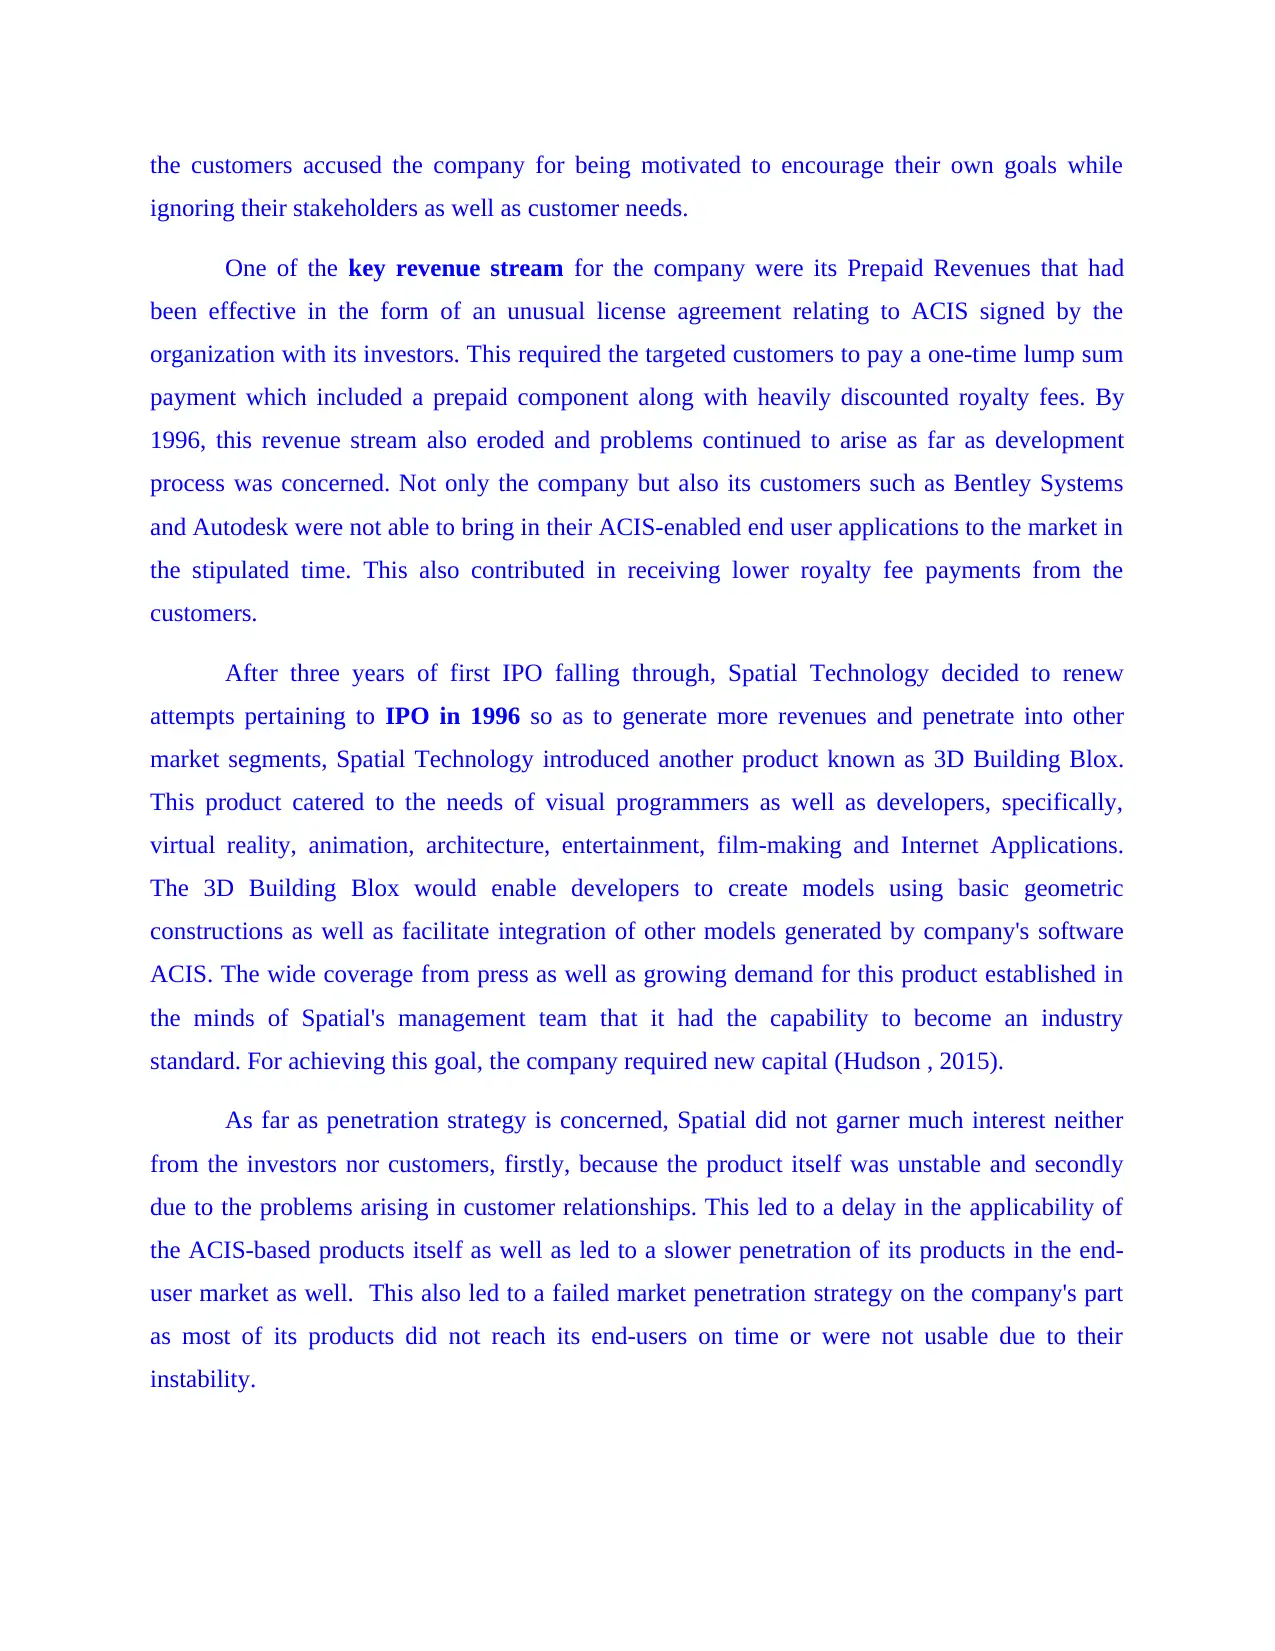
the customers accused the company for being motivated to encourage their own goals while
ignoring their stakeholders as well as customer needs.
One of the key revenue stream for the company were its Prepaid Revenues that had
been effective in the form of an unusual license agreement relating to ACIS signed by the
organization with its investors. This required the targeted customers to pay a one-time lump sum
payment which included a prepaid component along with heavily discounted royalty fees. By
1996, this revenue stream also eroded and problems continued to arise as far as development
process was concerned. Not only the company but also its customers such as Bentley Systems
and Autodesk were not able to bring in their ACIS-enabled end user applications to the market in
the stipulated time. This also contributed in receiving lower royalty fee payments from the
customers.
After three years of first IPO falling through, Spatial Technology decided to renew
attempts pertaining to IPO in 1996 so as to generate more revenues and penetrate into other
market segments, Spatial Technology introduced another product known as 3D Building Blox.
This product catered to the needs of visual programmers as well as developers, specifically,
virtual reality, animation, architecture, entertainment, film-making and Internet Applications.
The 3D Building Blox would enable developers to create models using basic geometric
constructions as well as facilitate integration of other models generated by company's software
ACIS. The wide coverage from press as well as growing demand for this product established in
the minds of Spatial's management team that it had the capability to become an industry
standard. For achieving this goal, the company required new capital (Hudson , 2015).
As far as penetration strategy is concerned, Spatial did not garner much interest neither
from the investors nor customers, firstly, because the product itself was unstable and secondly
due to the problems arising in customer relationships. This led to a delay in the applicability of
the ACIS-based products itself as well as led to a slower penetration of its products in the end-
user market as well. This also led to a failed market penetration strategy on the company's part
as most of its products did not reach its end-users on time or were not usable due to their
instability.
⊘ This is a preview!⊘
Do you want full access?
Subscribe today to unlock all pages.
Trusted by 1+ million students worldwide
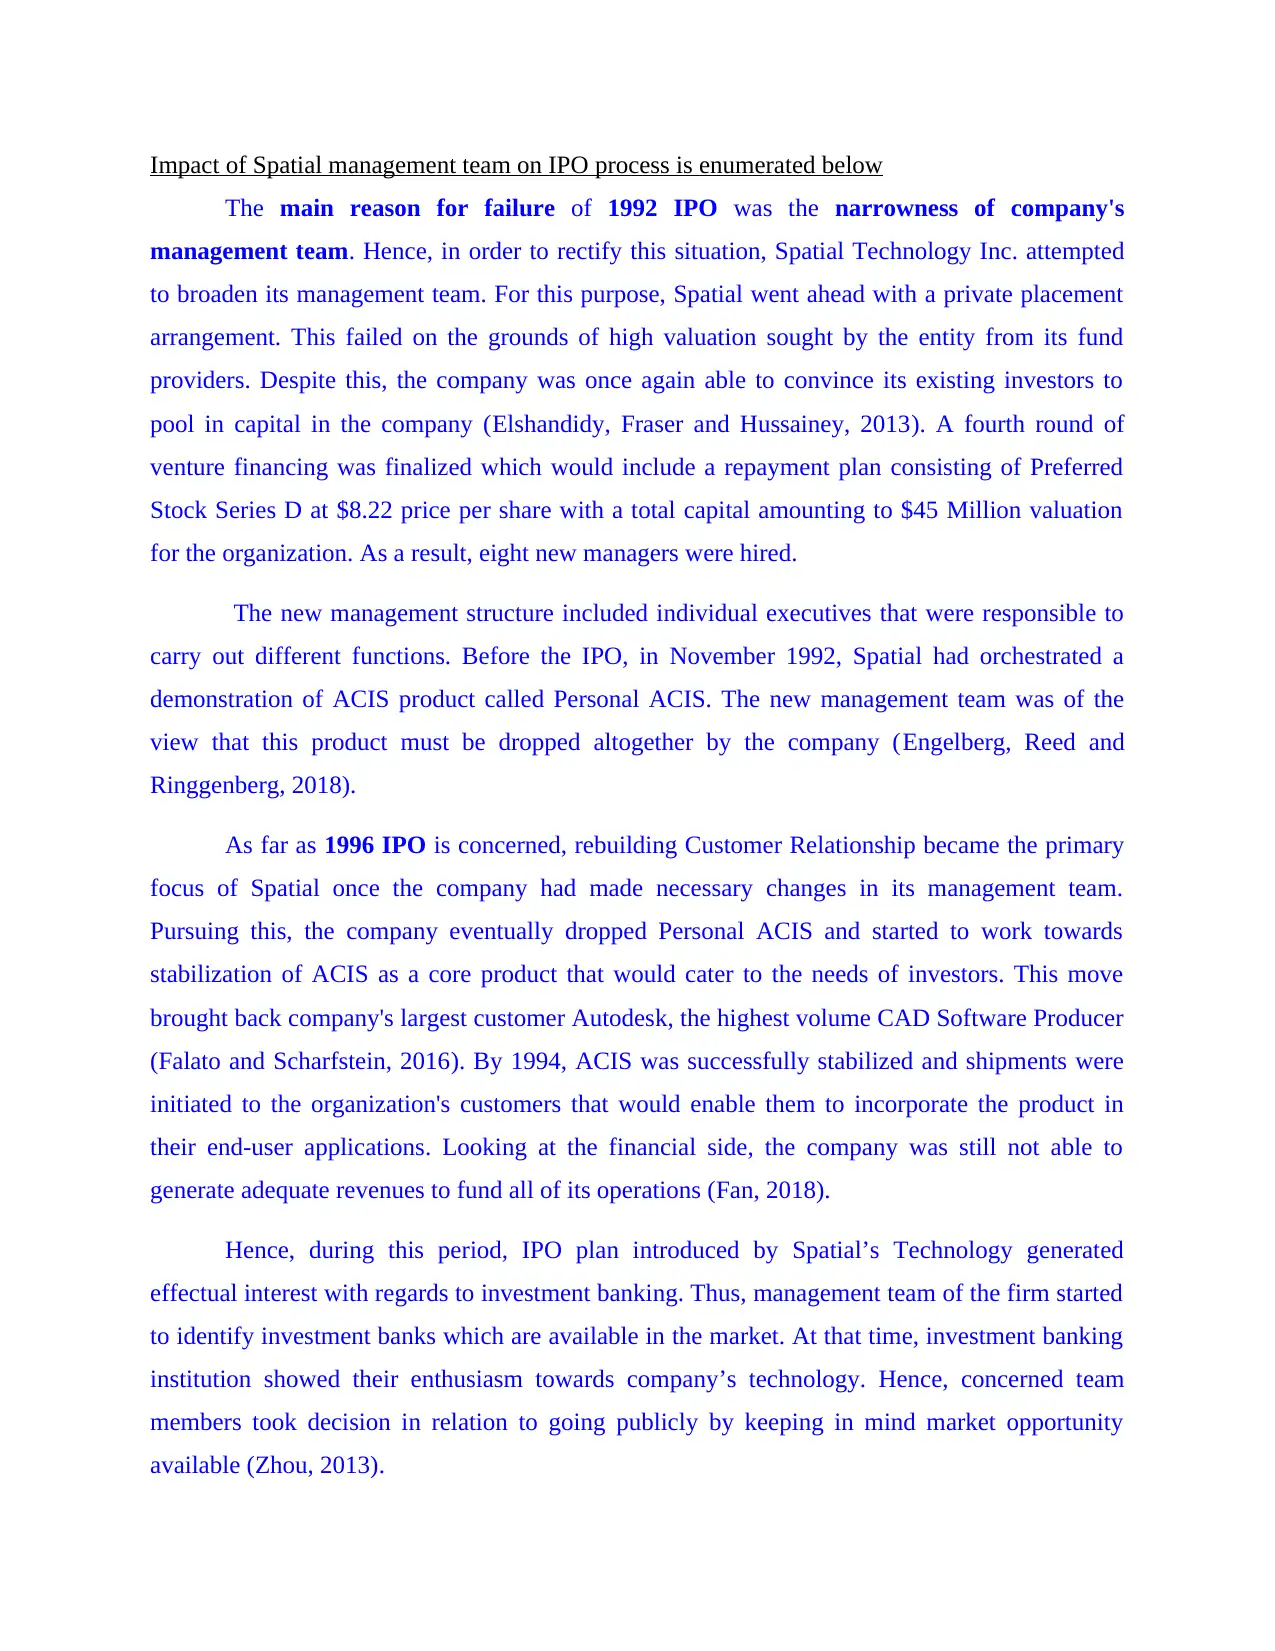
Impact of Spatial management team on IPO process is enumerated below
The main reason for failure of 1992 IPO was the narrowness of company's
management team. Hence, in order to rectify this situation, Spatial Technology Inc. attempted
to broaden its management team. For this purpose, Spatial went ahead with a private placement
arrangement. This failed on the grounds of high valuation sought by the entity from its fund
providers. Despite this, the company was once again able to convince its existing investors to
pool in capital in the company (Elshandidy, Fraser and Hussainey, 2013). A fourth round of
venture financing was finalized which would include a repayment plan consisting of Preferred
Stock Series D at $8.22 price per share with a total capital amounting to $45 Million valuation
for the organization. As a result, eight new managers were hired.
The new management structure included individual executives that were responsible to
carry out different functions. Before the IPO, in November 1992, Spatial had orchestrated a
demonstration of ACIS product called Personal ACIS. The new management team was of the
view that this product must be dropped altogether by the company (Engelberg, Reed and
Ringgenberg, 2018).
As far as 1996 IPO is concerned, rebuilding Customer Relationship became the primary
focus of Spatial once the company had made necessary changes in its management team.
Pursuing this, the company eventually dropped Personal ACIS and started to work towards
stabilization of ACIS as a core product that would cater to the needs of investors. This move
brought back company's largest customer Autodesk, the highest volume CAD Software Producer
(Falato and Scharfstein, 2016). By 1994, ACIS was successfully stabilized and shipments were
initiated to the organization's customers that would enable them to incorporate the product in
their end-user applications. Looking at the financial side, the company was still not able to
generate adequate revenues to fund all of its operations (Fan, 2018).
Hence, during this period, IPO plan introduced by Spatial’s Technology generated
effectual interest with regards to investment banking. Thus, management team of the firm started
to identify investment banks which are available in the market. At that time, investment banking
institution showed their enthusiasm towards company’s technology. Hence, concerned team
members took decision in relation to going publicly by keeping in mind market opportunity
available (Zhou, 2013).
Paraphrase This Document
Need a fresh take? Get an instant paraphrase of this document with our AI Paraphraser
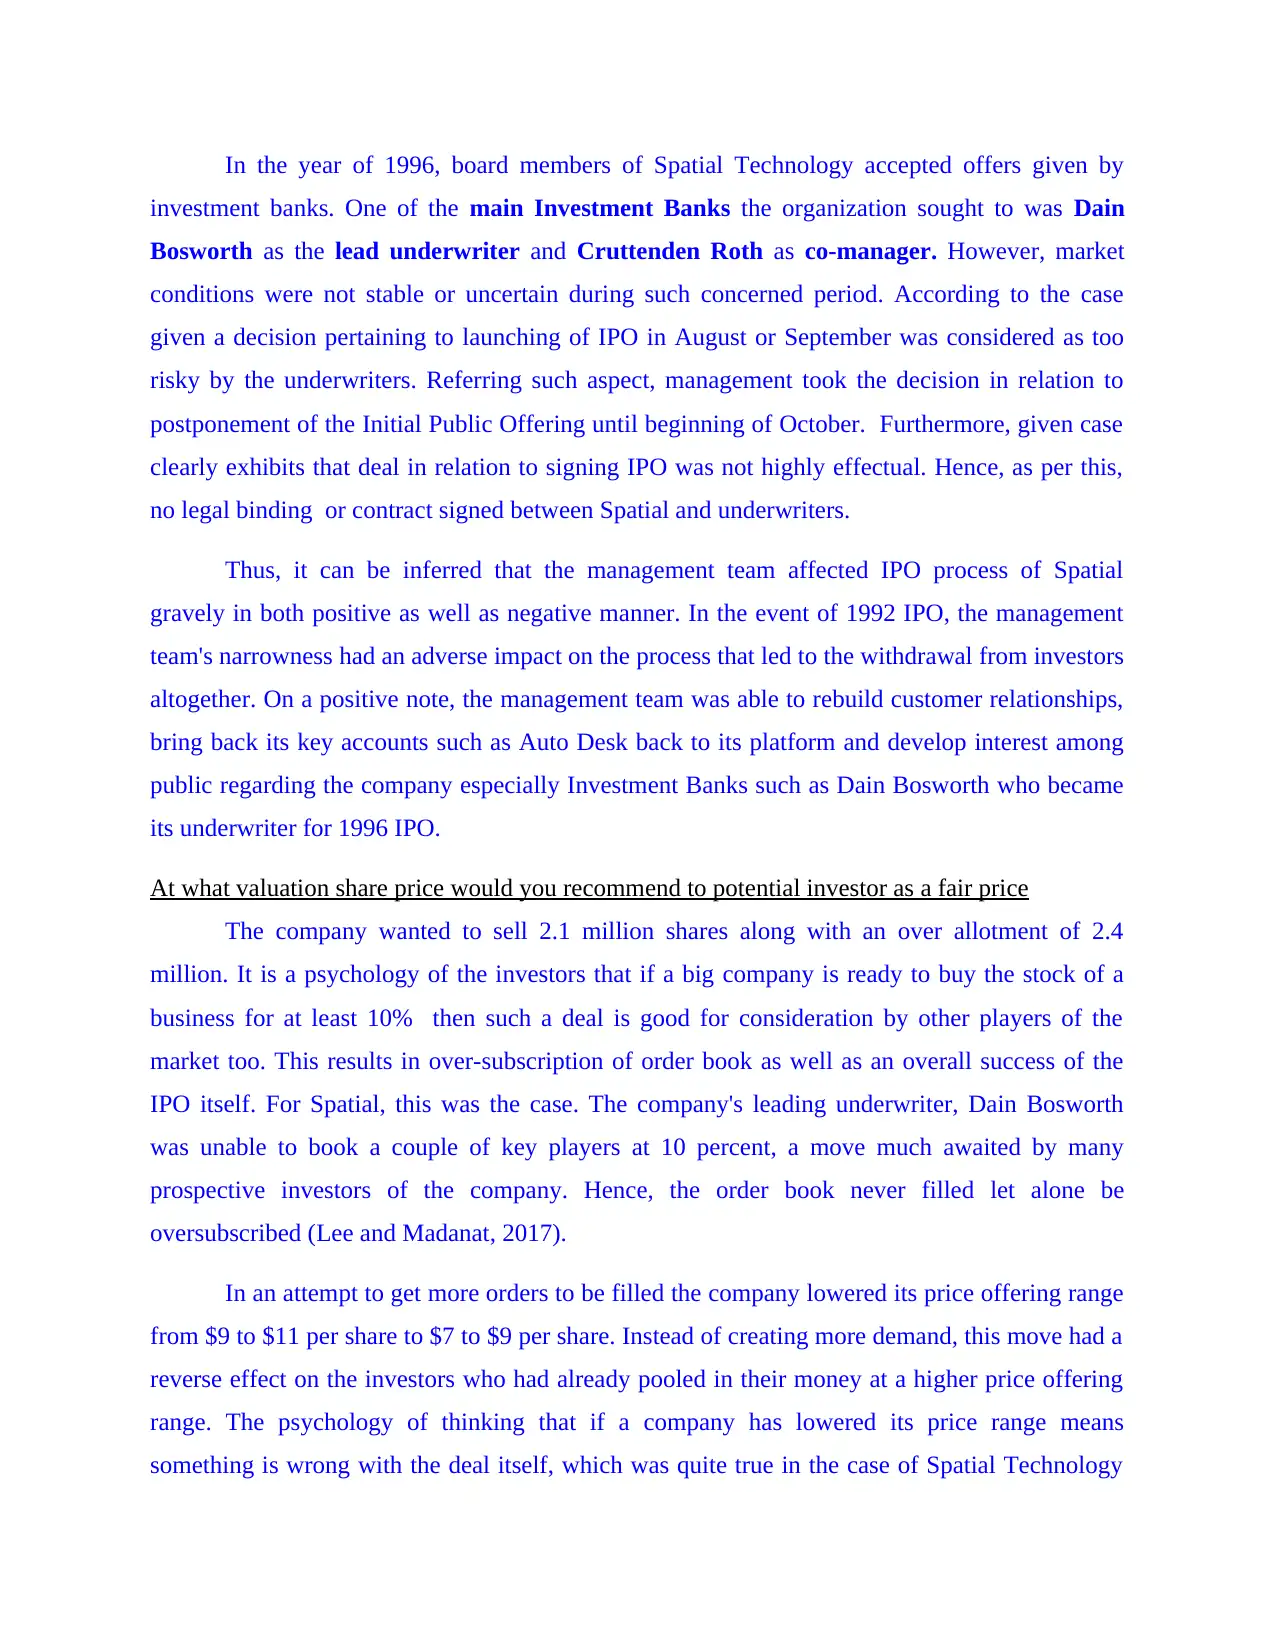
In the year of 1996, board members of Spatial Technology accepted offers given by
investment banks. One of the main Investment Banks the organization sought to was Dain
Bosworth as the lead underwriter and Cruttenden Roth as co-manager. However, market
conditions were not stable or uncertain during such concerned period. According to the case
given a decision pertaining to launching of IPO in August or September was considered as too
risky by the underwriters. Referring such aspect, management took the decision in relation to
postponement of the Initial Public Offering until beginning of October. Furthermore, given case
clearly exhibits that deal in relation to signing IPO was not highly effectual. Hence, as per this,
no legal binding or contract signed between Spatial and underwriters.
Thus, it can be inferred that the management team affected IPO process of Spatial
gravely in both positive as well as negative manner. In the event of 1992 IPO, the management
team's narrowness had an adverse impact on the process that led to the withdrawal from investors
altogether. On a positive note, the management team was able to rebuild customer relationships,
bring back its key accounts such as Auto Desk back to its platform and develop interest among
public regarding the company especially Investment Banks such as Dain Bosworth who became
its underwriter for 1996 IPO.
At what valuation share price would you recommend to potential investor as a fair price
The company wanted to sell 2.1 million shares along with an over allotment of 2.4
million. It is a psychology of the investors that if a big company is ready to buy the stock of a
business for at least 10% then such a deal is good for consideration by other players of the
market too. This results in over-subscription of order book as well as an overall success of the
IPO itself. For Spatial, this was the case. The company's leading underwriter, Dain Bosworth
was unable to book a couple of key players at 10 percent, a move much awaited by many
prospective investors of the company. Hence, the order book never filled let alone be
oversubscribed (Lee and Madanat, 2017).
In an attempt to get more orders to be filled the company lowered its price offering range
from $9 to $11 per share to $7 to $9 per share. Instead of creating more demand, this move had a
reverse effect on the investors who had already pooled in their money at a higher price offering
range. The psychology of thinking that if a company has lowered its price range means
something is wrong with the deal itself, which was quite true in the case of Spatial Technology
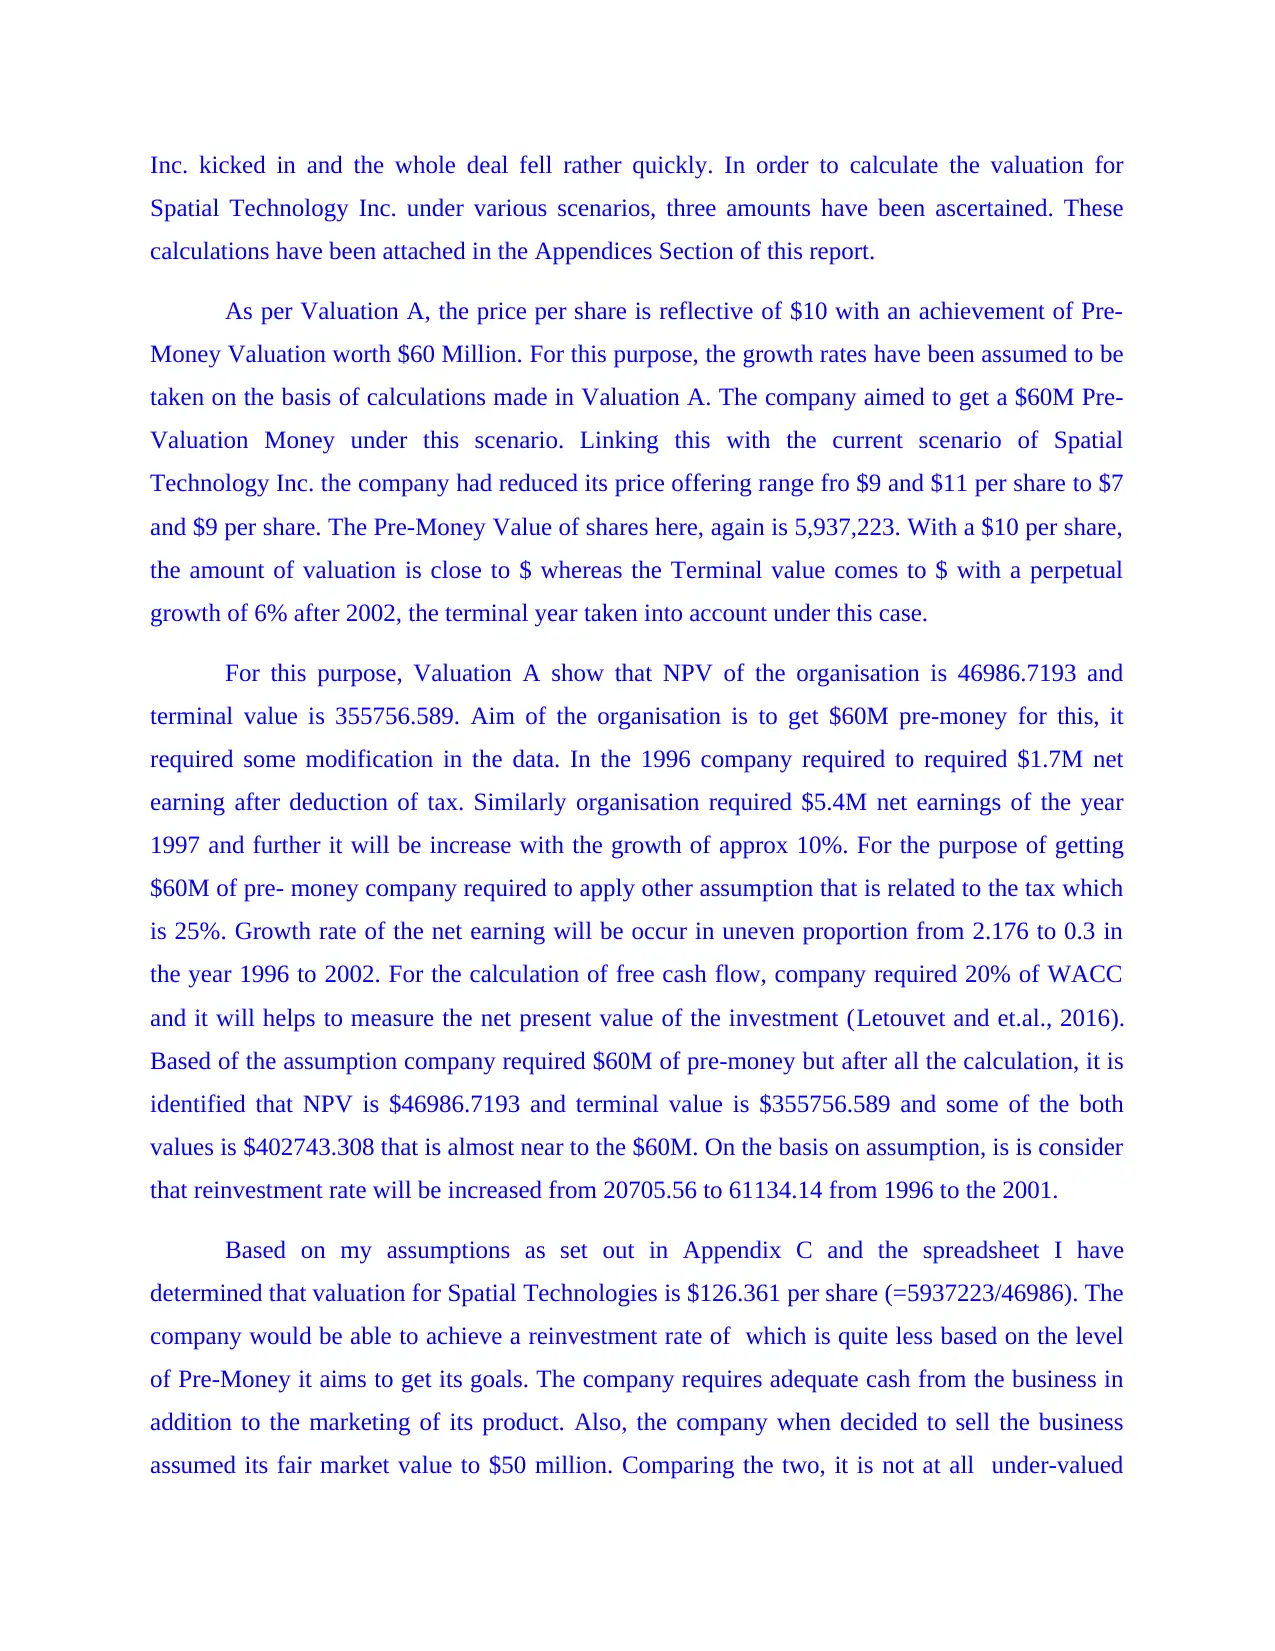
Inc. kicked in and the whole deal fell rather quickly. In order to calculate the valuation for
Spatial Technology Inc. under various scenarios, three amounts have been ascertained. These
calculations have been attached in the Appendices Section of this report.
As per Valuation A, the price per share is reflective of $10 with an achievement of Pre-
Money Valuation worth $60 Million. For this purpose, the growth rates have been assumed to be
taken on the basis of calculations made in Valuation A. The company aimed to get a $60M Pre-
Valuation Money under this scenario. Linking this with the current scenario of Spatial
Technology Inc. the company had reduced its price offering range fro $9 and $11 per share to $7
and $9 per share. The Pre-Money Value of shares here, again is 5,937,223. With a $10 per share,
the amount of valuation is close to $ whereas the Terminal value comes to $ with a perpetual
growth of 6% after 2002, the terminal year taken into account under this case.
For this purpose, Valuation A show that NPV of the organisation is 46986.7193 and
terminal value is 355756.589. Aim of the organisation is to get $60M pre-money for this, it
required some modification in the data. In the 1996 company required to required $1.7M net
earning after deduction of tax. Similarly organisation required $5.4M net earnings of the year
1997 and further it will be increase with the growth of approx 10%. For the purpose of getting
$60M of pre- money company required to apply other assumption that is related to the tax which
is 25%. Growth rate of the net earning will be occur in uneven proportion from 2.176 to 0.3 in
the year 1996 to 2002. For the calculation of free cash flow, company required 20% of WACC
and it will helps to measure the net present value of the investment (Letouvet and et.al., 2016).
Based of the assumption company required $60M of pre-money but after all the calculation, it is
identified that NPV is $46986.7193 and terminal value is $355756.589 and some of the both
values is $402743.308 that is almost near to the $60M. On the basis on assumption, is is consider
that reinvestment rate will be increased from 20705.56 to 61134.14 from 1996 to the 2001.
Based on my assumptions as set out in Appendix C and the spreadsheet I have
determined that valuation for Spatial Technologies is $126.361 per share (=5937223/46986). The
company would be able to achieve a reinvestment rate of which is quite less based on the level
of Pre-Money it aims to get its goals. The company requires adequate cash from the business in
addition to the marketing of its product. Also, the company when decided to sell the business
assumed its fair market value to $50 million. Comparing the two, it is not at all under-valued
⊘ This is a preview!⊘
Do you want full access?
Subscribe today to unlock all pages.
Trusted by 1+ million students worldwide
and is not the ideal situation to be taken into consideration as the Market will be able to gain
profit on its sale instead of company itself. In addition to this, investors would not want to invest
in a business with such a low cost as they would be of the opinion that if a deal is so cheap, it
must be having some or the other issues related to it. Hence, the valuation carried out in this
scenario would not be completed and true on the basis of valuation carried by assuming 25% tax
rate as well $30 Million Pre- Money Valuation.
As per Valuation B, the price per share is reflective of $5 with an achievement of Pre-
Money Valuation worth $30 Million. For this purpose, the growth rates have been assumed to be
taken on the basis of calculations made in Valuation A. The company aimed to get a $30M Pre-
Valuation Money under this scenario. Linking this with the current scenario of Spatial
Technology Inc. the company had reduced its price offering range fro $9 and $11 per share to $7
and $9 per share. The Pre-Money Value of shares here, again is 5,937,223. With a $5 per share,
the amount of valuation is close to $30286.49 whereas the Terminal value comes to $12212.71
with a perpetual growth of 6% after 2002, the terminal year taken into account under this case.
Based on my assumptions as set out in Appendix C and the spreadsheet I have
determined that valuation for Spatial Technologies is $135.07 per share (=5937223/43954.556).
The company would be able to achieve a reinvestment rate of 1.19% which is quite less based on
the level of Pre-Money it aims to get its goals. The company requires adequate cash from the
business in addition to the marketing of its product. Also, the company when decided to sell the
business assumed its fair market value to $50 million.
Lastly, in the valuation part C attached to the Appendix section of this report, a more
realistic trend in growth has been taken into account unlike its other two counterparts calculated
above (Mousa, Kim and Rutherford, 2016). I would recommend a price of $126.36 to the
potential investors where the price quoted by the company as well as the valuation both are at
par. Based on the realistic calculations of 1996 Balance Sheet, Pro Forma and Income Statement
as well as the spreadsheet, the valuation of Spatial Technology, Inc. As its unrealistic to make a
pre-money valuation of $60 or $30 Million by a company swamped with debts, cash lock ins as
well as problems in filling order for the business, it would not be able to achieve its target at all.
Even when the company has been valued in 1996, the enterprise value comes to $12649.77
Paraphrase This Document
Need a fresh take? Get an instant paraphrase of this document with our AI Paraphraser
which is no where near the calculations made in the valuation criterion taken in previous
Valuations A and B (Popova and Kozhevnikova, 2013).
On the basis of Valuation A, it can be said that the enterprise value as well valuation per
share is low even when the pre-money valuation comes to $126.361. However, when Valuation
C is taken into consideration based on the assumption that the growth trends are much more
realistic in nature, the company has been fairly valued. For Valuation B, the company is highly
under-valued and is not the ideal situation to be taken into consideration as the market will be
able to gain profit on its sale instead of company itself. Hence, $126.361 should be taken as the
fair value price for Spatial Technology Inc.
Is Spatial a good investment deal or not
Investors would not want to invest in a business with such a low cost as they would be of
the opinion that if a deal is so cheap, it must be having some or the other issues related to it.
Looking at the other problems such as cash inflows, liquidity, working capital as well as the
prospects of the company, it would not be feasible to invest in the company at all since there are
high chances of failure or loss on investor's part with very high risk involvement. Hence, the
valuation carried out in this scenario would not be completed and true on the basis of valuation
carried by assuming 25% tax rate as well $30 Million Pre- Money Valuation (Mauer and et.al.,
2013).
This case study has given me a lot of insights to consider while implementing my own
entrepreneurial plans or financial career in the industry. These have been enumerated as under: Importance of Investor Interest in the success of IPOs: I was able to understand that the
complications arising in IPO Process due to the inadequacy to fill orders and gain interest
of stakeholders almost led to the demise of Spatial Technology. Management Team: The above case scenario points out how the management was able
to recoup its customer base as well as relationships. This gave me an insight into how
valuable teamwork is.
Flexibility and Openness: Also, one cannot ignore the opinions of others in a company,
especially when there is problems arising due to the existing management structure. It is
important to be open to new ideas and flexible as contradicting these values can have
grave consequences for the company as well as the people related to it.
From the above insights collected, I am of the opinion that even though the given IPO
failed, a good management control as well as proper stakeholder analysis would have created
vast opportunities for the organisation. Hence, according to me, investment in business and
finance industry is very feasible. Only if Spatial had been able to manage itself properly, it could
have become an industry standard too for the 3D Modelling Industry.
Summarizing Impact of Analysis
Spatial Technology Inc. the success or otherwise of the business' strategy to penetrate
market depended on how fast the investors as well as its customers such as Hewlett Packard,
Microsoft and Intel among others were able to bring the ACIS-based Applications to the end
users. Based on this, the success of Spatial Technology is highly negligible. The analysis done
above can effectively point out where the IPO of 1992 and 1996 stood correct and where they
committed grave mistakes. This analysis would effect to determine the true value of Spatial
Technology through a three case scenario of the company wherein the first is at par, second is
under-valued and third is based on realistic trends by taking necessary assumptions into
consideration.
CONCLUSION
From the above discussion it can be observed that the company was unable to achieve the
target, firstly due to the issues in relation to the instability of ACIS product itself and secondly
through rebuilding of customer relationships which was lost when the 1992 IPO failed miserably
on the grounds of narrow management team. As far as the management team working in the IPO
process is concerned there were many changes made in the team due to which the company had
to face a lot of legal proceedings thus, increasing its losses and liabilities towards external
parties. Once the IPO was established, the new management team was able to stabilize ACIS
product as well as create strong customer relationships which helped in regaining its position in
the market. Lastly, it would be feasible to invest in the business based on the future opportunities
and growth the CAD/CAM Market as well as 3D Modelling Industry holds in general, if the
valuations are not to be taken as the factor to consider the IPO in question. Apart from that, it
would not be a good idea to invest in this business. Hence, it would be beneficial for the
⊘ This is a preview!⊘
Do you want full access?
Subscribe today to unlock all pages.
Trusted by 1+ million students worldwide
1 out of 21
Related Documents


Your All-in-One AI-Powered Toolkit for Academic Success.
+13062052269
info@desklib.com
Available 24*7 on WhatsApp / Email
![[object Object]](/_next/static/media/star-bottom.7253800d.svg)
Unlock your academic potential
Copyright © 2020–2026 A2Z Services. All Rights Reserved. Developed and managed by ZUCOL.