Financial Analysis Report for Speciality Fashion Group Limited
VerifiedAdded on 2020/02/19
|21
|6207
|47
Report
AI Summary
This report presents a comprehensive financial analysis of Speciality Fashion Group Limited, evaluating its performance through horizontal, vertical, and ratio analysis techniques. The analysis encompasses the income statement, balance sheet, and cash flow statements, comparing the company's financial data over several years. Horizontal analysis reveals trends and changes in financial statement items, while vertical analysis assesses the proportion of each item relative to a base figure. Ratio analysis, including liquidity, profitability, and gearing ratios, provides insights into the company's financial health, efficiency, and capital structure. The report identifies key performance indicators, highlights areas of improvement, and offers recommendations for enhancing the company's financial position, stability, and viability. The conclusion emphasizes the need for strategic adjustments to optimize the company's financial performance, supported by references to relevant financial management literature and an appendix with financial statement data.
RUNNING HEAD: Accounting financial analysis report
1
Accounting financial analysis Report
1
Accounting financial analysis Report
Paraphrase This Document
Need a fresh take? Get an instant paraphrase of this document with our AI Paraphraser
Accounting financial analysis report 2
Executive summary
This report has been prepared to analyze the financial performance of the Speciality
fashion group limited. Various techniques have been used to analyze the financial
performance of the company. In this report, horizontal, vertical and ratio analysis has been
conducted. This report depict the user about various points such as how the company is
performing this year, how many changes have taken into place in financial performance of
the company from last year, how is the financial performance of the company and so on.
Financial statement analysis is a study in which various statements are studied with the help
of many tools and techniques to identify the performance of the company so that a better
decision could be made by the company as well as the stakeholders to manage the decisions.
Accounting financial analysis report 3
Contents
Introduction.......................................................................................................................4
Analysis............................................................................................................................4
Horizontal analysis.......................................................................................................4
Vertical analysis............................................................................................................6
Financial ratio analysis.................................................................................................7
Conclusion........................................................................................................................9
References.......................................................................................................................10
Appendix.........................................................................................................................11
⊘ This is a preview!⊘
Do you want full access?
Subscribe today to unlock all pages.
Trusted by 1+ million students worldwide
Accounting financial analysis report 4
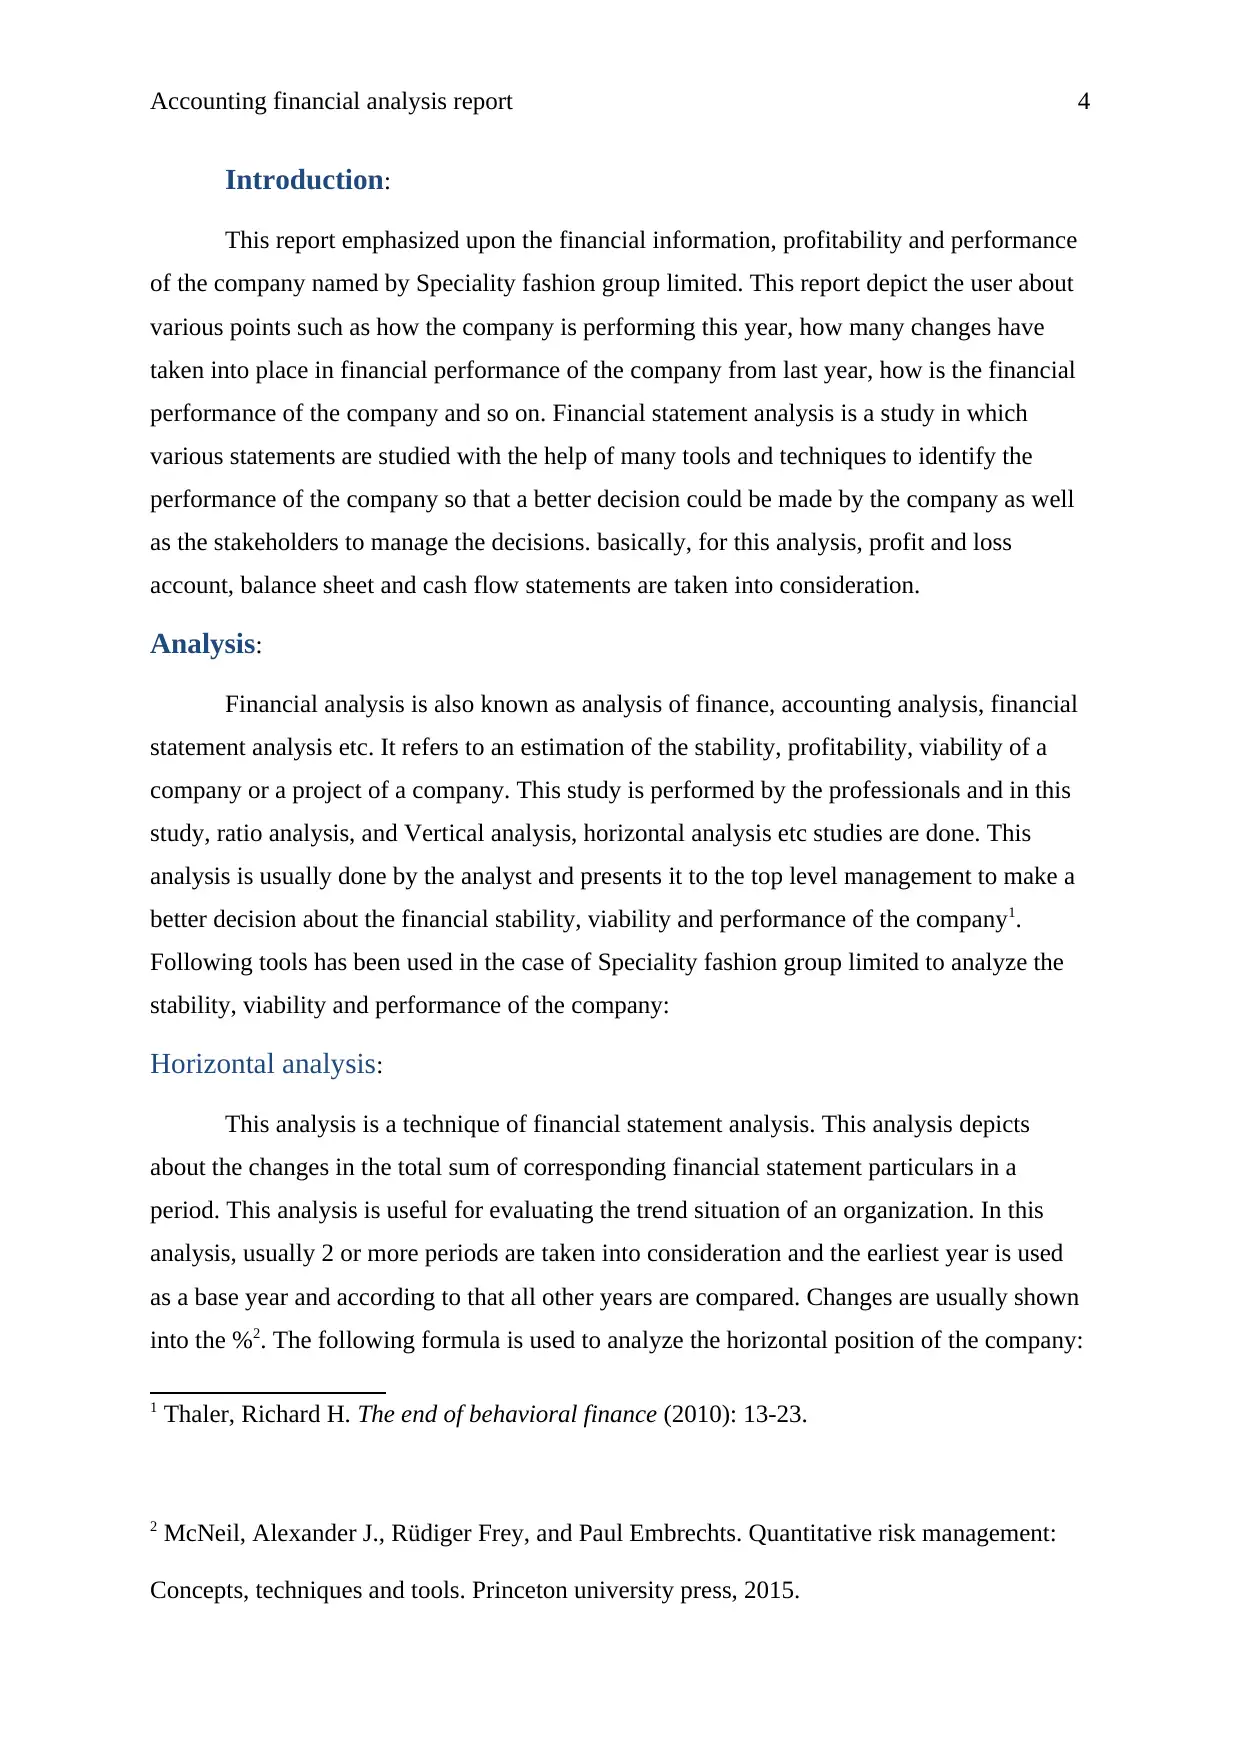
Introduction:
This report emphasized upon the financial information, profitability and performance
of the company named by Speciality fashion group limited. This report depict the user about
various points such as how the company is performing this year, how many changes have
taken into place in financial performance of the company from last year, how is the financial
performance of the company and so on. Financial statement analysis is a study in which
various statements are studied with the help of many tools and techniques to identify the
performance of the company so that a better decision could be made by the company as well
as the stakeholders to manage the decisions. basically, for this analysis, profit and loss
account, balance sheet and cash flow statements are taken into consideration.
Analysis:
Financial analysis is also known as analysis of finance, accounting analysis, financial
statement analysis etc. It refers to an estimation of the stability, profitability, viability of a
company or a project of a company. This study is performed by the professionals and in this
study, ratio analysis, and Vertical analysis, horizontal analysis etc studies are done. This
analysis is usually done by the analyst and presents it to the top level management to make a
better decision about the financial stability, viability and performance of the company1.
Following tools has been used in the case of Speciality fashion group limited to analyze the
stability, viability and performance of the company:
Horizontal analysis:
This analysis is a technique of financial statement analysis. This analysis depicts
about the changes in the total sum of corresponding financial statement particulars in a
period. This analysis is useful for evaluating the trend situation of an organization. In this
analysis, usually 2 or more periods are taken into consideration and the earliest year is used
as a base year and according to that all other years are compared. Changes are usually shown
into the %2. The following formula is used to analyze the horizontal position of the company:
1 Thaler, Richard H. The end of behavioral finance (2010): 13-23.
2 McNeil, Alexander J., Rüdiger Frey, and Paul Embrechts. Quantitative risk management:
Concepts, techniques and tools. Princeton university press, 2015.
Paraphrase This Document
Need a fresh take? Get an instant paraphrase of this document with our AI Paraphraser
Accounting financial analysis report 5
= (Dollar changes / Amount of the item in base year) *100
Horizontal analysis study has been performed in the Speciality fashion group limited
to analyze the performance of the company in caparison of last year. Through the study, it has
been analyzed that various changes have taken place into the 2016’s performance of the
company in comparison of 2015. It has been found that the revenue of the company is
depicting an increment from last year and further, the cost of revenue of the company has
also been enhanced3. It has been found that the increment in the revenue from last year is just
4.43% whereas the cost of revenue of the company has been enhanced by 11.89% and it has
been found that the various changes have been taken place from last year in the income
statement of the company.
Further, balance sheet of the company has been analyzed. Through the study, it has
been analyzed that various changes have taken place into the 2016’s financial performance of
the company in comparison of 2015 in the balance sheet. It has been found that the total
assets of the company is depicting an increment from last year and further, the current asset
of the company has also been enhanced. It has been found that the increment in the total
assets from last year is just 2.31% whereas the total liability of the company has been
enhanced by 9.27% and it has been found that the various changes have been taken place
from last year in the balance sheet of the company in last 3 years.
Lastly, cash flow statement of the company has been analyzed. Through the study, it
has been analyzed that various changes have taken place into the 2016’s financial
performance of the company in comparison of 2015 and 2014 in the balance sheet. It has
been found that the total cash inflow from operating activities of the company is depicting an
increment from last year and further, the cash inflow from investing activities of the company
has also been enhanced. It has been found that the increment in the cash inflow from
operating activities from last year is 520% whereas the cash inflow from investing activities
of the company has been enhanced by 23.08% and at the same time cash inflow from
financing activities has been similar from last year. Thus it has been found that the various
3 Hillier, D. J., Stephen A. Ross, Randolph W. Westerfield, Jeffrey Jaffe, and Bradford D.
Jordan. Corporate finance (McGraw Hill, 2010).
Accounting financial analysis report 6
changes have been taken place from last year in the cash flow statement of the company in
last 3 years.
Vertical analysis:
This analysis is a technique of financial statement analysis. This analysis depicts
about the changes in the total sum of corresponding financial statement particulars according
to the main base such as total revenue, total assets, liabilities etc. This analysis is useful for
evaluating the trend situation of an organization. In this analysis, usually 1 or more periods
are taken into consideration and the total revenue, total assets, liabilities etc are taken as a
base and according to that all other particulars are compared. Changes are usually shown into
the %.
Vertical analysis study has been performed in the Speciality fashion group limited to
analyze the performance of the company in caparison of the main base of the statement.
Through the study, it has been analyzed that the cost of revenue is 44.48%, 41.52% and
40.56% in 2016, 2015 and 2014 respectively. Further, it has been analyzed that the total
operating expenses is 55.39%, 58.73% and 61.05% in 2016, 2015 and 2014. Further, it has
been found that the net income of the company in comparison of total revenue of the
company is -0.24%, -0.51% and 1.76% in last 3 years4.
Further, balance sheet of the company has been analyzed and found that various
changes have taken place in the company from last year in comparison of total assets and
liabilities. Through the study, it has been analyzed that the total current asset is 53.39%,
53.24% and 51.79% in 2016, 2015 and 2014 respectively. Further, it has been analyzed that
the noncurrent asset is 46.61%, 47.22% and 48.66% in 2016, 2015 and 2014. Further, it has
been found that the current, noncurrent liability and shareholder equity of the company in
comparison of total liability and shareholder’s equity of the company is 52.04%, 46.30% and
45.98% and 22.62%, 23.61% and 24.11% and 25.34%, 30.09% and 29.91% respectively in
last 3 years5.
4 Pompian, Michael M. Behavioral finance and wealth management: how to build optimal
portfolios that account for investor biase. (Vol. 667. John Wiley & Sons, 2011).
5 Moran, Mark, Doug Porter, and Jodie Curth-Bibb. Funding Indigenous organisations:
improving governance performance through innovations in public finance management in
⊘ This is a preview!⊘
Do you want full access?
Subscribe today to unlock all pages.
Trusted by 1+ million students worldwide
Accounting financial analysis report 7
Financial ratio analysis:
Lastly, for analyzing the performance, stability and viability of the company, ratio
analysis has been done. It has been found through this study that how the company is
performing in context of liquidity, profitability, efficiency and capital structure. For this
study, various ratios have been calculated which are as follows:
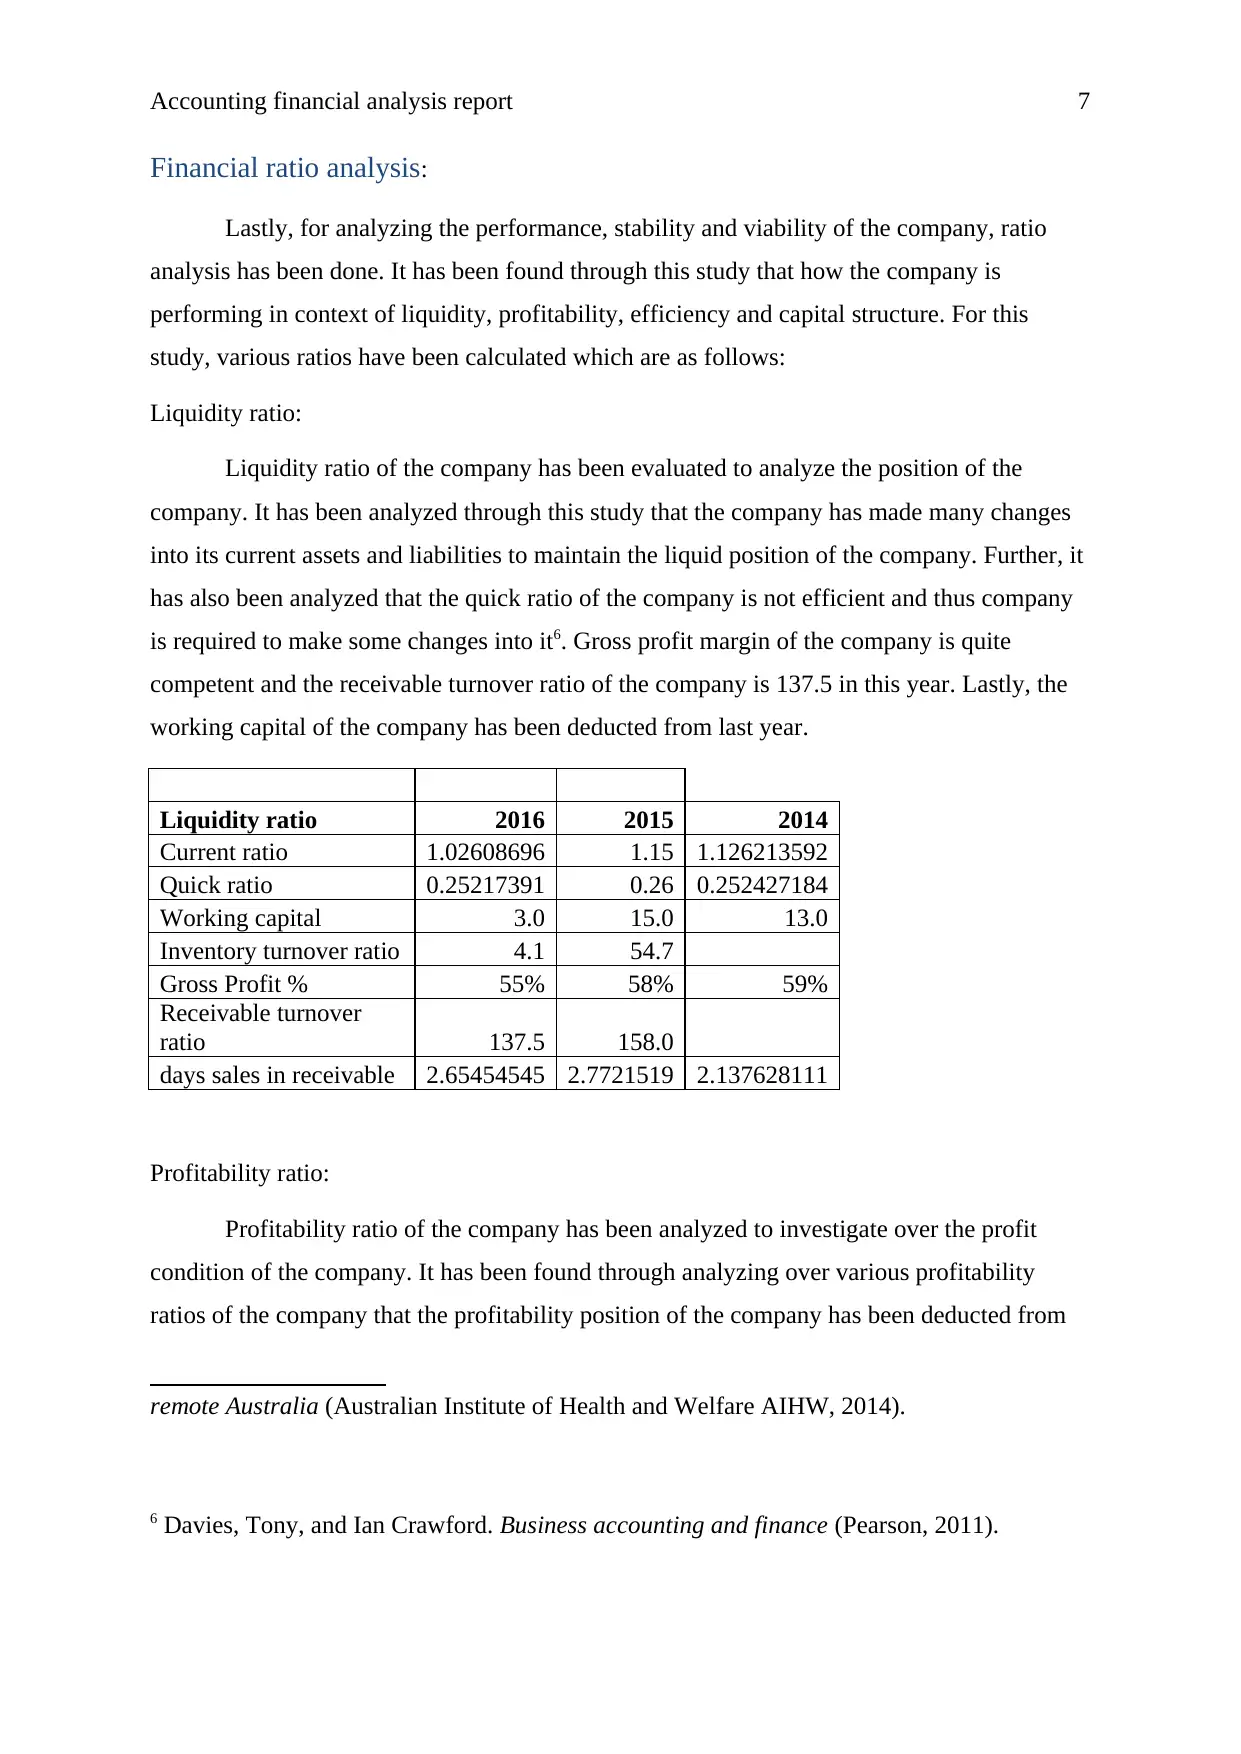
Liquidity ratio:
Liquidity ratio of the company has been evaluated to analyze the position of the
company. It has been analyzed through this study that the company has made many changes
into its current assets and liabilities to maintain the liquid position of the company. Further, it
has also been analyzed that the quick ratio of the company is not efficient and thus company
is required to make some changes into it6. Gross profit margin of the company is quite
competent and the receivable turnover ratio of the company is 137.5 in this year. Lastly, the
working capital of the company has been deducted from last year.
Liquidity ratio 2016 2015 2014
Current ratio 1.02608696 1.15 1.126213592
Quick ratio 0.25217391 0.26 0.252427184
Working capital 3.0 15.0 13.0
Inventory turnover ratio 4.1 54.7
Gross Profit % 55% 58% 59%
Receivable turnover
ratio 137.5 158.0
days sales in receivable 2.65454545 2.7721519 2.137628111
Profitability ratio:
Profitability ratio of the company has been analyzed to investigate over the profit
condition of the company. It has been found through analyzing over various profitability
ratios of the company that the profitability position of the company has been deducted from
remote Australia (Australian Institute of Health and Welfare AIHW, 2014).
6 Davies, Tony, and Ian Crawford. Business accounting and finance (Pearson, 2011).
Financial ratio analysis:
Lastly, for analyzing the performance, stability and viability of the company, ratio
analysis has been done. It has been found through this study that how the company is
performing in context of liquidity, profitability, efficiency and capital structure. For this
study, various ratios have been calculated which are as follows:
Liquidity ratio:
Liquidity ratio of the company has been evaluated to analyze the position of the
company. It has been analyzed through this study that the company has made many changes
into its current assets and liabilities to maintain the liquid position of the company. Further, it
has also been analyzed that the quick ratio of the company is not efficient and thus company
is required to make some changes into it6. Gross profit margin of the company is quite
competent and the receivable turnover ratio of the company is 137.5 in this year. Lastly, the
working capital of the company has been deducted from last year.
Liquidity ratio 2016 2015 2014
Current ratio 1.02608696 1.15 1.126213592
Quick ratio 0.25217391 0.26 0.252427184
Working capital 3.0 15.0 13.0
Inventory turnover ratio 4.1 54.7
Gross Profit % 55% 58% 59%
Receivable turnover
ratio 137.5 158.0
days sales in receivable 2.65454545 2.7721519 2.137628111
Profitability ratio:
Profitability ratio of the company has been analyzed to investigate over the profit
condition of the company. It has been found through analyzing over various profitability
ratios of the company that the profitability position of the company has been deducted from
remote Australia (Australian Institute of Health and Welfare AIHW, 2014).
6 Davies, Tony, and Ian Crawford. Business accounting and finance (Pearson, 2011).
Paraphrase This Document
Need a fresh take? Get an instant paraphrase of this document with our AI Paraphraser
Accounting financial analysis report 8
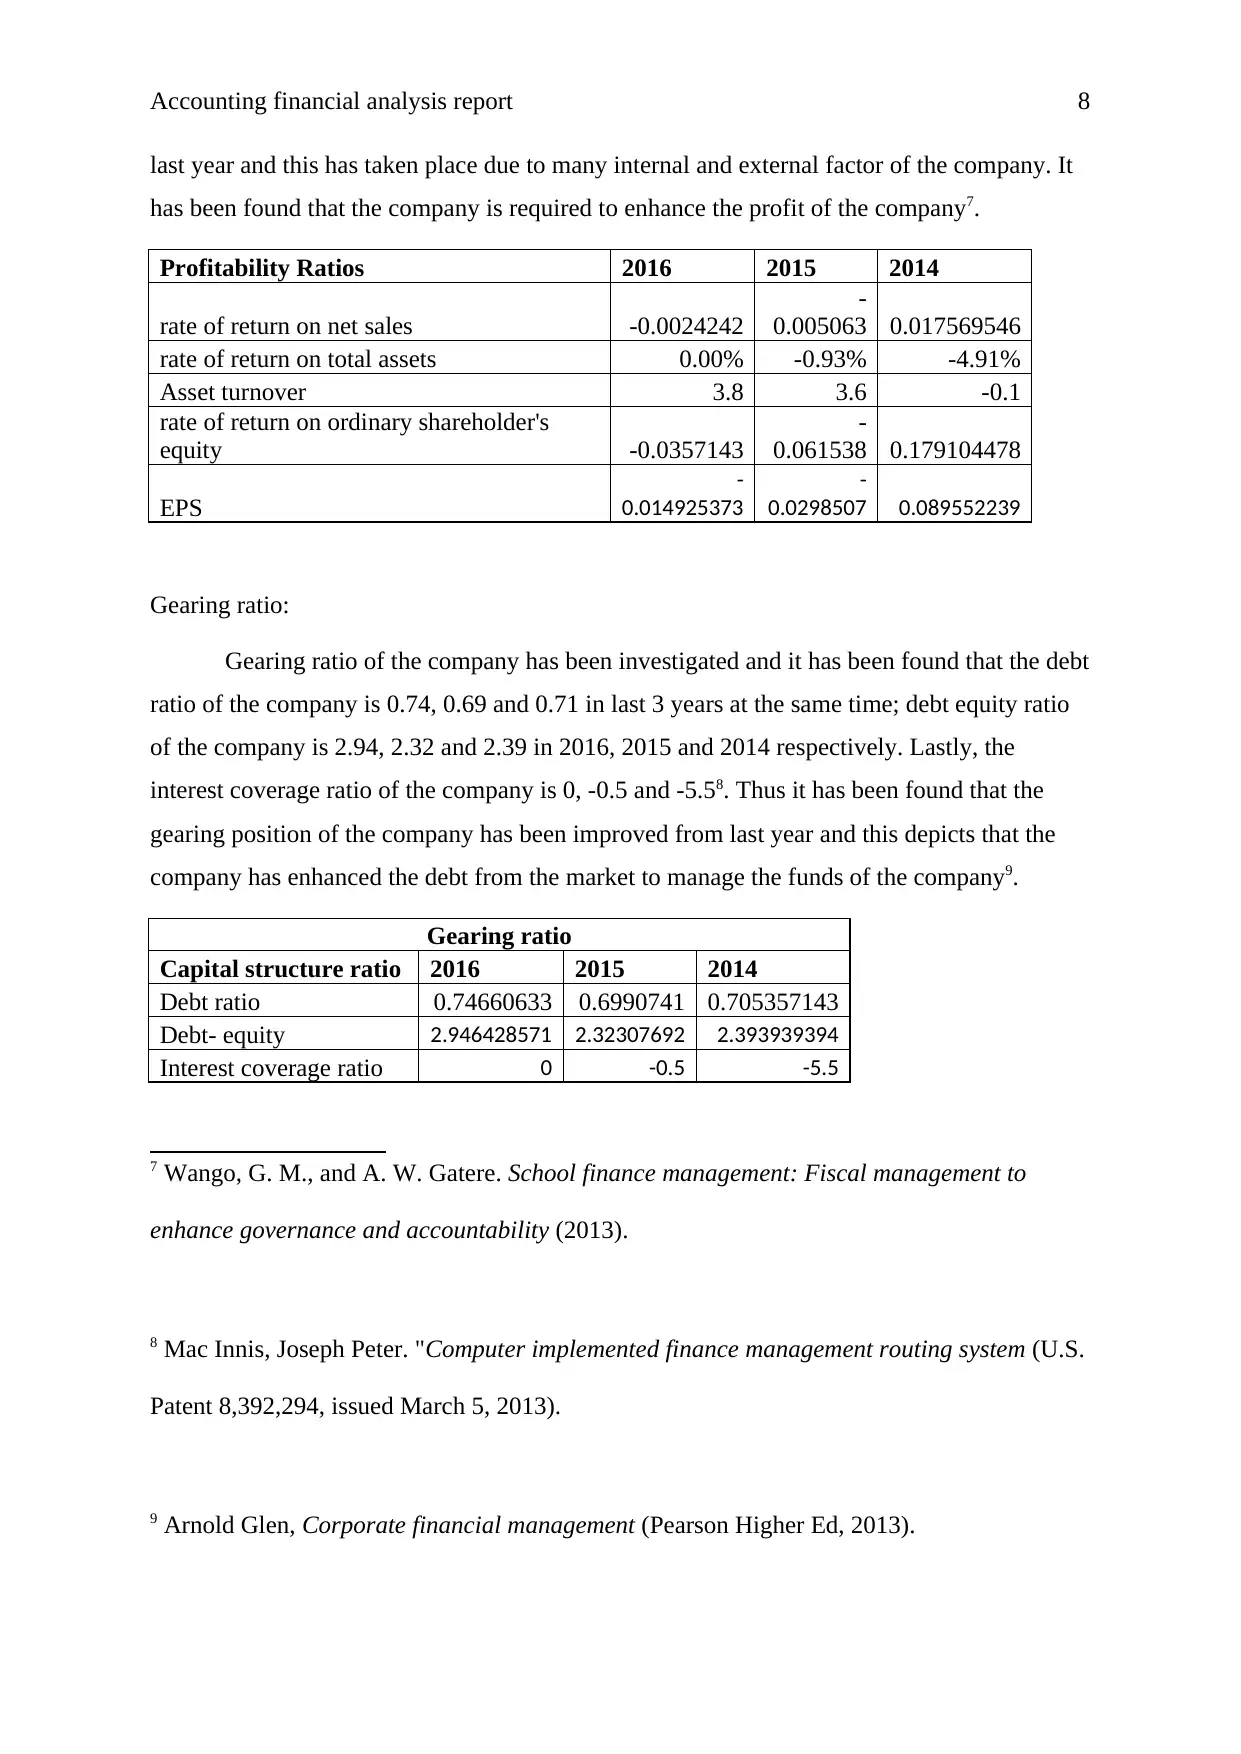
last year and this has taken place due to many internal and external factor of the company. It
has been found that the company is required to enhance the profit of the company7.
Profitability Ratios 2016 2015 2014
rate of return on net sales -0.0024242
-
0.005063 0.017569546
rate of return on total assets 0.00% -0.93% -4.91%
Asset turnover 3.8 3.6 -0.1
rate of return on ordinary shareholder's
equity -0.0357143
-
0.061538 0.179104478
EPS
-
0.014925373
-
0.0298507 0.089552239
Gearing ratio:
Gearing ratio of the company has been investigated and it has been found that the debt
ratio of the company is 0.74, 0.69 and 0.71 in last 3 years at the same time; debt equity ratio
of the company is 2.94, 2.32 and 2.39 in 2016, 2015 and 2014 respectively. Lastly, the
interest coverage ratio of the company is 0, -0.5 and -5.58. Thus it has been found that the
gearing position of the company has been improved from last year and this depicts that the
company has enhanced the debt from the market to manage the funds of the company9.
Gearing ratio
Capital structure ratio 2016 2015 2014
Debt ratio 0.74660633 0.6990741 0.705357143
Debt- equity 2.946428571 2.32307692 2.393939394
Interest coverage ratio 0 -0.5 -5.5
7 Wango, G. M., and A. W. Gatere. School finance management: Fiscal management to
enhance governance and accountability (2013).
8 Mac Innis, Joseph Peter. "Computer implemented finance management routing system (U.S.
Patent 8,392,294, issued March 5, 2013).
9 Arnold Glen, Corporate financial management (Pearson Higher Ed, 2013).
Accounting financial analysis report 9
Conclusion:
Thus through this study, it has been found that the overall position of the company has
been reduced from last 2 years due to many internal and external issues. It is recommended to
the directors to make changes into the financial position of the company to maintain and
manage the profitability, funds, stability and viability into the financial statement of the
company. Thus it could be concluded that some changes are required to be done in the
operations of the company to manage the performance of the company.
⊘ This is a preview!⊘
Do you want full access?
Subscribe today to unlock all pages.
Trusted by 1+ million students worldwide
Accounting financial analysis report 10
References:
Glen A, Corporate financial management (Pearson Higher Ed, 2013).
Hillier, D. J., Stephen A. Ross, Randolph W. Westerfield, Jeffrey Jaffe, and Bradford D.
Jordan. Corporate finance. (McGraw Hill, 2010).
Innis, M, and Peter J. Computer implemented finance management routing system (U.S.
Patentm 8,392,294, issued March 5, 2013).
McNeil, Alexander J., Rüdiger Frey, and Paul Embrechts. Quantitative risk management:
Concepts, techniques and tools (Princeton university press, 2015).
Michael M. Behavioral finance and wealth management: how to build optimal portfolios that
account for investor biases (Vol. 667. John Wiley & Sons, 2011).
Moran, M, Porter D., and Jodie. Funding Indigenous organisations: improving governance
performance through innovations in public finance management in remote Australia.
Australian Institute of Health and Welfare (AIHW, 2014).
Thaler, Richard H. "The end of behavioral finance." (2010): 13-23.
Tony D, and Crawford I. Business accounting and finance (Pearson, 2011).
Wango, G. M., and Gatere A. W. School finance management: Fiscal management to
enhance governance and accountability (2013).
Paraphrase This Document
Need a fresh take? Get an instant paraphrase of this document with our AI Paraphraser
Accounting financial analysis report 11
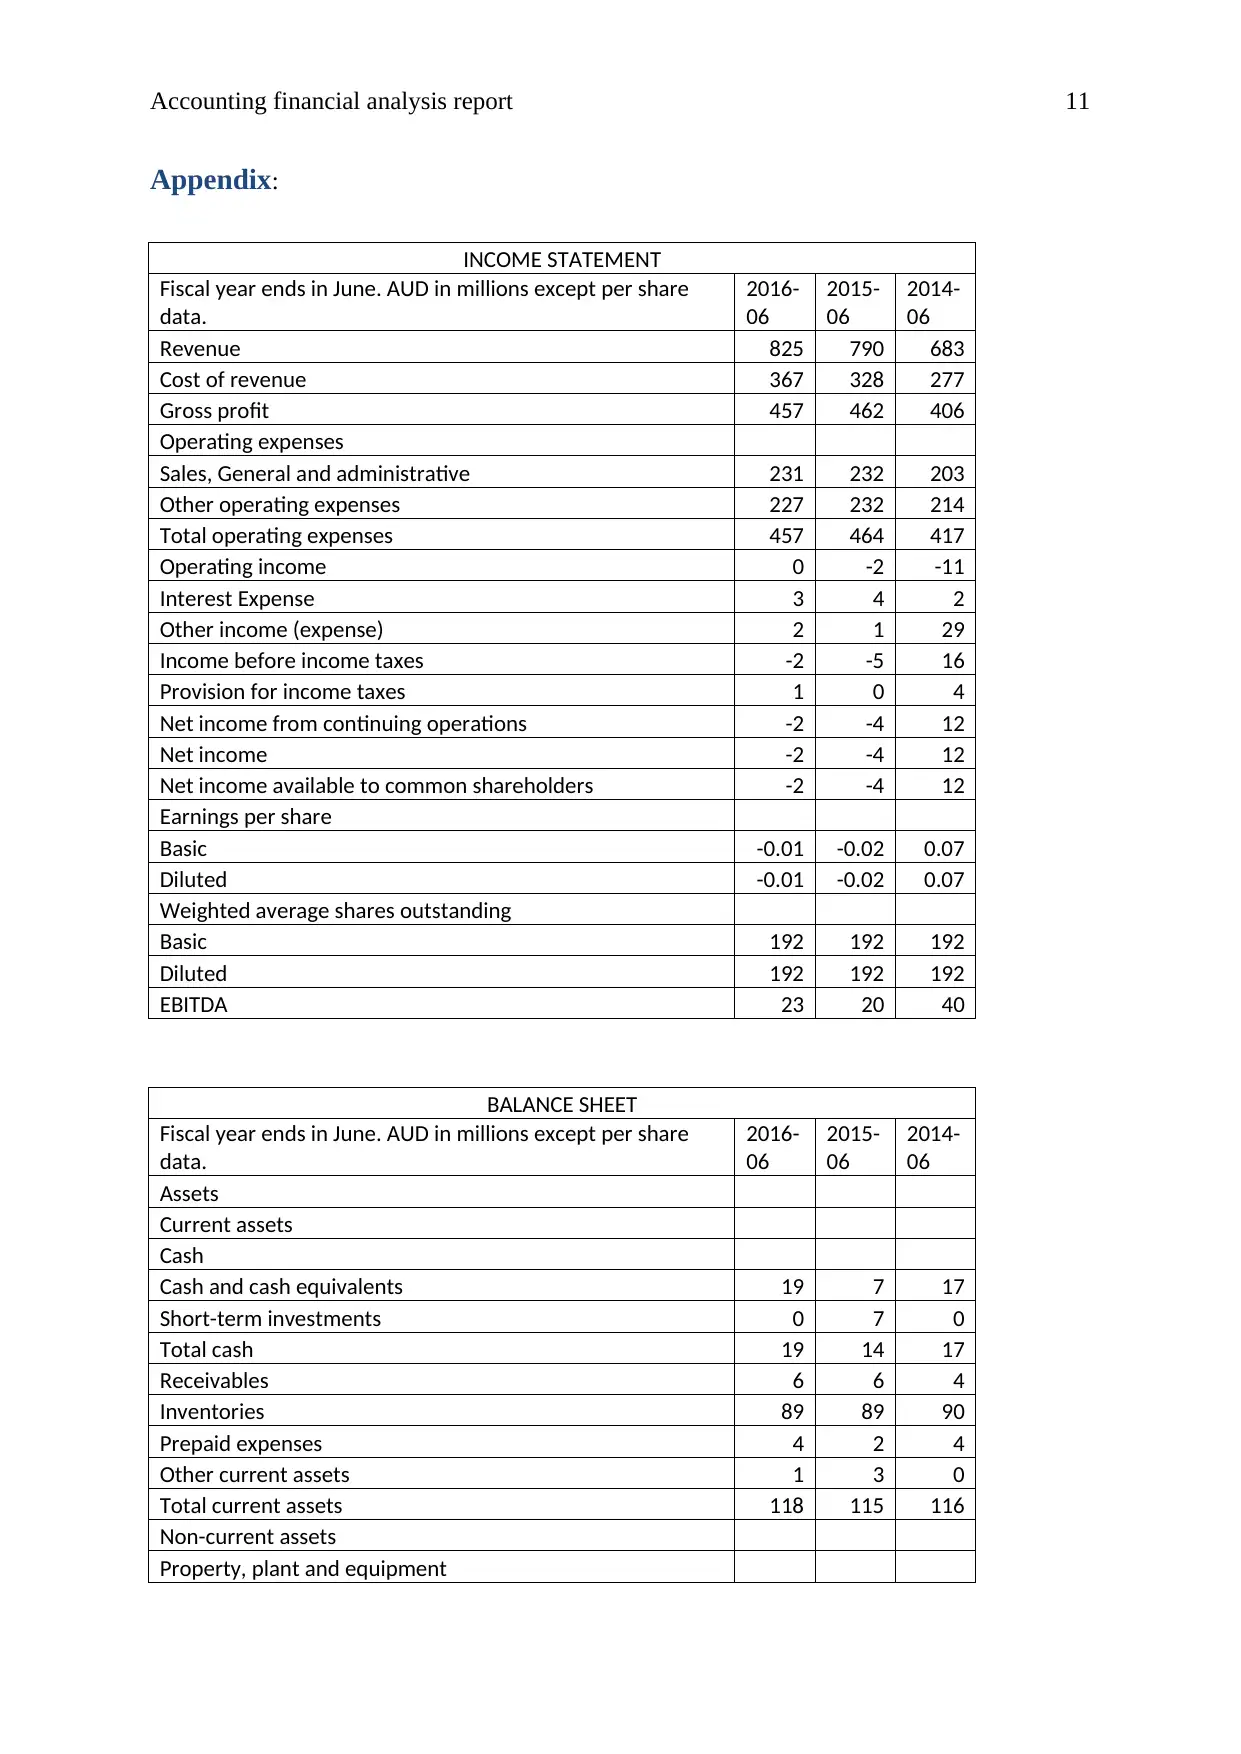
Appendix:
INCOME STATEMENT
Fiscal year ends in June. AUD in millions except per share
data.
2016-
06
2015-
06
2014-
06
Revenue 825 790 683
Cost of revenue 367 328 277
Gross profit 457 462 406
Operating expenses
Sales, General and administrative 231 232 203
Other operating expenses 227 232 214
Total operating expenses 457 464 417
Operating income 0 -2 -11
Interest Expense 3 4 2
Other income (expense) 2 1 29
Income before income taxes -2 -5 16
Provision for income taxes 1 0 4
Net income from continuing operations -2 -4 12
Net income -2 -4 12
Net income available to common shareholders -2 -4 12
Earnings per share
Basic -0.01 -0.02 0.07
Diluted -0.01 -0.02 0.07
Weighted average shares outstanding
Basic 192 192 192
Diluted 192 192 192
EBITDA 23 20 40
BALANCE SHEET
Fiscal year ends in June. AUD in millions except per share
data.
2016-
06
2015-
06
2014-
06
Assets
Current assets
Cash
Cash and cash equivalents 19 7 17
Short-term investments 0 7 0
Total cash 19 14 17
Receivables 6 6 4
Inventories 89 89 90
Prepaid expenses 4 2 4
Other current assets 1 3 0
Total current assets 118 115 116
Non-current assets
Property, plant and equipment
Accounting financial analysis report 12
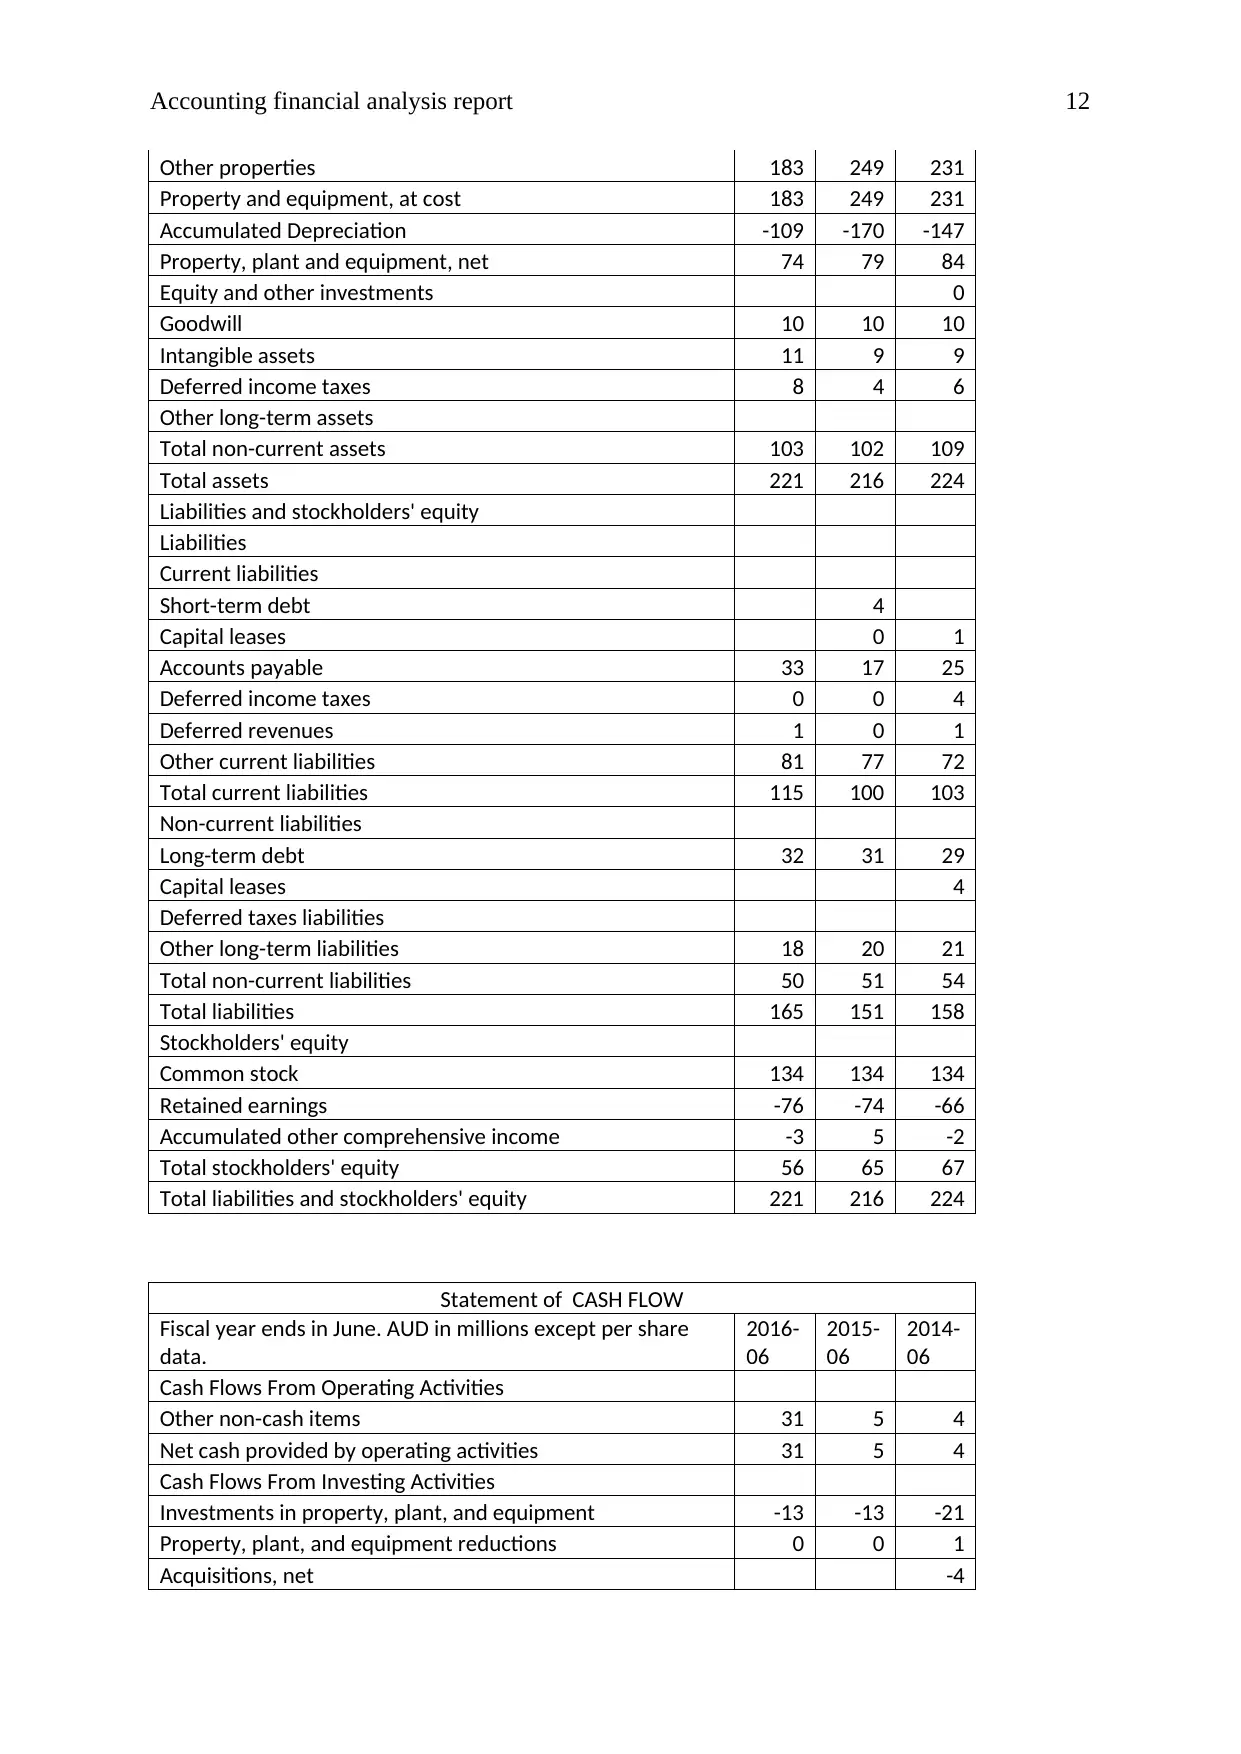
Other properties 183 249 231
Property and equipment, at cost 183 249 231
Accumulated Depreciation -109 -170 -147
Property, plant and equipment, net 74 79 84
Equity and other investments 0
Goodwill 10 10 10
Intangible assets 11 9 9
Deferred income taxes 8 4 6
Other long-term assets
Total non-current assets 103 102 109
Total assets 221 216 224
Liabilities and stockholders' equity
Liabilities
Current liabilities
Short-term debt 4
Capital leases 0 1
Accounts payable 33 17 25
Deferred income taxes 0 0 4
Deferred revenues 1 0 1
Other current liabilities 81 77 72
Total current liabilities 115 100 103
Non-current liabilities
Long-term debt 32 31 29
Capital leases 4
Deferred taxes liabilities
Other long-term liabilities 18 20 21
Total non-current liabilities 50 51 54
Total liabilities 165 151 158
Stockholders' equity
Common stock 134 134 134
Retained earnings -76 -74 -66
Accumulated other comprehensive income -3 5 -2
Total stockholders' equity 56 65 67
Total liabilities and stockholders' equity 221 216 224
Statement of CASH FLOW
Fiscal year ends in June. AUD in millions except per share
data.
2016-
06
2015-
06
2014-
06
Cash Flows From Operating Activities
Other non-cash items 31 5 4
Net cash provided by operating activities 31 5 4
Cash Flows From Investing Activities
Investments in property, plant, and equipment -13 -13 -21
Property, plant, and equipment reductions 0 0 1
Acquisitions, net -4
⊘ This is a preview!⊘
Do you want full access?
Subscribe today to unlock all pages.
Trusted by 1+ million students worldwide
1 out of 21
Related Documents


Your All-in-One AI-Powered Toolkit for Academic Success.
+13062052269
info@desklib.com
Available 24*7 on WhatsApp / Email
![[object Object]](/_next/static/media/star-bottom.7253800d.svg)
Unlock your academic potential
Copyright © 2020–2026 A2Z Services. All Rights Reserved. Developed and managed by ZUCOL.