Financial Analysis of Spectris and Quartix Companies
VerifiedAdded on 2020/05/28
|27
|5345
|208
AI Summary
This analysis focuses on evaluating the financial standing of Spectris and Quartix using key financial metrics. By examining the P/E ratios, we gain insights into how much investors are willing to pay per dollar of earnings for each company, which helps in understanding market perceptions about future growth prospects. A lower P/E might suggest undervaluation or potential issues, whereas a higher P/E could indicate overvaluation or strong growth expectations. Additionally, by assessing the price-to-book value ratio, we can determine how well the stock prices reflect the companies' net asset values on their balance sheets. This metric is crucial for identifying whether stocks are trading at a premium or discount relative to their intrinsic book value. The comparison of these ratios across both companies will allow us to deduce which company might be in better financial health by providing a clearer picture of market valuation and potential investment attractiveness. Through this detailed examination, stakeholders can make informed decisions regarding the comparative advantages of investing in Spectris versus Quartix.
Undergraduate
Assignment Cover Sheet
Student Number
Unit code KAP013-3 Assignment No. 1
Unit Title Financial Accounting 2
Unit Coordinator Peter Djabang
Due Date 20th Jan 2018
Assignment Cover Sheet
Student Number
Unit code KAP013-3 Assignment No. 1
Unit Title Financial Accounting 2
Unit Coordinator Peter Djabang
Due Date 20th Jan 2018
Paraphrase This Document
Need a fresh take? Get an instant paraphrase of this document with our AI Paraphraser
2ADVANCED FINANCIAL ACCOUNTING
Executive summary:
The report is prepared to illustrate and evaluate the financial performance of three companies using the
tool of ratio analysis. Three companies that have been selected from London stock exchange that is AB
Dynamics, Quartix Plc and Spectris Plc. Data for carrying out ratio analysis of these companies have
been retrieved from annual reports present on their websites. Companies financial performance have
been evaluated by analyzing their liquidity position, solvency position, efficiency position, profitability
position and investment position. Later part of report provides with the recommendations for
companies to improve their financial performance.
3ADVANCED FINANCIAL ACCOUNTING
Table of Contents
Executive summary:................................................................................................... 1
Introduction:................................................................................................................3
Theoretical background:.............................................................................................4
Advantages of ratio analysis for assessing financial performance of companies:......5
Limitations of using ratio analysis:..............................................................................6
Comparative analysis:................................................................................................ 7
Findings, Conclusions and Recommendation:..........................................................22
References and Bibliography list:.............................................................................24
Appendix:..................................................................................................................27
⊘ This is a preview!⊘
Do you want full access?
Subscribe today to unlock all pages.
Trusted by 1+ million students worldwide
4ADVANCED FINANCIAL ACCOUNTING
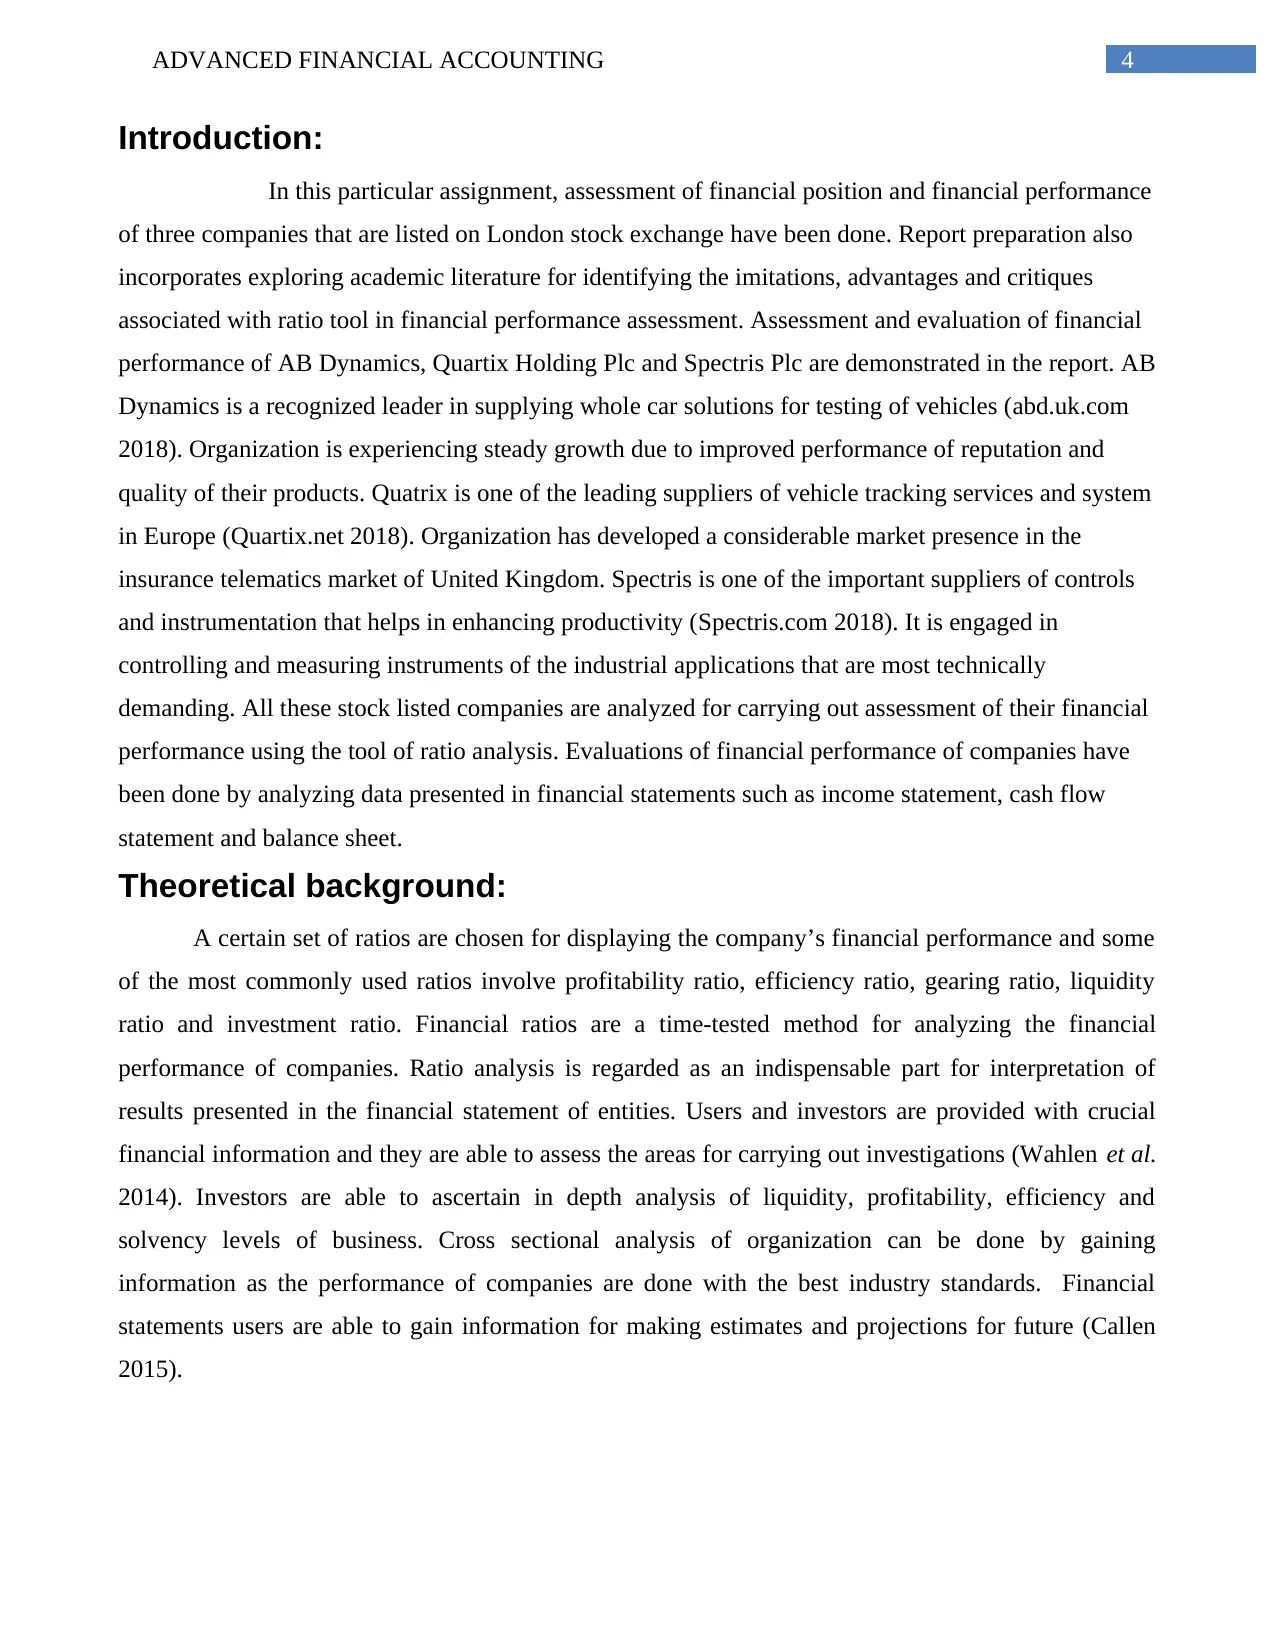
Introduction:
In this particular assignment, assessment of financial position and financial performance
of three companies that are listed on London stock exchange have been done. Report preparation also
incorporates exploring academic literature for identifying the imitations, advantages and critiques
associated with ratio tool in financial performance assessment. Assessment and evaluation of financial
performance of AB Dynamics, Quartix Holding Plc and Spectris Plc are demonstrated in the report. AB
Dynamics is a recognized leader in supplying whole car solutions for testing of vehicles (abd.uk.com
2018). Organization is experiencing steady growth due to improved performance of reputation and
quality of their products. Quatrix is one of the leading suppliers of vehicle tracking services and system
in Europe (Quartix.net 2018). Organization has developed a considerable market presence in the
insurance telematics market of United Kingdom. Spectris is one of the important suppliers of controls
and instrumentation that helps in enhancing productivity (Spectris.com 2018). It is engaged in
controlling and measuring instruments of the industrial applications that are most technically
demanding. All these stock listed companies are analyzed for carrying out assessment of their financial
performance using the tool of ratio analysis. Evaluations of financial performance of companies have
been done by analyzing data presented in financial statements such as income statement, cash flow
statement and balance sheet.
Theoretical background:
A certain set of ratios are chosen for displaying the company’s financial performance and some
of the most commonly used ratios involve profitability ratio, efficiency ratio, gearing ratio, liquidity
ratio and investment ratio. Financial ratios are a time-tested method for analyzing the financial
performance of companies. Ratio analysis is regarded as an indispensable part for interpretation of
results presented in the financial statement of entities. Users and investors are provided with crucial
financial information and they are able to assess the areas for carrying out investigations (Wahlen et al.
2014). Investors are able to ascertain in depth analysis of liquidity, profitability, efficiency and
solvency levels of business. Cross sectional analysis of organization can be done by gaining
information as the performance of companies are done with the best industry standards. Financial
statements users are able to gain information for making estimates and projections for future (Callen
2015).
Paraphrase This Document
Need a fresh take? Get an instant paraphrase of this document with our AI Paraphraser
5ADVANCED FINANCIAL ACCOUNTING
Advantages of ratio analysis for assessing financial performance
of companies:
The understanding of efficiency of users in way business are conducted is improved and the
latent aspects of business receive light by identification of numerical relationship. Investors will be able
to have detailed understanding of bright spots as well as problem areas of business if analyses of ratios
are done properly. It also assists management of organization to improve their financial situation in
future. Advantages of ratio analysis can be summarized below:
Assist in making comparative analysis- Calculation of ratios are not done for any
particular year, rather they are calculated year on year. Trends of business can be explored
when figures are kept side by side. Trend knowledge would help business in making
projections about its future performance (Schrand et al. 2016).
Enabling understanding the efficacy of decisions- Investors are able to make assessment
about whether business have undertaken proper investing, operating and financing decisions
(Henderson et al. 2015). It would indicate the contribution of such factors in performance
improvement.
Relationship establishment and simplification of complex figures- Ratio analysis helps
in generating relationships and simplification of accounting figures that are complex
(Konchitchki and Patatoukas 2016). Effectiveness of financial information can be
summarized using ratio tool and assessing credit worthiness of firms, managerial efficiency
and earning capacity.
Identifying problem areas of business- Investors are able to spot bright as well as
problematic areas of business. It is important for business to segregate these two areas, as
management will be focusing more on problematic areas and sharpening, and improving
further bright areas to get better results.
Enabling SWOT analysis- Changes occurring in business environment can be explained
by employing tool of ratio analysis (Cascino et al. 2016). Management of organization is
able to perform SWOT analysis and understand current opportunities and threats posed to
business with the help of information of change.
6ADVANCED FINANCIAL ACCOUNTING
Limitations of using ratio analysis:
No standardized definitions- Several concepts that are used in ratio analysis does not have
standardized definitions. Liquid liabilities do not have any standardized definition. It
generally incorporates all current liabilities but sometimes exclude bank overdraft.
Lack of Universally accepted level of standards- There level of ideal ratio cannot be
specified for judging the financial position as there do not exist any universal yardstick
(Maynard 2017).
Lacking ability for problem solving- Ratio analysis do not intend to provide any particular
solution to problems as they play a role of whistle blowing and is essentially indicative.
Current versus historical cost- It is certainty possible that some elements in the balance
sheet of reporting entity is stated at historical costs while income on income statement is
stated in current cost. This would create disparity between the results obtained by
conducting ratio analysis.
Accounting policies- Accounting policies of one company is different from another
company.
Accounting data limitations- Finality and precision of results obtained through ratio tool
comes with an unwarranted impression due to accounting data. Generally, materiality of
information is affected by accounting data that reflects a combination of accounting
conventions, personal judgments and recorded facts (Dutta and Patatoukas 2016). It is
certainly possible that financial statements do not reflect true state of affairs and hence true
pictures will not be provided by ratio.
Ignoring changes in level of price- Analysis of financial statements of different years of
organization becomes meaningless because change value of money is changed due to
accounting records.
The above listed points relating to ratio analysis depicts that there various advantages and
disadvantages. Due to several critics and limitations associated with ratio analysis, it is suggested that
investors and business should be used with due consciousness while evaluating the financial
performance of organization (Weygandt et al. 2015). This will help organization and investors as a
whole in planning strategies that will help in improving future performance. Furthermore, it has also
been ascertained that critics of ratio analysis is also associated with limitations of financial statements.
⊘ This is a preview!⊘
Do you want full access?
Subscribe today to unlock all pages.
Trusted by 1+ million students worldwide
7ADVANCED FINANCIAL ACCOUNTING
Comparative analysis:
In this section, analysis of financial performance of three chosen companies that is AB
Dynamics, Quartix Holding Plc and Spectris Plc are performed by using tool of ratio analysis. Ratios
have been computed for the period of three years that would help in identification of trend of
performance.
Profitability analysis- Profitability position of companies are analyzed by computing ratios
such as gross profit margin, net profit margin, return on investment and return on equity.
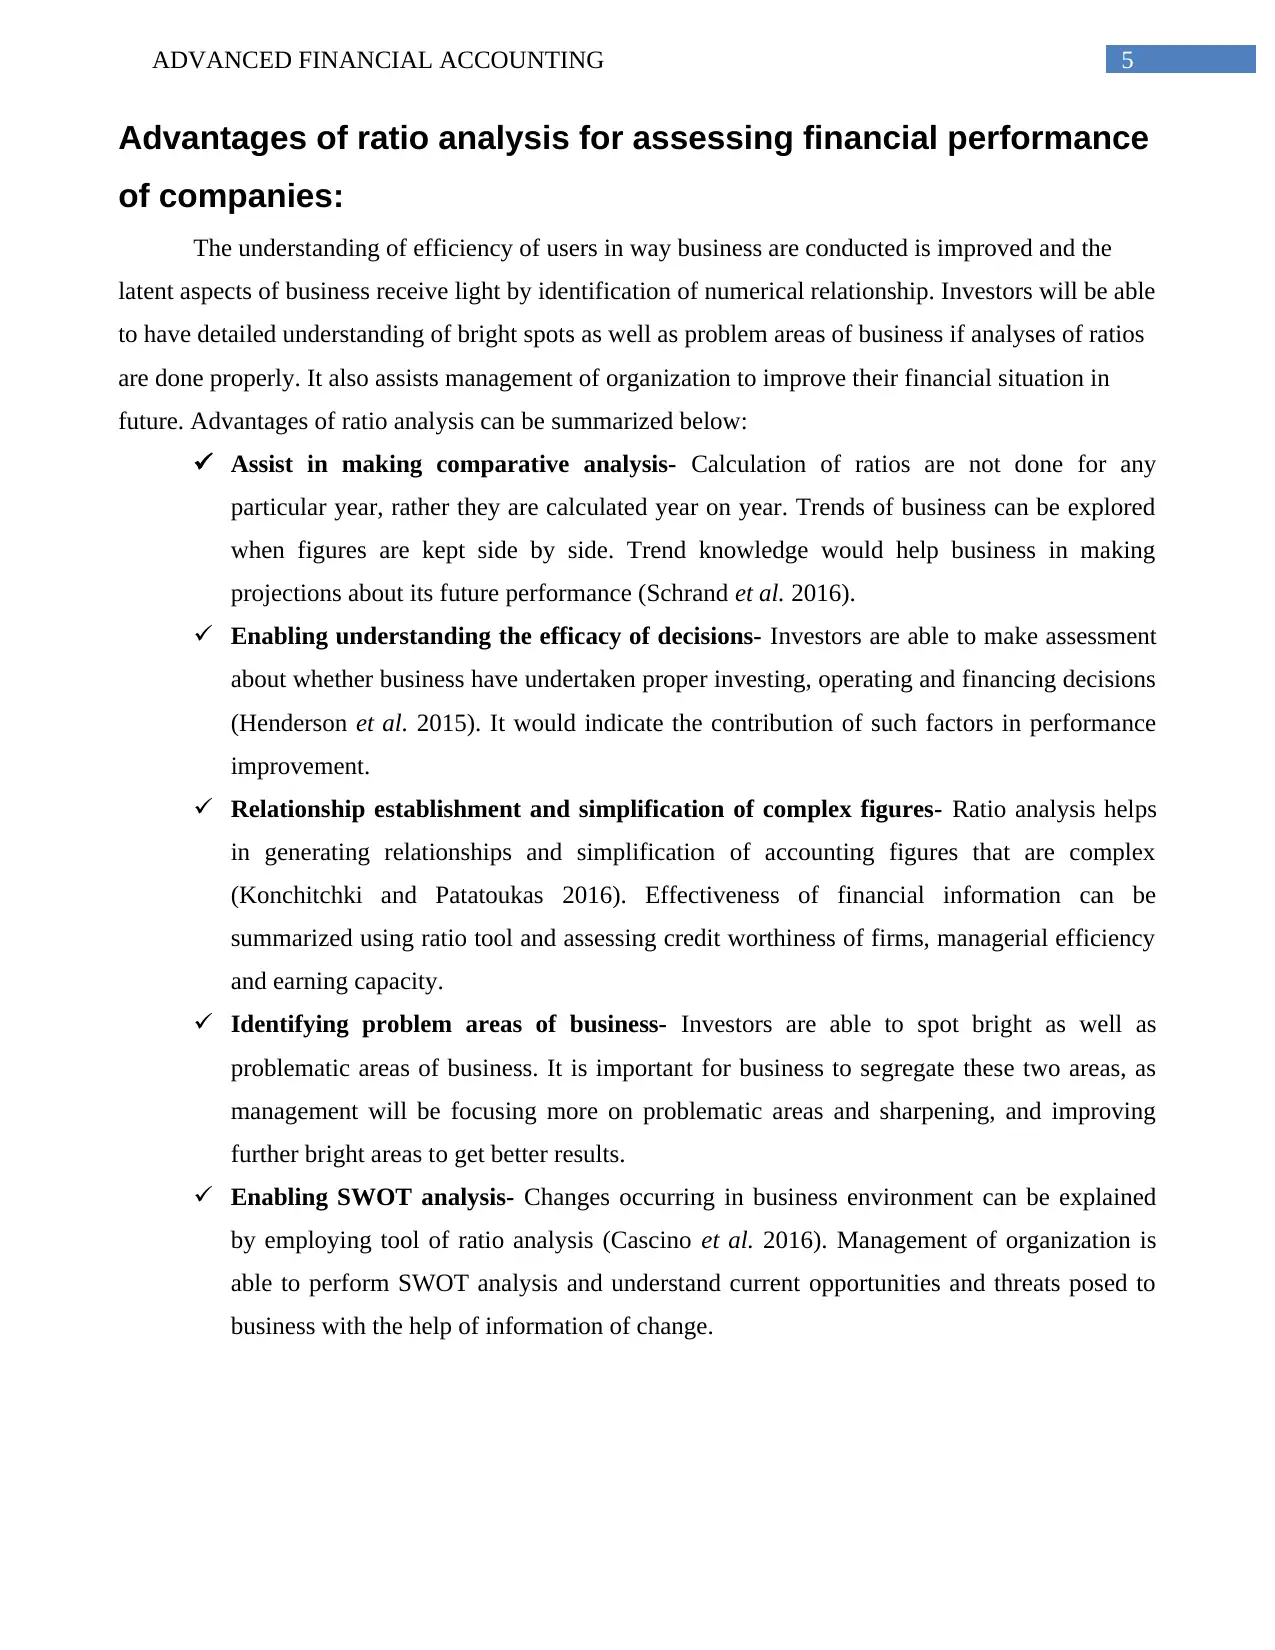
Gross profit margin- Gross margin of AB dynamics in year 2014 is computed at 29.10%,
Quartx has recorded profit margin of 64.86% and Spectric has recorded at 57.63%. It can be seen that
Quartx has recorded highest profit margin in year 2014. When looking at figures for year 2015, AB
dynamics stood at 32.38%, Quartx has profit margin of 63.61% and Spectric has 57.40%. Looking at
2016 figures, AB dynamics has recorded 30.17%, Quartx has ratio at 60.26% and Spectric gross
margin ratio stood at 56.51%. It is indicated by figures that all companies have downward trend in
relation to their gross margin. Graph depicts that gross profit margin trend of Quartx Plc is better
compared to its competitors.
2014 2015 2016
0.00%
10.00%
20.00%
30.00%
40.00%
50.00%
60.00%
70.00%
80.00%
85.00%
90.00%
95.00%
100.00%
105.00%
110.00%
115.00%
Gross Profit Margin
AB Dynamics Spectric Quartix
AB Trend Quartix Trend Spectric Trend
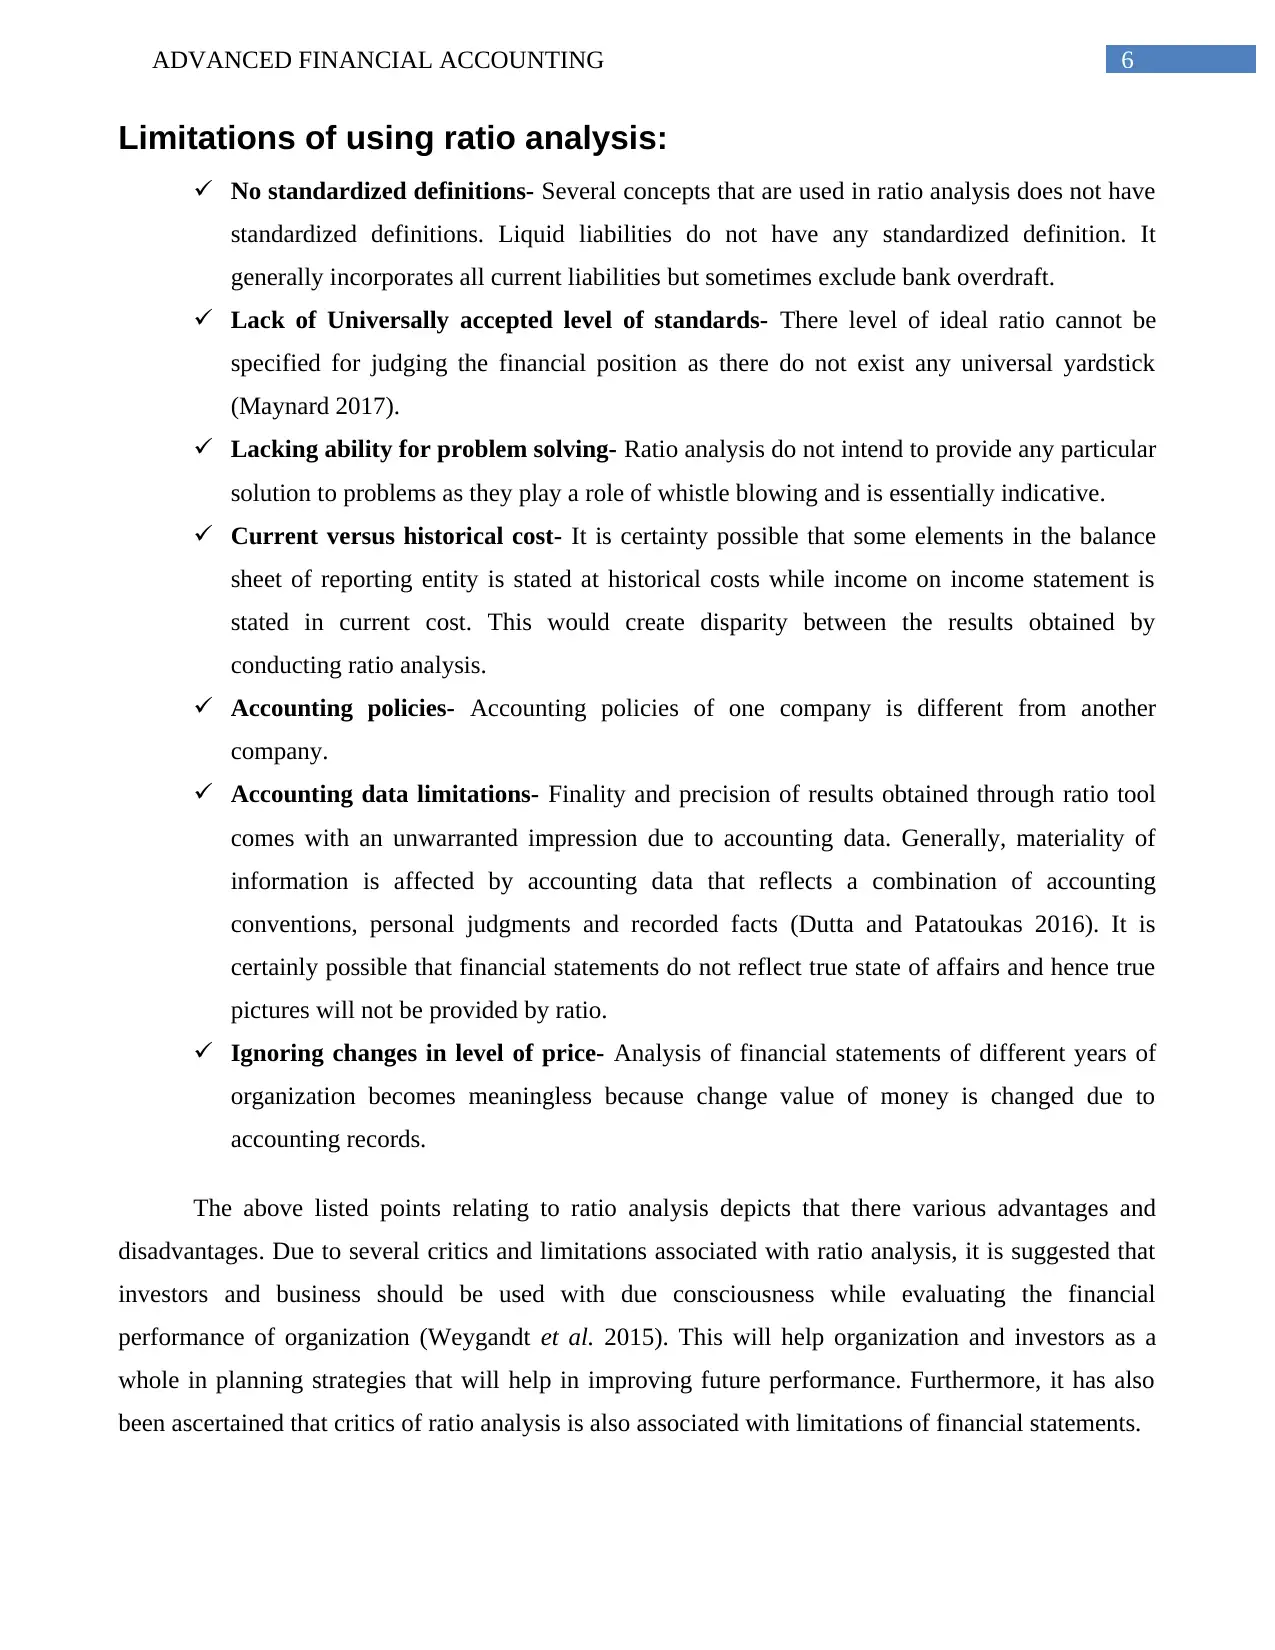
Net profit margin- Net profit margin recorded in year 2014 for AB dynamics stood at 15.54%,
Quartix recorded 26.30% and Spectris at 11.51%. Looking at figures for year 2015, AB dynamics
recorded 19.65%, Quartix recorded 25.48% and Spextris recorded 9.56%. For year 2016, AB dynamics
recorded net profit margin at 18.93%, Quartix recorded 24.99% and Spectris stood at 0.77%. It is
indicated by graph below that Spectris has maintained stable trend in generating net profit margin.
Therefore, Quartix is generating higher net profit margin compared to other companies.
Comparative analysis:
In this section, analysis of financial performance of three chosen companies that is AB
Dynamics, Quartix Holding Plc and Spectris Plc are performed by using tool of ratio analysis. Ratios
have been computed for the period of three years that would help in identification of trend of
performance.
Profitability analysis- Profitability position of companies are analyzed by computing ratios
such as gross profit margin, net profit margin, return on investment and return on equity.
Gross profit margin- Gross margin of AB dynamics in year 2014 is computed at 29.10%,
Quartx has recorded profit margin of 64.86% and Spectric has recorded at 57.63%. It can be seen that
Quartx has recorded highest profit margin in year 2014. When looking at figures for year 2015, AB
dynamics stood at 32.38%, Quartx has profit margin of 63.61% and Spectric has 57.40%. Looking at
2016 figures, AB dynamics has recorded 30.17%, Quartx has ratio at 60.26% and Spectric gross
margin ratio stood at 56.51%. It is indicated by figures that all companies have downward trend in
relation to their gross margin. Graph depicts that gross profit margin trend of Quartx Plc is better
compared to its competitors.
2014 2015 2016
0.00%
10.00%
20.00%
30.00%
40.00%
50.00%
60.00%
70.00%
80.00%
85.00%
90.00%
95.00%
100.00%
105.00%
110.00%
115.00%
Gross Profit Margin
AB Dynamics Spectric Quartix
AB Trend Quartix Trend Spectric Trend
Net profit margin- Net profit margin recorded in year 2014 for AB dynamics stood at 15.54%,
Quartix recorded 26.30% and Spectris at 11.51%. Looking at figures for year 2015, AB dynamics
recorded 19.65%, Quartix recorded 25.48% and Spextris recorded 9.56%. For year 2016, AB dynamics
recorded net profit margin at 18.93%, Quartix recorded 24.99% and Spectris stood at 0.77%. It is
indicated by graph below that Spectris has maintained stable trend in generating net profit margin.
Therefore, Quartix is generating higher net profit margin compared to other companies.
Paraphrase This Document
Need a fresh take? Get an instant paraphrase of this document with our AI Paraphraser
8ADVANCED FINANCIAL ACCOUNTING
2014 2015 2016
0.00%
5.00%
10.00%
15.00%
20.00%
25.00%
30.00%
0.00%
20.00%
40.00%
60.00%
80.00%
100.00%
120.00%
Net Profit Margin
AB Dynamics Spectric Quartix
AB Trend Quartix Trend Spectric Trend
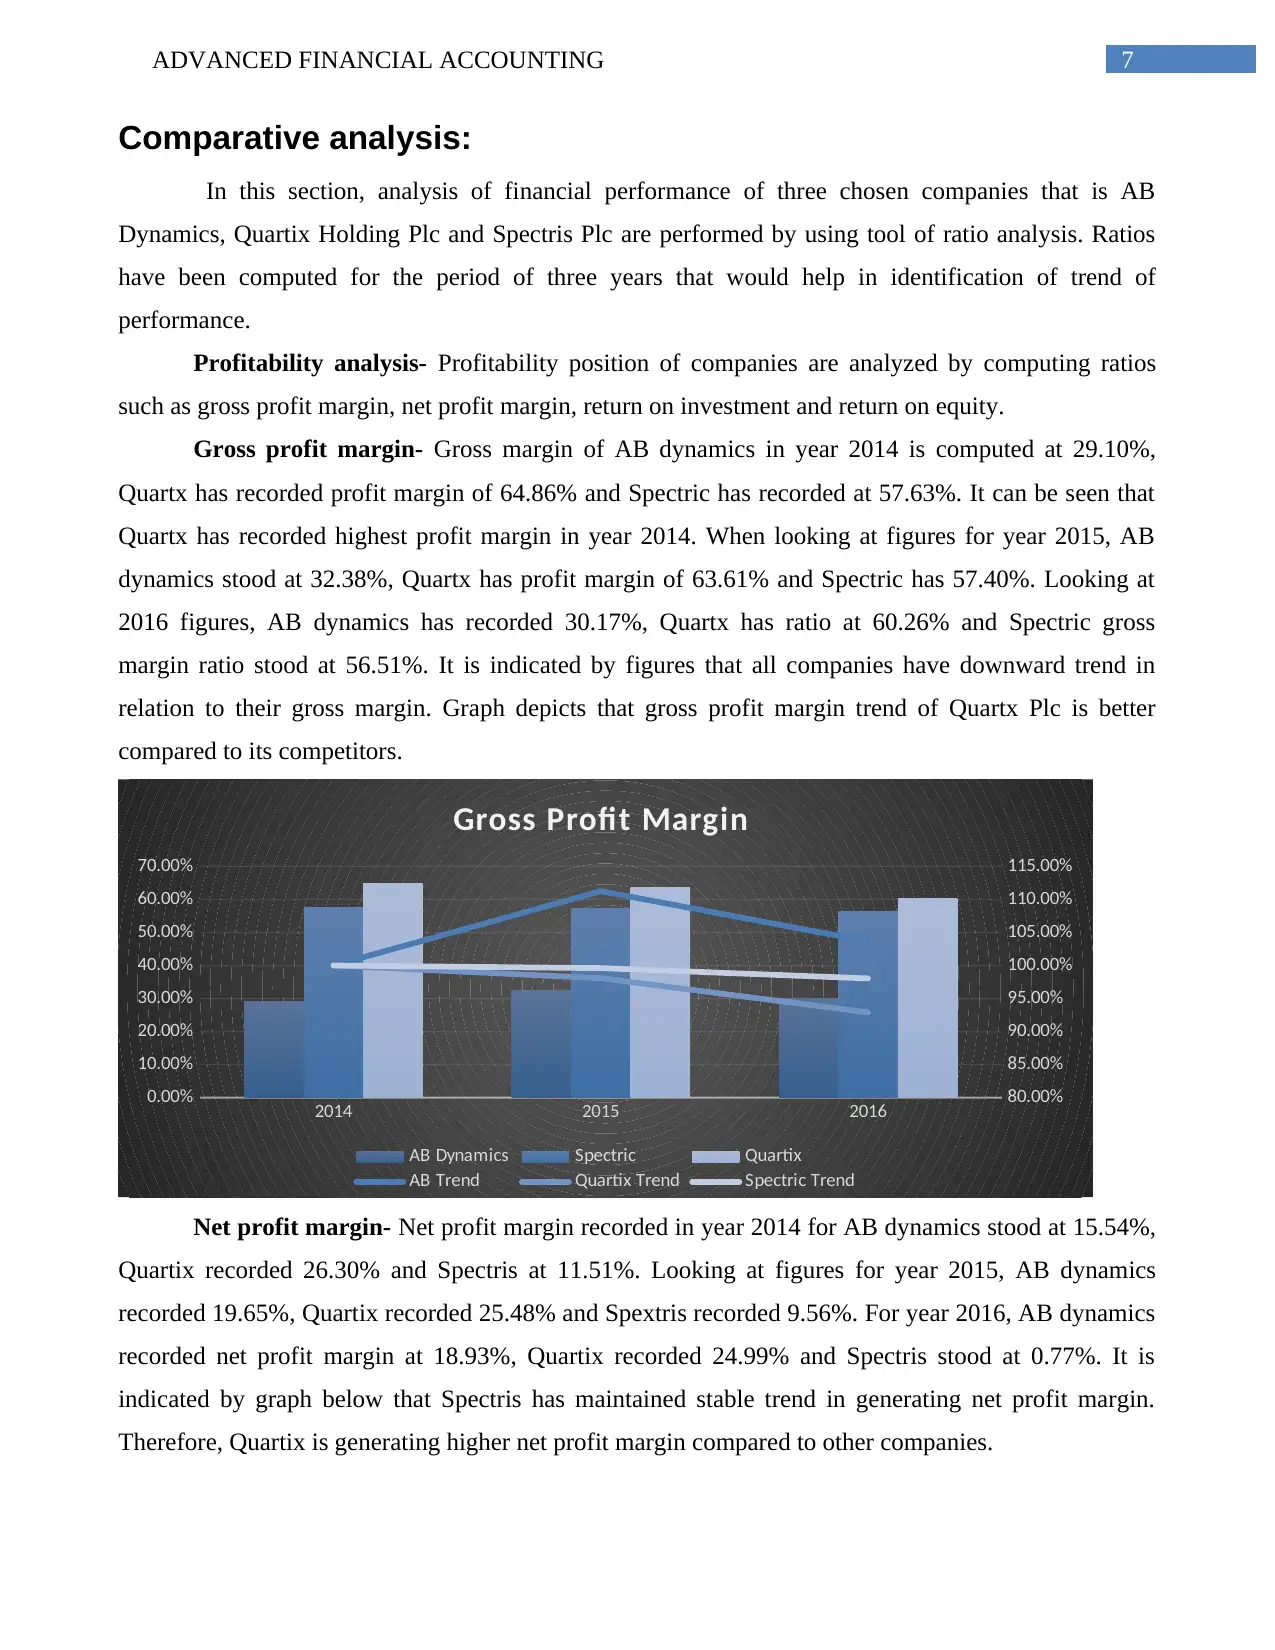
Return on investment (ROI)- Return on investment computed in year 2014 for AB Dynamic
stood at 15.84%, Quartrix at 21.92% and 9.61% for Spectris. When looking at figures for year 2015,
ratio stood at 19.2% for AB Dynamics, 23.12% for Quartrix and 7.8% for Spectris. ROI for year 2017,
stood at 18.16% for AB Dynamics, 24.25% for Quartrix and 0.59% for Spectris. Analysis of figures is
indicative of the fact that Quartix has been experiencing an upward trend in generating return on
investment compared to Spectris that has downward trend. Therefore, Quartix is more efficient in
utilizing their shareholder’s equity for generating profits.
2014 2015 2016
0.00%
5.00%
10.00%
15.00%
20.00%
25.00%
30.00%
0.00%
20.00%
40.00%
60.00%
80.00%
100.00%
120.00%
140.00%
Return on Investment
AB Dynamics Spectric Quartix
AB Trend Quartix Trend Spectric Trend
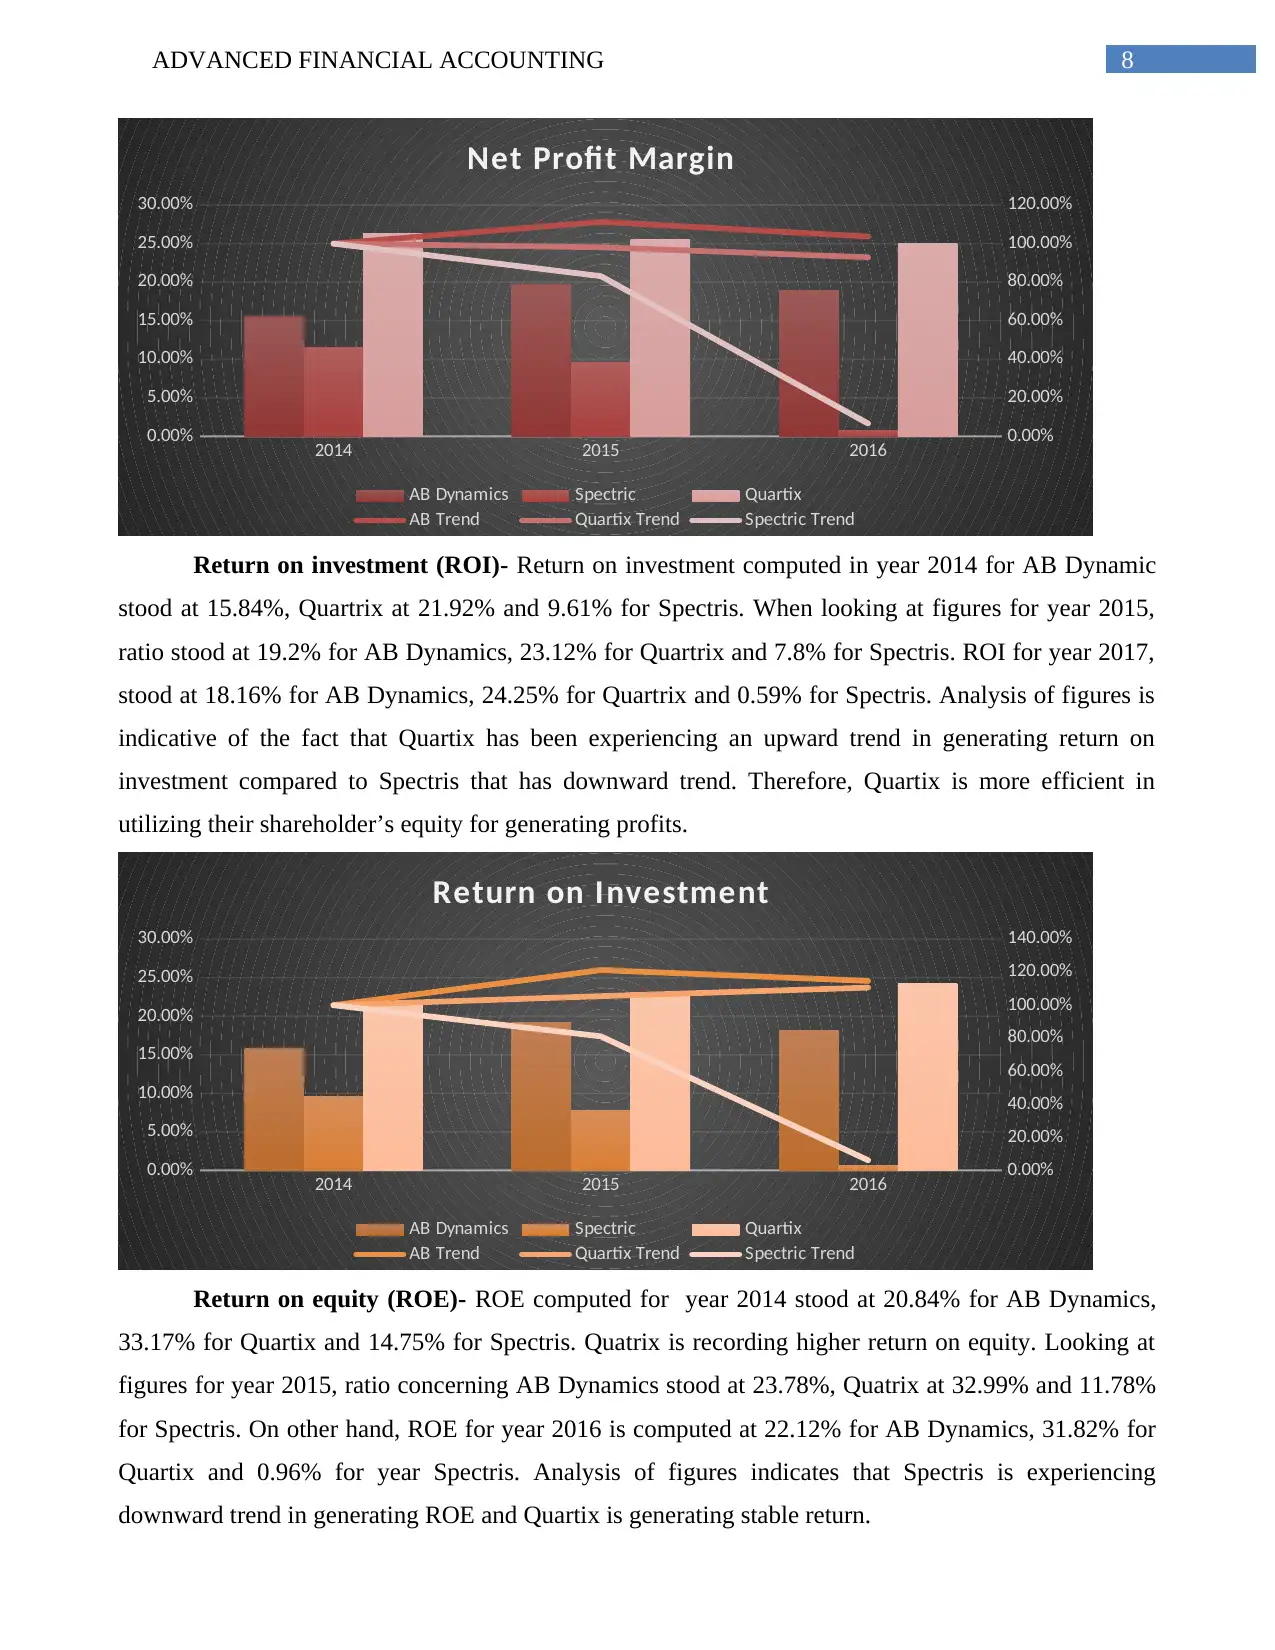
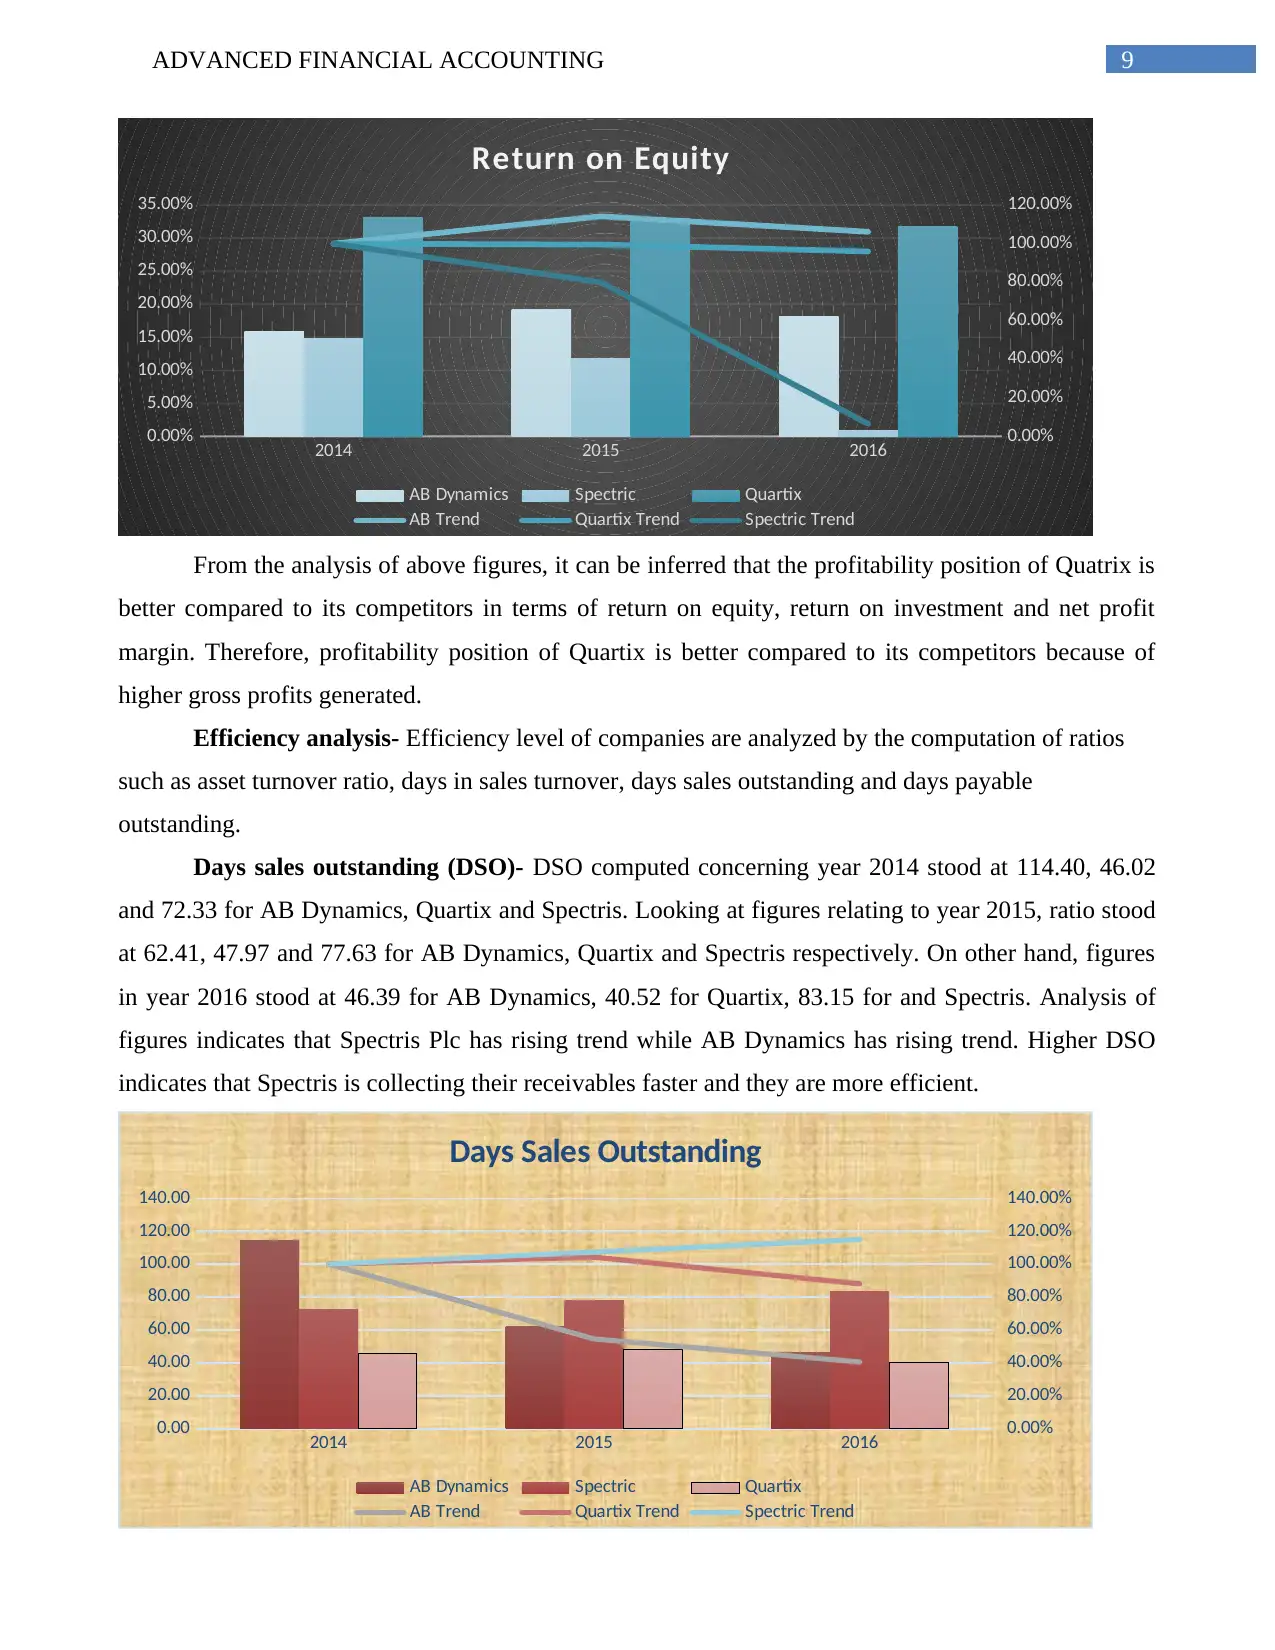
Return on equity (ROE)- ROE computed for year 2014 stood at 20.84% for AB Dynamics,
33.17% for Quartix and 14.75% for Spectris. Quatrix is recording higher return on equity. Looking at
figures for year 2015, ratio concerning AB Dynamics stood at 23.78%, Quatrix at 32.99% and 11.78%
for Spectris. On other hand, ROE for year 2016 is computed at 22.12% for AB Dynamics, 31.82% for
Quartix and 0.96% for year Spectris. Analysis of figures indicates that Spectris is experiencing
downward trend in generating ROE and Quartix is generating stable return.
2014 2015 2016
0.00%
5.00%
10.00%
15.00%
20.00%
25.00%
30.00%
0.00%
20.00%
40.00%
60.00%
80.00%
100.00%
120.00%
Net Profit Margin
AB Dynamics Spectric Quartix
AB Trend Quartix Trend Spectric Trend
Return on investment (ROI)- Return on investment computed in year 2014 for AB Dynamic
stood at 15.84%, Quartrix at 21.92% and 9.61% for Spectris. When looking at figures for year 2015,
ratio stood at 19.2% for AB Dynamics, 23.12% for Quartrix and 7.8% for Spectris. ROI for year 2017,
stood at 18.16% for AB Dynamics, 24.25% for Quartrix and 0.59% for Spectris. Analysis of figures is
indicative of the fact that Quartix has been experiencing an upward trend in generating return on
investment compared to Spectris that has downward trend. Therefore, Quartix is more efficient in
utilizing their shareholder’s equity for generating profits.
2014 2015 2016
0.00%
5.00%
10.00%
15.00%
20.00%
25.00%
30.00%
0.00%
20.00%
40.00%
60.00%
80.00%
100.00%
120.00%
140.00%
Return on Investment
AB Dynamics Spectric Quartix
AB Trend Quartix Trend Spectric Trend
Return on equity (ROE)- ROE computed for year 2014 stood at 20.84% for AB Dynamics,
33.17% for Quartix and 14.75% for Spectris. Quatrix is recording higher return on equity. Looking at
figures for year 2015, ratio concerning AB Dynamics stood at 23.78%, Quatrix at 32.99% and 11.78%
for Spectris. On other hand, ROE for year 2016 is computed at 22.12% for AB Dynamics, 31.82% for
Quartix and 0.96% for year Spectris. Analysis of figures indicates that Spectris is experiencing
downward trend in generating ROE and Quartix is generating stable return.
9ADVANCED FINANCIAL ACCOUNTING
2014 2015 2016
0.00%
5.00%
10.00%
15.00%
20.00%
25.00%
30.00%
35.00%
0.00%
20.00%
40.00%
60.00%
80.00%
100.00%
120.00%
Return on Equity
AB Dynamics Spectric Quartix
AB Trend Quartix Trend Spectric Trend
From the analysis of above figures, it can be inferred that the profitability position of Quatrix is
better compared to its competitors in terms of return on equity, return on investment and net profit
margin. Therefore, profitability position of Quartix is better compared to its competitors because of
higher gross profits generated.
Efficiency analysis- Efficiency level of companies are analyzed by the computation of ratios
such as asset turnover ratio, days in sales turnover, days sales outstanding and days payable
outstanding.
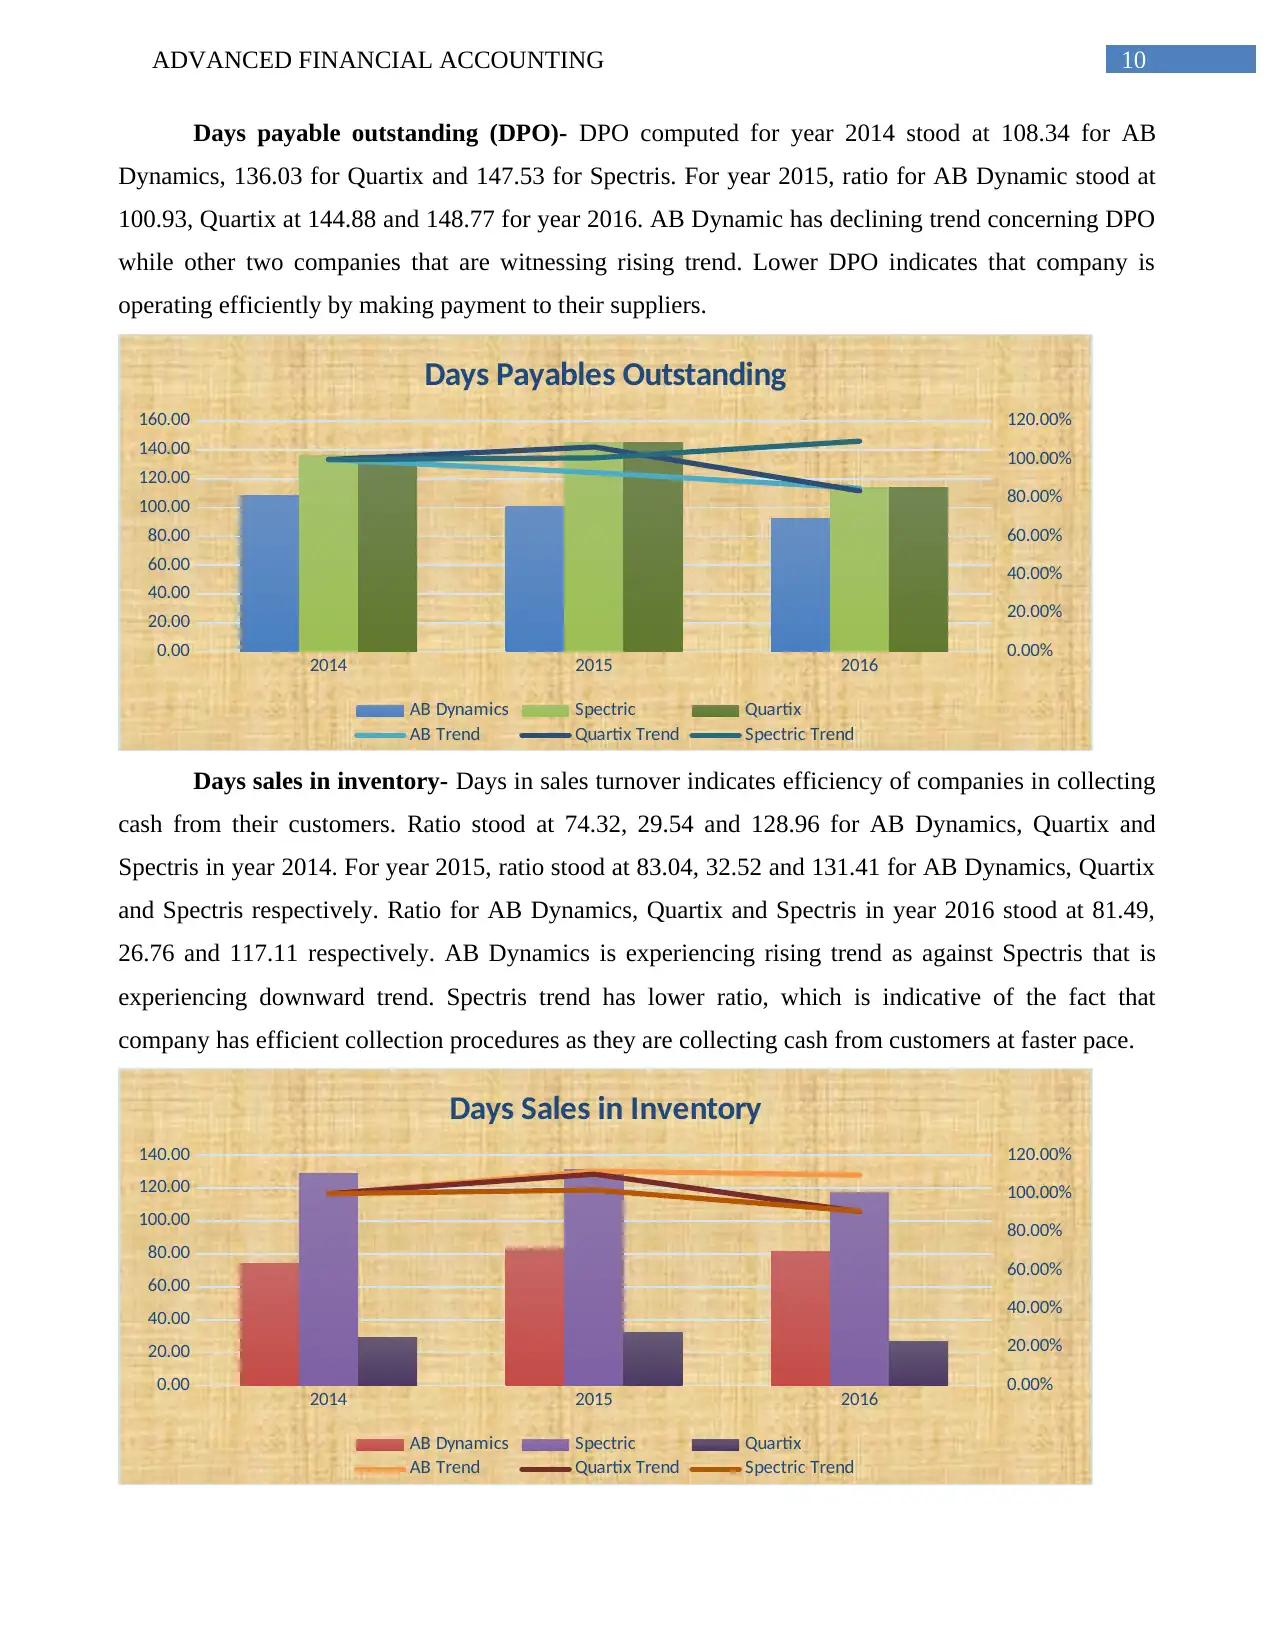
Days sales outstanding (DSO)- DSO computed concerning year 2014 stood at 114.40, 46.02
and 72.33 for AB Dynamics, Quartix and Spectris. Looking at figures relating to year 2015, ratio stood
at 62.41, 47.97 and 77.63 for AB Dynamics, Quartix and Spectris respectively. On other hand, figures
in year 2016 stood at 46.39 for AB Dynamics, 40.52 for Quartix, 83.15 for and Spectris. Analysis of
figures indicates that Spectris Plc has rising trend while AB Dynamics has rising trend. Higher DSO
indicates that Spectris is collecting their receivables faster and they are more efficient.
2014 2015 2016
0.00
20.00
40.00
60.00
80.00
100.00
120.00
140.00
0.00%
20.00%
40.00%
60.00%
80.00%
100.00%
120.00%
140.00%
Days Sales Outstanding
AB Dynamics Spectric Quartix
AB Trend Quartix Trend Spectric Trend
2014 2015 2016
0.00%
5.00%
10.00%
15.00%
20.00%
25.00%
30.00%
35.00%
0.00%
20.00%
40.00%
60.00%
80.00%
100.00%
120.00%
Return on Equity
AB Dynamics Spectric Quartix
AB Trend Quartix Trend Spectric Trend
From the analysis of above figures, it can be inferred that the profitability position of Quatrix is
better compared to its competitors in terms of return on equity, return on investment and net profit
margin. Therefore, profitability position of Quartix is better compared to its competitors because of
higher gross profits generated.
Efficiency analysis- Efficiency level of companies are analyzed by the computation of ratios
such as asset turnover ratio, days in sales turnover, days sales outstanding and days payable
outstanding.
Days sales outstanding (DSO)- DSO computed concerning year 2014 stood at 114.40, 46.02
and 72.33 for AB Dynamics, Quartix and Spectris. Looking at figures relating to year 2015, ratio stood
at 62.41, 47.97 and 77.63 for AB Dynamics, Quartix and Spectris respectively. On other hand, figures
in year 2016 stood at 46.39 for AB Dynamics, 40.52 for Quartix, 83.15 for and Spectris. Analysis of
figures indicates that Spectris Plc has rising trend while AB Dynamics has rising trend. Higher DSO
indicates that Spectris is collecting their receivables faster and they are more efficient.
2014 2015 2016
0.00
20.00
40.00
60.00
80.00
100.00
120.00
140.00
0.00%
20.00%
40.00%
60.00%
80.00%
100.00%
120.00%
140.00%
Days Sales Outstanding
AB Dynamics Spectric Quartix
AB Trend Quartix Trend Spectric Trend
⊘ This is a preview!⊘
Do you want full access?
Subscribe today to unlock all pages.
Trusted by 1+ million students worldwide
10ADVANCED FINANCIAL ACCOUNTING
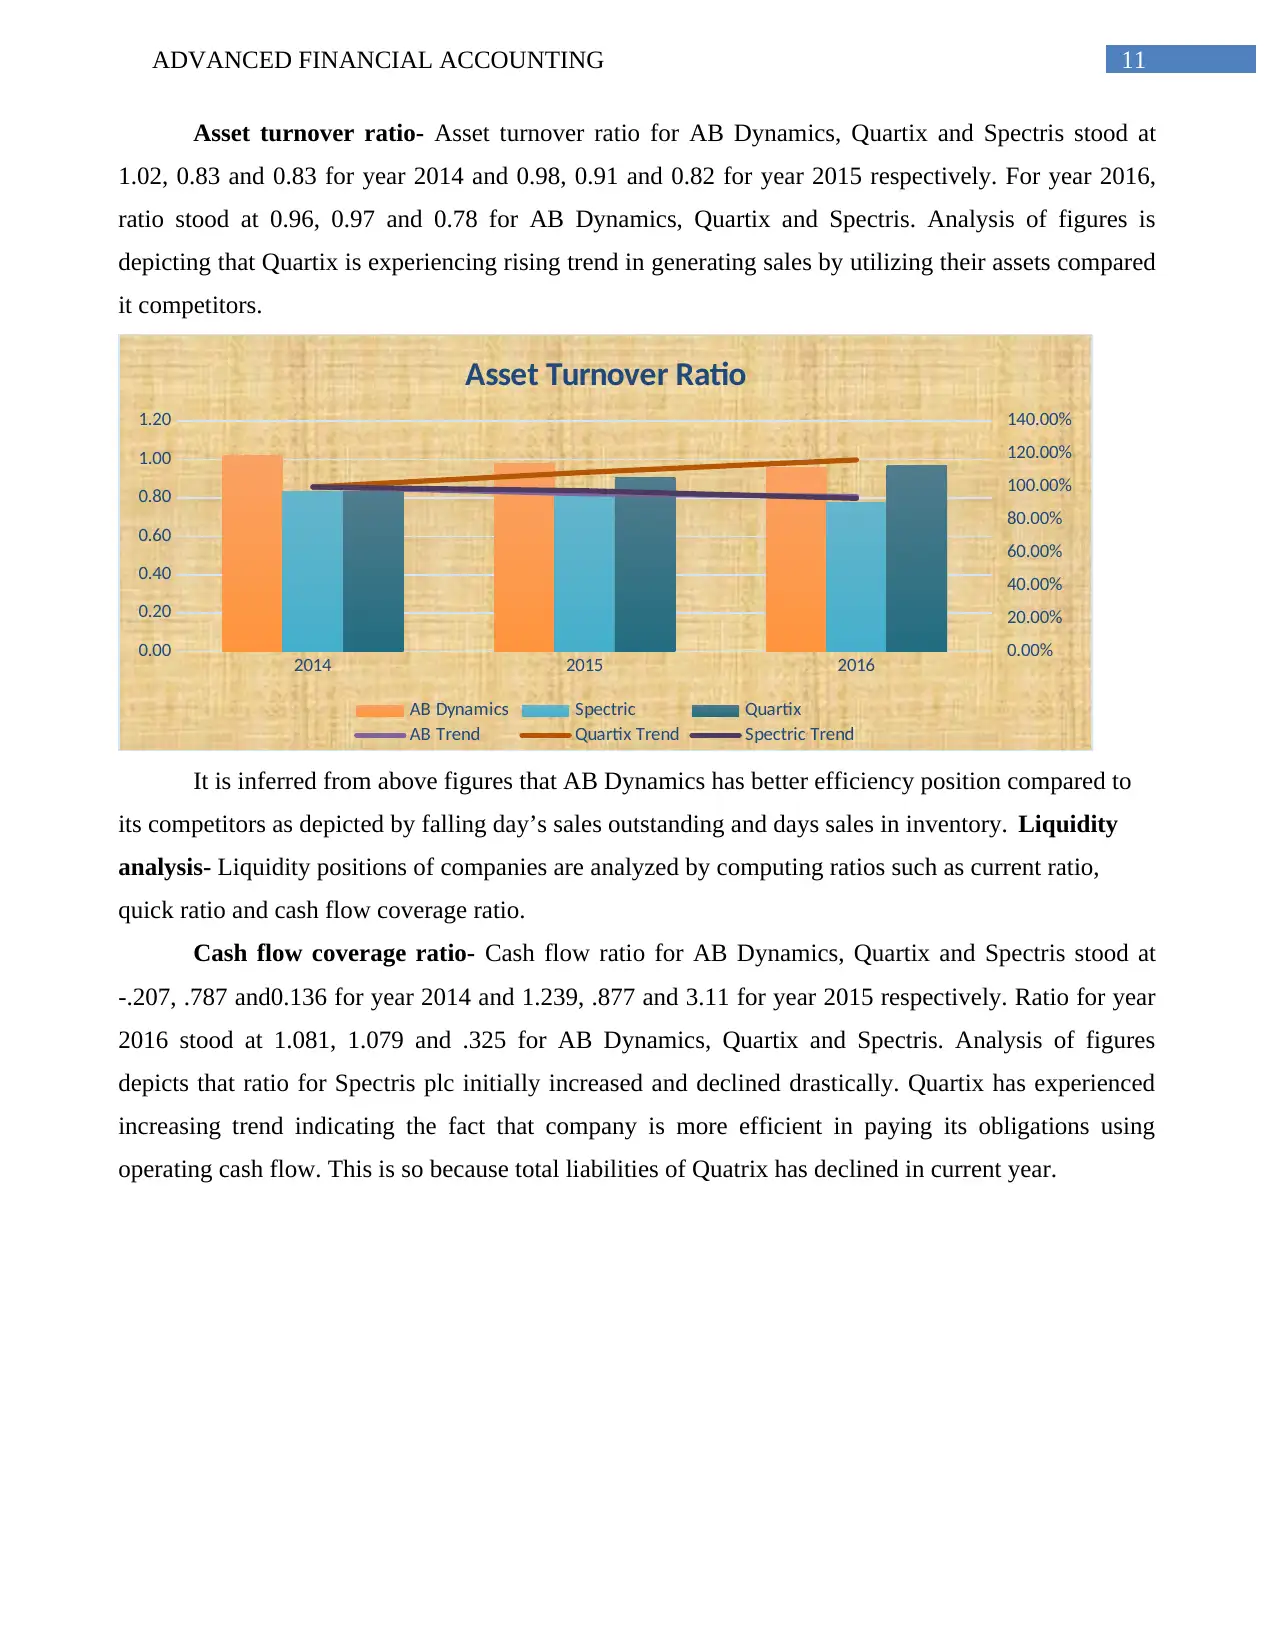
Days payable outstanding (DPO)- DPO computed for year 2014 stood at 108.34 for AB
Dynamics, 136.03 for Quartix and 147.53 for Spectris. For year 2015, ratio for AB Dynamic stood at
100.93, Quartix at 144.88 and 148.77 for year 2016. AB Dynamic has declining trend concerning DPO
while other two companies that are witnessing rising trend. Lower DPO indicates that company is
operating efficiently by making payment to their suppliers.
2014 2015 2016
0.00
20.00
40.00
60.00
80.00
100.00
120.00
140.00
160.00
0.00%
20.00%
40.00%
60.00%
80.00%
100.00%
120.00%
Days Payables Outstanding
AB Dynamics Spectric Quartix
AB Trend Quartix Trend Spectric Trend
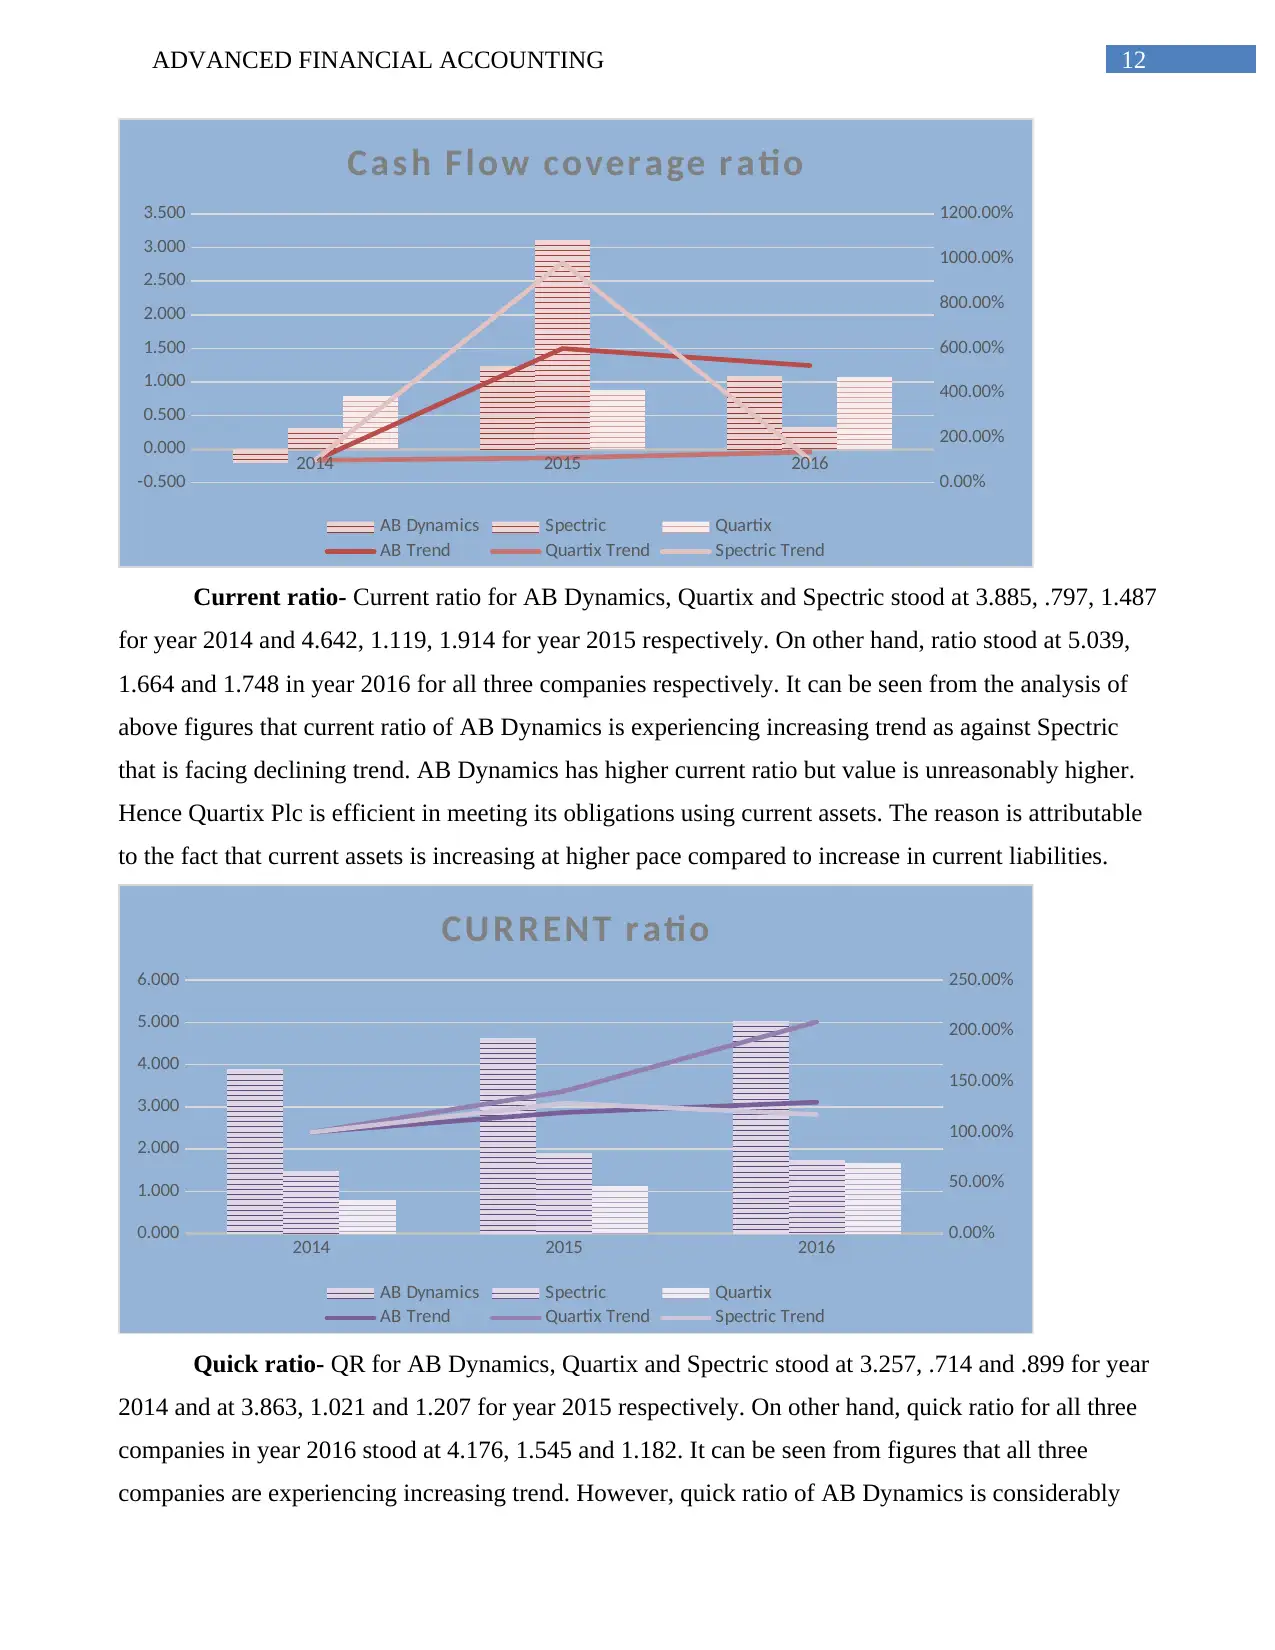
Days sales in inventory- Days in sales turnover indicates efficiency of companies in collecting
cash from their customers. Ratio stood at 74.32, 29.54 and 128.96 for AB Dynamics, Quartix and
Spectris in year 2014. For year 2015, ratio stood at 83.04, 32.52 and 131.41 for AB Dynamics, Quartix
and Spectris respectively. Ratio for AB Dynamics, Quartix and Spectris in year 2016 stood at 81.49,
26.76 and 117.11 respectively. AB Dynamics is experiencing rising trend as against Spectris that is
experiencing downward trend. Spectris trend has lower ratio, which is indicative of the fact that
company has efficient collection procedures as they are collecting cash from customers at faster pace.
2014 2015 2016
0.00
20.00
40.00
60.00
80.00
100.00
120.00
140.00
0.00%
20.00%
40.00%
60.00%
80.00%
100.00%
120.00%
Days Sales in Inventory
AB Dynamics Spectric Quartix
AB Trend Quartix Trend Spectric Trend
Days payable outstanding (DPO)- DPO computed for year 2014 stood at 108.34 for AB
Dynamics, 136.03 for Quartix and 147.53 for Spectris. For year 2015, ratio for AB Dynamic stood at
100.93, Quartix at 144.88 and 148.77 for year 2016. AB Dynamic has declining trend concerning DPO
while other two companies that are witnessing rising trend. Lower DPO indicates that company is
operating efficiently by making payment to their suppliers.
2014 2015 2016
0.00
20.00
40.00
60.00
80.00
100.00
120.00
140.00
160.00
0.00%
20.00%
40.00%
60.00%
80.00%
100.00%
120.00%
Days Payables Outstanding
AB Dynamics Spectric Quartix
AB Trend Quartix Trend Spectric Trend
Days sales in inventory- Days in sales turnover indicates efficiency of companies in collecting
cash from their customers. Ratio stood at 74.32, 29.54 and 128.96 for AB Dynamics, Quartix and
Spectris in year 2014. For year 2015, ratio stood at 83.04, 32.52 and 131.41 for AB Dynamics, Quartix
and Spectris respectively. Ratio for AB Dynamics, Quartix and Spectris in year 2016 stood at 81.49,
26.76 and 117.11 respectively. AB Dynamics is experiencing rising trend as against Spectris that is
experiencing downward trend. Spectris trend has lower ratio, which is indicative of the fact that
company has efficient collection procedures as they are collecting cash from customers at faster pace.
2014 2015 2016
0.00
20.00
40.00
60.00
80.00
100.00
120.00
140.00
0.00%
20.00%
40.00%
60.00%
80.00%
100.00%
120.00%
Days Sales in Inventory
AB Dynamics Spectric Quartix
AB Trend Quartix Trend Spectric Trend
Paraphrase This Document
Need a fresh take? Get an instant paraphrase of this document with our AI Paraphraser
11ADVANCED FINANCIAL ACCOUNTING
Asset turnover ratio- Asset turnover ratio for AB Dynamics, Quartix and Spectris stood at
1.02, 0.83 and 0.83 for year 2014 and 0.98, 0.91 and 0.82 for year 2015 respectively. For year 2016,
ratio stood at 0.96, 0.97 and 0.78 for AB Dynamics, Quartix and Spectris. Analysis of figures is
depicting that Quartix is experiencing rising trend in generating sales by utilizing their assets compared
it competitors.
2014 2015 2016
0.00
0.20
0.40
0.60
0.80
1.00
1.20
0.00%
20.00%
40.00%
60.00%
80.00%
100.00%
120.00%
140.00%
Asset Turnover Ratio
AB Dynamics Spectric Quartix
AB Trend Quartix Trend Spectric Trend
It is inferred from above figures that AB Dynamics has better efficiency position compared to
its competitors as depicted by falling day’s sales outstanding and days sales in inventory. Liquidity
analysis- Liquidity positions of companies are analyzed by computing ratios such as current ratio,
quick ratio and cash flow coverage ratio.
Cash flow coverage ratio- Cash flow ratio for AB Dynamics, Quartix and Spectris stood at
-.207, .787 and0.136 for year 2014 and 1.239, .877 and 3.11 for year 2015 respectively. Ratio for year
2016 stood at 1.081, 1.079 and .325 for AB Dynamics, Quartix and Spectris. Analysis of figures
depicts that ratio for Spectris plc initially increased and declined drastically. Quartix has experienced
increasing trend indicating the fact that company is more efficient in paying its obligations using
operating cash flow. This is so because total liabilities of Quatrix has declined in current year.
12ADVANCED FINANCIAL ACCOUNTING
2014 2015 2016
-0.500
0.000
0.500
1.000
1.500
2.000
2.500
3.000
3.500
0.00%
200.00%
400.00%
600.00%
800.00%
1000.00%
1200.00%
Cash Flow coverage r atio
AB Dynamics Spectric Quartix
AB Trend Quartix Trend Spectric Trend
Current ratio- Current ratio for AB Dynamics, Quartix and Spectric stood at 3.885, .797, 1.487
for year 2014 and 4.642, 1.119, 1.914 for year 2015 respectively. On other hand, ratio stood at 5.039,
1.664 and 1.748 in year 2016 for all three companies respectively. It can be seen from the analysis of
above figures that current ratio of AB Dynamics is experiencing increasing trend as against Spectric
that is facing declining trend. AB Dynamics has higher current ratio but value is unreasonably higher.
Hence Quartix Plc is efficient in meeting its obligations using current assets. The reason is attributable
to the fact that current assets is increasing at higher pace compared to increase in current liabilities.
2014 2015 2016
0.000
1.000
2.000
3.000
4.000
5.000
6.000
0.00%
50.00%
100.00%
150.00%
200.00%
250.00%
CUR RENT r atio
AB Dynamics Spectric Quartix
AB Trend Quartix Trend Spectric Trend
Quick ratio- QR for AB Dynamics, Quartix and Spectric stood at 3.257, .714 and .899 for year
2014 and at 3.863, 1.021 and 1.207 for year 2015 respectively. On other hand, quick ratio for all three
companies in year 2016 stood at 4.176, 1.545 and 1.182. It can be seen from figures that all three
companies are experiencing increasing trend. However, quick ratio of AB Dynamics is considerably
2014 2015 2016
-0.500
0.000
0.500
1.000
1.500
2.000
2.500
3.000
3.500
0.00%
200.00%
400.00%
600.00%
800.00%
1000.00%
1200.00%
Cash Flow coverage r atio
AB Dynamics Spectric Quartix
AB Trend Quartix Trend Spectric Trend
Current ratio- Current ratio for AB Dynamics, Quartix and Spectric stood at 3.885, .797, 1.487
for year 2014 and 4.642, 1.119, 1.914 for year 2015 respectively. On other hand, ratio stood at 5.039,
1.664 and 1.748 in year 2016 for all three companies respectively. It can be seen from the analysis of
above figures that current ratio of AB Dynamics is experiencing increasing trend as against Spectric
that is facing declining trend. AB Dynamics has higher current ratio but value is unreasonably higher.
Hence Quartix Plc is efficient in meeting its obligations using current assets. The reason is attributable
to the fact that current assets is increasing at higher pace compared to increase in current liabilities.
2014 2015 2016
0.000
1.000
2.000
3.000
4.000
5.000
6.000
0.00%
50.00%
100.00%
150.00%
200.00%
250.00%
CUR RENT r atio
AB Dynamics Spectric Quartix
AB Trend Quartix Trend Spectric Trend
Quick ratio- QR for AB Dynamics, Quartix and Spectric stood at 3.257, .714 and .899 for year
2014 and at 3.863, 1.021 and 1.207 for year 2015 respectively. On other hand, quick ratio for all three
companies in year 2016 stood at 4.176, 1.545 and 1.182. It can be seen from figures that all three
companies are experiencing increasing trend. However, quick ratio of AB Dynamics is considerably
⊘ This is a preview!⊘
Do you want full access?
Subscribe today to unlock all pages.
Trusted by 1+ million students worldwide
1 out of 27
Related Documents


Your All-in-One AI-Powered Toolkit for Academic Success.
+13062052269
info@desklib.com
Available 24*7 on WhatsApp / Email
![[object Object]](/_next/static/media/star-bottom.7253800d.svg)
Unlock your academic potential
Copyright © 2020–2026 A2Z Services. All Rights Reserved. Developed and managed by ZUCOL.