Blood Metabolite Analysis of Spectrophotometric Lactate Assay Report
VerifiedAdded on 2022/08/10
|10
|2272
|462
Report
AI Summary
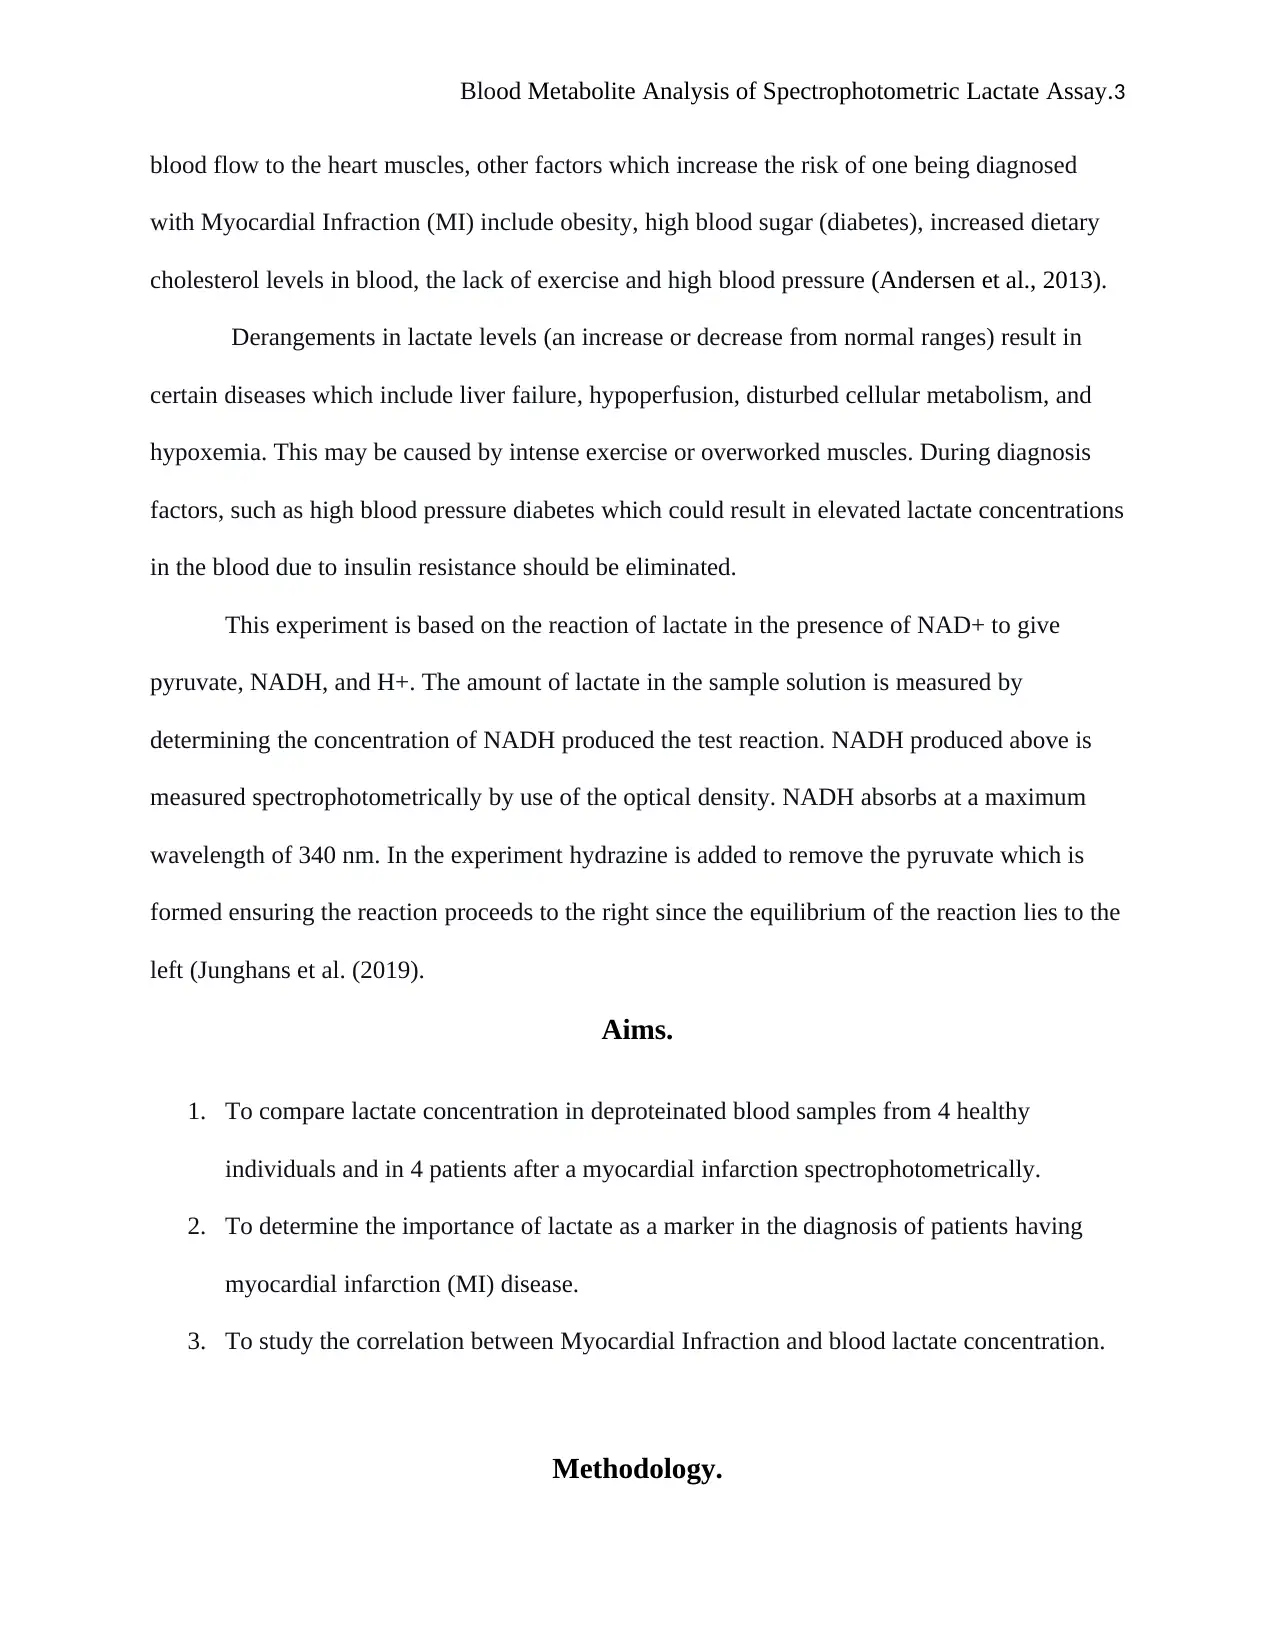
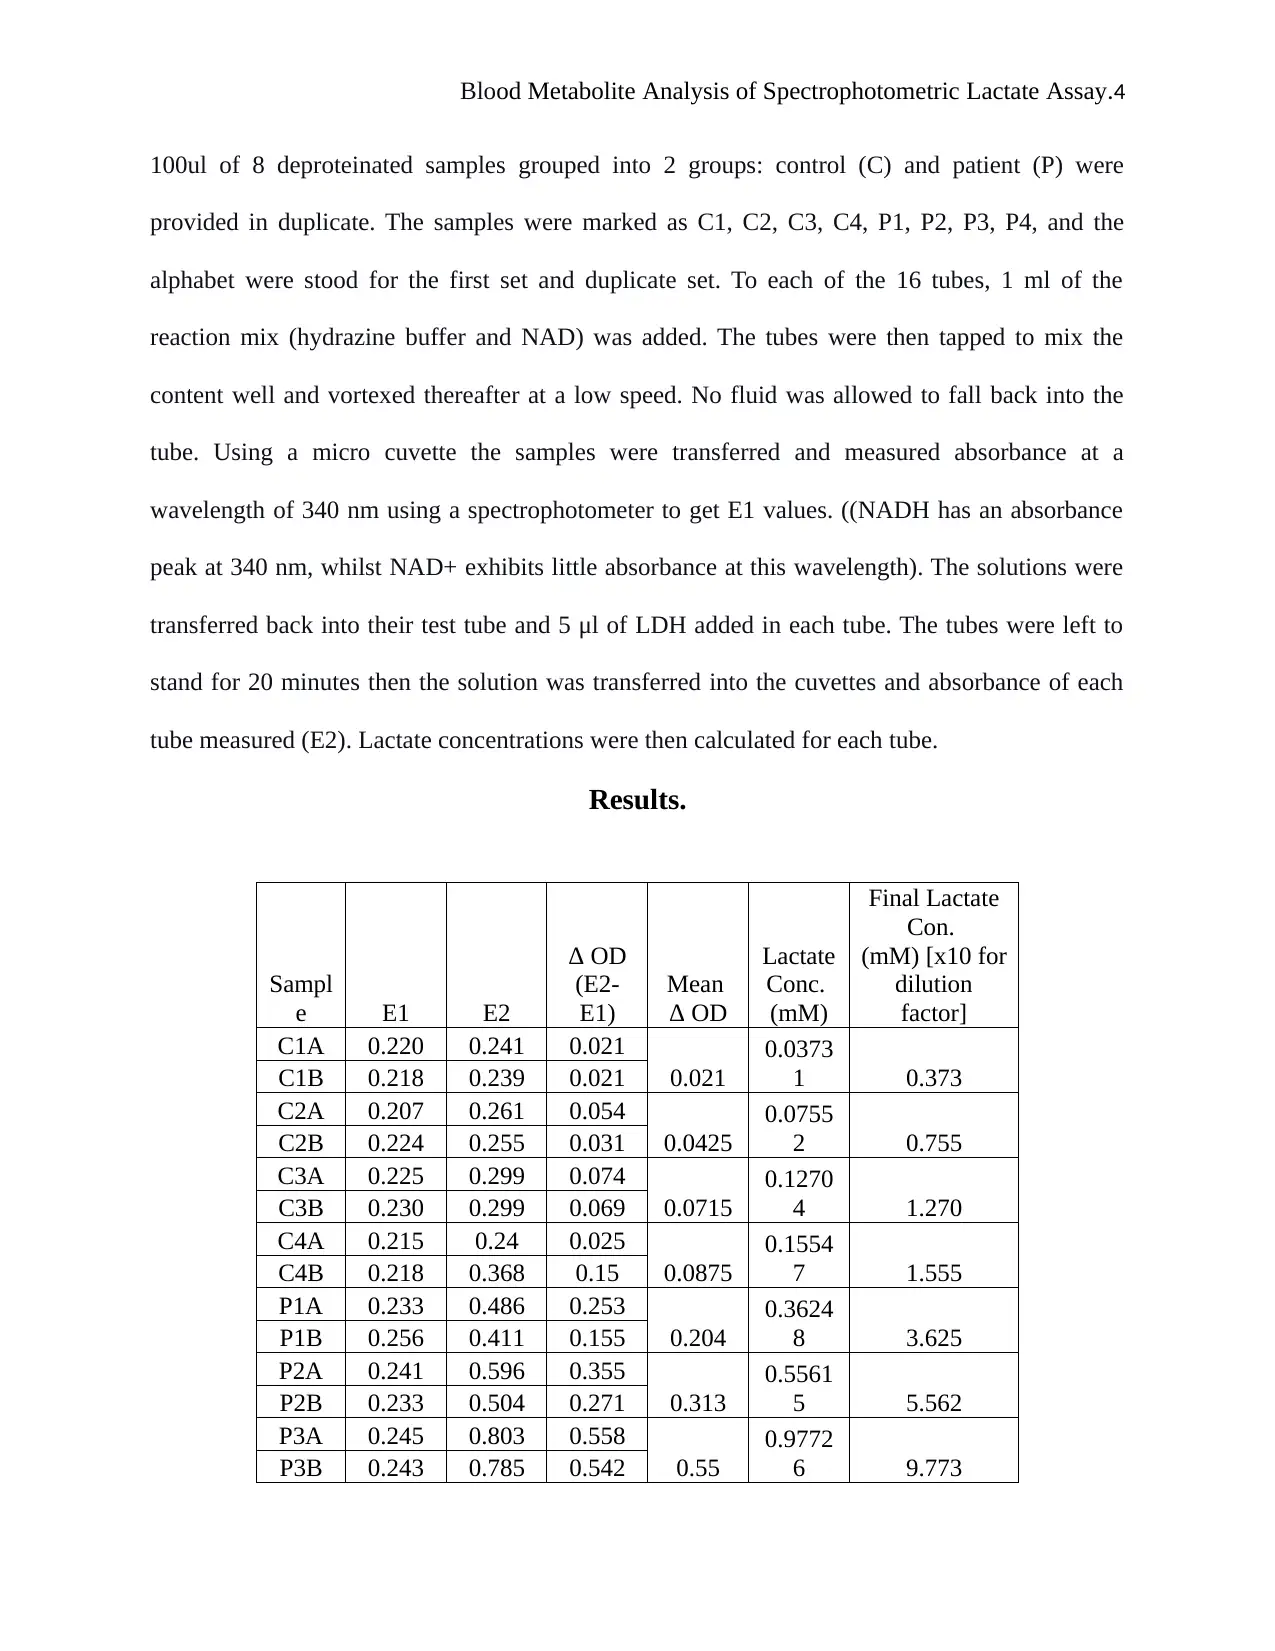
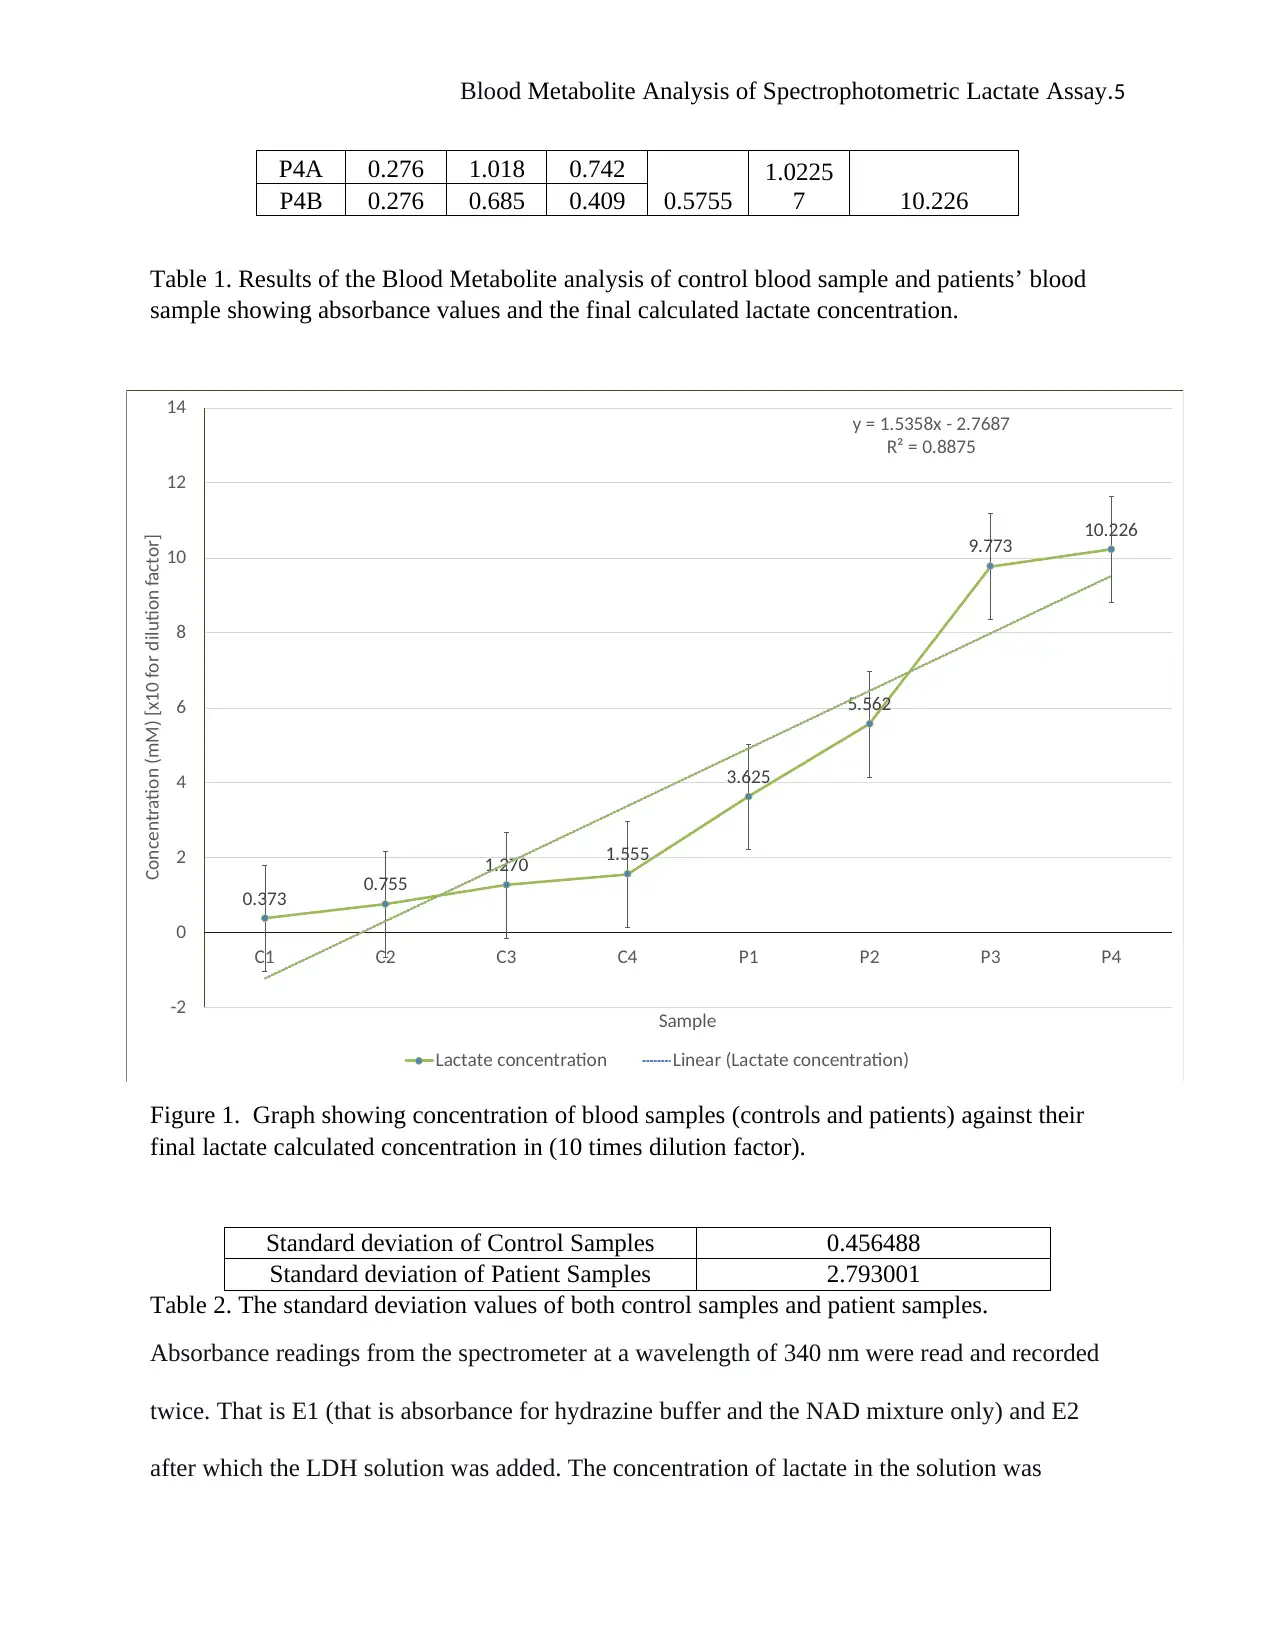
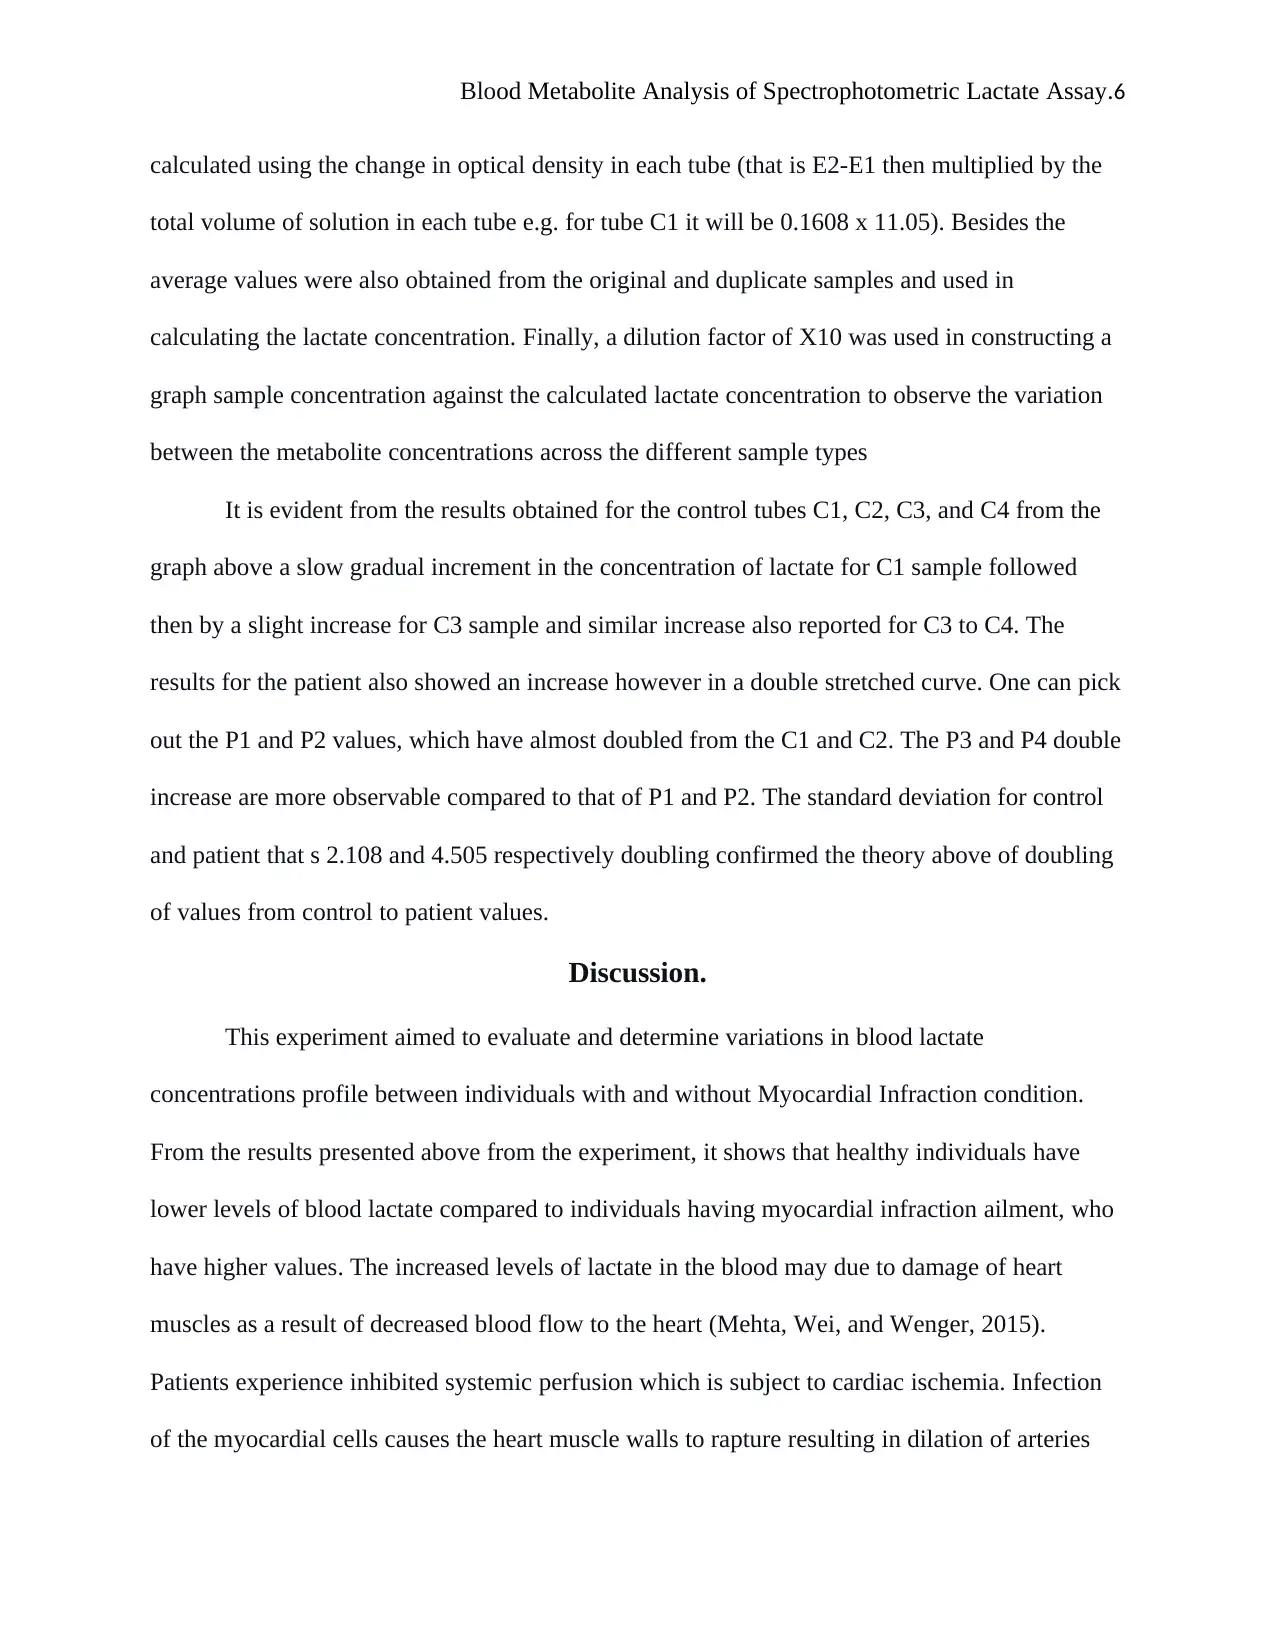
This report presents an analysis of blood lactate levels using a spectrophotometric assay to compare lactate concentrations in deproteinated blood samples from healthy individuals and patients with myocardial infarction (MI). The study aims to determine the significance of lactate as a marker for MI diagnosis and investigate its correlation with the disease. The methodology involves measuring absorbance at 340 nm to determine NADH concentration, which is produced in proportion to lactate levels. Results reveal significantly higher lactate concentrations in MI patients compared to healthy controls, supporting the hypothesis that elevated lactate levels are indicative of myocardial damage and reduced blood flow. The discussion highlights the impact of factors like diabetes and high blood pressure on lactate levels and the use of Lactate Dehydrogenase (LDH) to validate the findings. The conclusion confirms the success of the experiment in differentiating lactate levels between the two groups, emphasizing the efficiency of blood sample analysis in this context. The report also references relevant studies and methods for lactate measurement.
Contribute Materials
Your contribution can guide someone’s learning journey. Share your
documents today.

Blood Metabolite Analysis of Spectrophotometric Lactate Assay.1
BLOOD METABOLITE ANALYSIS OF SPECTROPHOTOMETRIC LACTATE ASSAY.
By Student’s Name
Code + Course Name
Professor’s Name
University Name
City, State
Date
BLOOD METABOLITE ANALYSIS OF SPECTROPHOTOMETRIC LACTATE ASSAY.
By Student’s Name
Code + Course Name
Professor’s Name
University Name
City, State
Date
Secure Best Marks with AI Grader
Need help grading? Try our AI Grader for instant feedback on your assignments.

Blood Metabolite Analysis of Spectrophotometric Lactate Assay.2
Introduction
Laboratory tests, which involve measurement of blood lactate levels are important in
clinical settings especially in the diagnosis of Myocardial infarction. This is because an increase
in lactate concentration in blood is an evidence of decreased systemic blood flow, which is a
characteristic of myocardial infarction. In a study which was done recently by USA Department
of Public Health, that measured lactic acid in human veins showed that the most prevalent and
reliable clinical sign by patients with myocardial infarction is a rapid rise in blood lactate levels
(Shimojo et al., 2011). This transpired a recommendation by (Li et al., 2011) on the use of blood
lactate levels as a molecular marker in the diagnosis of cardiogenic shock. Therefore lactate, as a
blood metabolite will be found elevated in patients with clinical signs of myocardial infarction.
The main objective of this lab analysis is modeling and understanding the lactate concentration
profile in blood samples from patients with myocardial infarction in comparison to a
deproteinated blood sample from normal healthy persons. Lactate in the body is formed through
fermentation, as cells breakdown glucose in the absence of molecular oxygen to yield energy.
Glucose is converted to pyruvate, which is then reduced to lactate with the action of enzyme
lactate dehydrogenase. The lactate formed is utilized by other body tissues including heart
muscle as a source of fuel when it's further oxidized (Li et al. (2011).
Myocardial infarction (MI) is the clinical name for heart attack. Heart attack which
brought up due to reduced blood flow to the heart as a consequence of prolonged ischemia and
myocardial cell death. The stoppage or decreased blood flow to heart muscles can cause heart
muscle and tissue damage in server cases (Thygesen, Alpert and White, 2007). Myocardial
infarction is associated with the following clinical signs: chest pains and congestions
(discomfort). Myocardial (MI) infarction has been thought to be a lifetime chronic ailment that
could lead to heart failure and death (Thygesen, Alpert and White, 2007). Apart from reduced

Blood Metabolite Analysis of Spectrophotometric Lactate Assay.3
blood flow to the heart muscles, other factors which increase the risk of one being diagnosed
with Myocardial Infraction (MI) include obesity, high blood sugar (diabetes), increased dietary
cholesterol levels in blood, the lack of exercise and high blood pressure (Andersen et al., 2013).
Derangements in lactate levels (an increase or decrease from normal ranges) result in
certain diseases which include liver failure, hypoperfusion, disturbed cellular metabolism, and
hypoxemia. This may be caused by intense exercise or overworked muscles. During diagnosis
factors, such as high blood pressure diabetes which could result in elevated lactate concentrations
in the blood due to insulin resistance should be eliminated.
This experiment is based on the reaction of lactate in the presence of NAD+ to give
pyruvate, NADH, and H+. The amount of lactate in the sample solution is measured by
determining the concentration of NADH produced the test reaction. NADH produced above is
measured spectrophotometrically by use of the optical density. NADH absorbs at a maximum
wavelength of 340 nm. In the experiment hydrazine is added to remove the pyruvate which is
formed ensuring the reaction proceeds to the right since the equilibrium of the reaction lies to the
left (Junghans et al. (2019).
Aims.
1. To compare lactate concentration in deproteinated blood samples from 4 healthy
individuals and in 4 patients after a myocardial infarction spectrophotometrically.
2. To determine the importance of lactate as a marker in the diagnosis of patients having
myocardial infarction (MI) disease.
3. To study the correlation between Myocardial Infraction and blood lactate concentration.
Methodology.

Blood Metabolite Analysis of Spectrophotometric Lactate Assay.4
100ul of 8 deproteinated samples grouped into 2 groups: control (C) and patient (P) were
provided in duplicate. The samples were marked as C1, C2, C3, C4, P1, P2, P3, P4, and the
alphabet were stood for the first set and duplicate set. To each of the 16 tubes, 1 ml of the
reaction mix (hydrazine buffer and NAD) was added. The tubes were then tapped to mix the
content well and vortexed thereafter at a low speed. No fluid was allowed to fall back into the
tube. Using a micro cuvette the samples were transferred and measured absorbance at a
wavelength of 340 nm using a spectrophotometer to get E1 values. ((NADH has an absorbance
peak at 340 nm, whilst NAD+ exhibits little absorbance at this wavelength). The solutions were
transferred back into their test tube and 5 μl of LDH added in each tube. The tubes were left to
stand for 20 minutes then the solution was transferred into the cuvettes and absorbance of each
tube measured (E2). Lactate concentrations were then calculated for each tube.
Results.
Sampl
e E1 E2
Δ OD
(E2-
E1)
Mean
Δ OD
Lactate
Conc.
(mM)
Final Lactate
Con.
(mM) [x10 for
dilution
factor]
C1A 0.220 0.241 0.021
0.021
0.0373
1 0.373C1B 0.218 0.239 0.021
C2A 0.207 0.261 0.054
0.0425
0.0755
2 0.755C2B 0.224 0.255 0.031
C3A 0.225 0.299 0.074
0.0715
0.1270
4 1.270C3B 0.230 0.299 0.069
C4A 0.215 0.24 0.025
0.0875
0.1554
7 1.555C4B 0.218 0.368 0.15
P1A 0.233 0.486 0.253
0.204
0.3624
8 3.625P1B 0.256 0.411 0.155
P2A 0.241 0.596 0.355
0.313
0.5561
5 5.562P2B 0.233 0.504 0.271
P3A 0.245 0.803 0.558
0.55
0.9772
6 9.773P3B 0.243 0.785 0.542
Secure Best Marks with AI Grader
Need help grading? Try our AI Grader for instant feedback on your assignments.

Blood Metabolite Analysis of Spectrophotometric Lactate Assay.5
P4A 0.276 1.018 0.742
0.5755
1.0225
7 10.226P4B 0.276 0.685 0.409
Table 1. Results of the Blood Metabolite analysis of control blood sample and patients’ blood
sample showing absorbance values and the final calculated lactate concentration.
0.373 0.755 1.270 1.555
3.625
5.562
9.773 10.226
y = 1.5358x - 2.7687
R² = 0.8875
-2
0
2
4
6
8
10
12
14
C1 C2 C3 C4 P1 P2 P3 P4
Concentration (mM) [x10 for dilution factor]
Sample
Lactate concentration Linear (Lactate concentration)
Figure 1. Graph showing concentration of blood samples (controls and patients) against their
final lactate calculated concentration in (10 times dilution factor).
Standard deviation of Control Samples 0.456488
Standard deviation of Patient Samples 2.793001
Table 2. The standard deviation values of both control samples and patient samples.
Absorbance readings from the spectrometer at a wavelength of 340 nm were read and recorded
twice. That is E1 (that is absorbance for hydrazine buffer and the NAD mixture only) and E2
after which the LDH solution was added. The concentration of lactate in the solution was

Blood Metabolite Analysis of Spectrophotometric Lactate Assay.6
calculated using the change in optical density in each tube (that is E2-E1 then multiplied by the
total volume of solution in each tube e.g. for tube C1 it will be 0.1608 x 11.05). Besides the
average values were also obtained from the original and duplicate samples and used in
calculating the lactate concentration. Finally, a dilution factor of X10 was used in constructing a
graph sample concentration against the calculated lactate concentration to observe the variation
between the metabolite concentrations across the different sample types
It is evident from the results obtained for the control tubes C1, C2, C3, and C4 from the
graph above a slow gradual increment in the concentration of lactate for C1 sample followed
then by a slight increase for C3 sample and similar increase also reported for C3 to C4. The
results for the patient also showed an increase however in a double stretched curve. One can pick
out the P1 and P2 values, which have almost doubled from the C1 and C2. The P3 and P4 double
increase are more observable compared to that of P1 and P2. The standard deviation for control
and patient that s 2.108 and 4.505 respectively doubling confirmed the theory above of doubling
of values from control to patient values.
Discussion.
This experiment aimed to evaluate and determine variations in blood lactate
concentrations profile between individuals with and without Myocardial Infraction condition.
From the results presented above from the experiment, it shows that healthy individuals have
lower levels of blood lactate compared to individuals having myocardial infraction ailment, who
have higher values. The increased levels of lactate in the blood may due to damage of heart
muscles as a result of decreased blood flow to the heart (Mehta, Wei, and Wenger, 2015).
Patients experience inhibited systemic perfusion which is subject to cardiac ischemia. Infection
of the myocardial cells causes the heart muscle walls to rapture resulting in dilation of arteries

Blood Metabolite Analysis of Spectrophotometric Lactate Assay.7
and arterioles of the heart. Transport of Lactate from other body parts is inhibited as a result of a
reduction in blood flow hence an accumulation or increase in concentration in blood.
Accumulation of lactic result in a condition known as lactic (Goodwin et al., 2007)
To show how the other secondary factors (e.g. diabetes and high blood pressure) that are
associated with myocardial infarction could also cause an increase in lactate levels in the blood,
Lactate Dehydrogenase (LDH) was added to the test mixture. The graph shown in the figure
shows an increase in lactate levels in patients with Myocardial Infarction. The concentration of
lactate is seen to double when lactate dehydrogenase is added into the test solutions. Lactate
dehydrogenase levels indicate higher levels of glucose and blood pressure. Based on this one can
conclude that higher levels of glucose in the blood and increased blood pressure result in
increased blood lactate concentration (Jaiswar et al., 2011)
Results obtained above, support the hypothesis that individuals with myocardial
infarction have a higher concentration of blood lactate to its entirety. This evident and is
confirmed by the data in this experiment which is prepared in duplicate. Both the experimental
and duplicate sets of results showed great variability in lactate levels between the two groups.
This confirmation by the duplicate data validates our results, making them reliable. This also
ensured that data collected in the experiment is maintained in a linear plot rather than having
presumptive conclusions.
Using a blood sample to measure the lactate level is efficient and reliable. This procedure
provided data to compare with and blood samples are taken and recorded within a time frame of
12 hours. Other methods like using test stipe are recommended in determining blood lactate
concentration. One can also use the lactase oxidase method which also determines lactate levels
Paraphrase This Document
Need a fresh take? Get an instant paraphrase of this document with our AI Paraphraser

Blood Metabolite Analysis of Spectrophotometric Lactate Assay.8
in comparison to lactate dehydrogenase. This method relatively cheaper and faster compared to
the other methods.
Conclusion.
In conclusion, the experiment was a success, as absorbance readings of individual blood samples
were obtained and used to plot a curve. Results obtained support the hypothesis that individuals
with Myocardial Infraction (MI) have higher lactate levels than those who are normally healthy.

Blood Metabolite Analysis of Spectrophotometric Lactate Assay.9
References
Andersen, L., Mackenhauer, J., Roberts, J., Berg, K., Cocchi, M. and Donnino, M. (2013).
Etiology and Therapeutic Approach to Elevated Lactate Levels. Mayo Clinic Proceedings,
88(10), pp.1127-1140.
Goodwin, M., Harris, J., Hernández, A. and Gladden, L. (2007). Blood Lactate Measurements
and Analysis during Exercise: A Guide for Clinicians. Journal of Diabetes Science and
Technology, 1(4), pp.558-569.
Jaiswar, S., Gupta, A., Sachan, R., Natu, S. and Shaili, M. (2011). Lactic Dehydrogenase: A
Biochemical Marker for Preeclampsia–Eclampsia. The Journal of Obstetrics and Gynecology of
India, 61(6), pp.645-648.
Junghans, L., Teleki, A., Wijaya, A., Becker, M., Schweikert, M. and Takors, R. (2019). From
nutritional wealth to autophagy: In vivo metabolic dynamics in the cytosol, mitochondrion and
shuttles of IgG producing CHO cells. Metabolic Engineering, 54, pp.145-159.
Li, J., von Pföstl, V., Zaldivar, D., Zhang, X., Logothetis, N. and Rauch, A. (2011). Measuring
multiple neurochemicals and related metabolites in blood and brain of the rhesus monkey by
using dual microdialysis sampling and capillary hydrophilic interaction chromatography–mass
spectrometry. Analytical and Bioanalytical Chemistry, 402(8), pp.2545-2554.
Mehta, P., Wei, J. and Wenger, N. (2015). Ischemic heart disease in women: A focus on risk
factors. Trends in Cardiovascular Medicine, 25(2), pp.140-151.

Blood Metabolite Analysis of Spectrophotometric Lactate Assay.10
Shimojo, N., Naka, K., Nakajima, C., Yoshikawa, C., Okuda, K. and Okada, K. (1989). Test-
strip method for measuring lactate in whole blood. Clinical Chemistry, 35(9), pp.1992-1994.
Shimojo, N., Naka, K., Nakajima, C., Yoshikawa, C., Okuda, K. and Okada, K. (1989). Test-
strip method for measuring lactate in whole blood. Clinical Chemistry, 35(9), pp.1992-1994.
1 out of 10
Related Documents

Your All-in-One AI-Powered Toolkit for Academic Success.
+13062052269
info@desklib.com
Available 24*7 on WhatsApp / Email
Unlock your academic potential
© 2024 | Zucol Services PVT LTD | All rights reserved.