Quantitative Analysis of Caffeine in Energy Drinks via Spectro-scope

Verified

Added on  2021/04/22

|9
|1564
|78
Practical Assignment
AI Summary
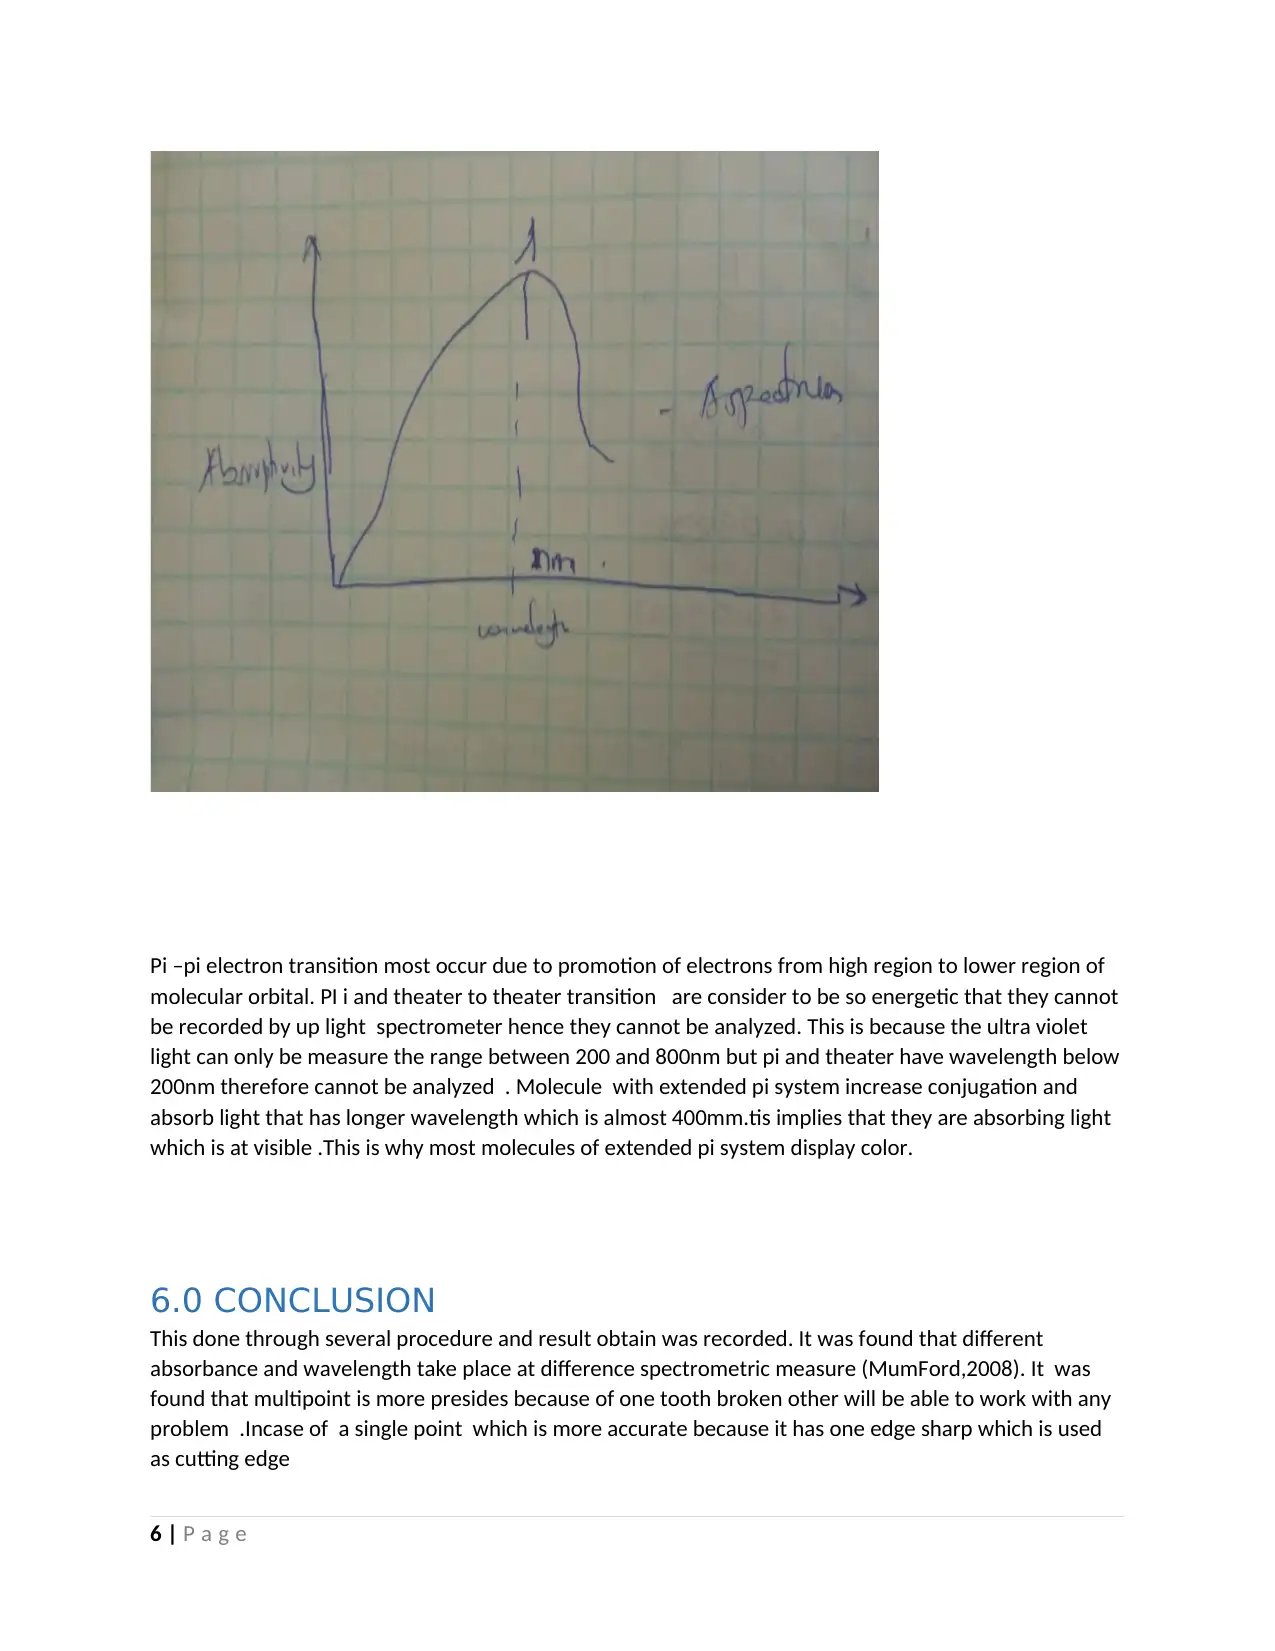
This assignment details a quantitative investigation of caffeine in energy drinks using UV-Vis spectrophotometry. The study focuses on determining caffeine concentration in commercial energy drink samples using the Agilent Cary 100 spectrophotometer. The methodology includes preparing caffeine standards, setting up single-point and multi-point calibrations, and measuring absorbance. The experiment involves dissolving caffeine in water, preparing stock solutions, and diluting them to create external standards. The absorbance of these standards and the unknown energy drink samples is then measured at a specific wavelength. The results show a linear relationship between absorbance and caffeine concentration. The discussion section covers the principles of spectroscopy, including the absorption of light by molecules and the Beer-Lambert law. Different types of electron transitions are also discussed, along with their impact on absorbance spectra. The conclusion highlights the importance of the methods used and the results obtained, with a focus on the precision of multipoint calibration. The assignment also includes answers to questions regarding the methodology and the impact of various factors on the accuracy of the results.
Document Page
QUALITATIVE ANALYSIS OF COFFEINE IN ENERGY DRINKS BY EXTERNAL STARNDARDS USING SPECTRO-
SCOPE
Name:
Subject:
Date of Submission:
Reg NO
1 | P a g e
tabler-icon-diamond-filled.svg

Paraphrase This Document

Need a fresh take? Get an instant paraphrase of this document with our AI Paraphraser
Document Page
ABRACTS
Quantitative investigation of caffeine in vitality in drinks by outer standard utilizing ultra violet light
spectroscopy. Concentration of caffeine in commercial energy drinks sample using the Agilent Cary 100
ultra violet-visible spectrophotometer was to be done .Single point and multi point was to be set up in
order to determine absorbility of molecules and this was to be done through electromagnetic.
2 | P a g e
Document Page
Contents
1.0 INTRODUCTION.....................................................................................................................................4
2.0 METHODS..............................................................................................................................................4
2.1 REAGENT............................................................................................................................................4
3.0 PROCEDURE...........................................................................................................................................4
4.0 RESULTS.................................................................................................................................................5
5.0 DISCUSSION...........................................................................................................................................5
6.0 CONCLUSION.........................................................................................................................................6
7.0 QUESTIONS............................................................................................................................................6
3 | P a g e
Document Page
1.0 INTRODUCTION
Caffeine in most case is found in many plants ,contained in plant parts such as fruits, roots and tea
leaves (Chang,2013). Caffeine is mild stimulant and pharmacologically active of the body nerve system.
There are several methods that have been used with liquid chromatograph and the most method which
is used in analytical study because it has fewer interference. HPLC is one of the method used in scientific
teaching laboratory but it is most expensive. One can extract caffeine of aqueous solution with
chlorinated solvents. After this process of extraction of caffeine it can be determined that it has a
solvent solution absorbance at 260nm.
2.0 METHODS
2.1 REAGENT
Pure water
caffeine
semi minor analytical balance
3.0 PROCEDURE
0.025 grams of pure water were to be weigh by using semi micro analytical and poured into a clean dry
150ml beaker as mass was being recorded. Addition of 70ml of RO water were added in the beaker in
order to dissolve caffeine powder. Swirl was to done and if the caffeine was not to dissolved, gently heat
was to be applied at low temperature for about five minutes in order to dissolve the solution. Analytical
transfer of the caffeine into 200ml volumetric flasks was to done (Wavepackect,2009) .150ml was to be
rinse three times with small volume of RO water and each rinse to the volumetric flasks was to be done.
Caffeine stock solution was to be made with RO water.at point B, five standards was prepared by
pipetting the caffeine stock solution and 50 ml pre rinsed in volumetric flask was done. Dilution of each
volumetric flask was to be done. This was followed by unknown drink sample was also to be made. This
was to be done in triplicate using a volumetric pippete .500 ml of unknown energy drink was to be
transferred into three separate 50.00ml analytical rinsed volumetric flask. Mark was made with RO
water. During quantitate absorption spectrum baseline was set to zero using a black solution. The
record of qualitative absorption spectrum was to be done using highest concentration .Selection of
wavelength for quantitative analysis was to be done using caffeine spectrum and result was to be
printed .By using of maximum wavelength for the caffeine spectrum., measurement of the absorbance
valance of each external standards calibration solution and energy was to be examined.
4.0 RESULTS
It was found that the measurement of the standard solution of absorbance increase with concentration
of the solution (Powder,2013). This show that linear regression of absorbance and standard
concentration force to move through the origin.
4 | P a g e
tabler-icon-diamond-filled.svg

Paraphrase This Document

Need a fresh take? Get an instant paraphrase of this document with our AI Paraphraser
Document Page
5.0 DISCUSSION
Spectroscopy is example of a concoction examination done by displaying light on a portion to
determine what is inside. Chemists commonly measure absorbance or transmittance. Molecule of
sample absorb specific wavelength of light. During a chemical analysis many wavelength of light is
shown through a sample. Because of different types of molecules and characteristic of each molecule
absorbed at different energies of light, there is need of different form of light, where by each form
utilizes different part of a spectrum. Many molecules absorb visible light. Absorbance is direct
proportion to path length and the concentration of the absorbing species. this s most done by beer laws
which state that.
A=Ebc where E is the constant of the proportionality.
Distinctive moleculea take in radiations of various wavelength. An ingestion range will demonstrate
distinctive number of retention security comparing to auxiliary gatherings inside a particle. There are
different type of electron transmission : transition involving pi and theater and n electrons ,transition
involving charge transfer electrons and transition involving d and f electrons.
antibonding
antibonding
lonely pair bonding
bonding
bonding
Antibonding molecule orbital are higher in energy compared to pi bonding orbital hence longer
wavelength. At a particular point where atoms are relied upon to light possessing a vitality that
resembles an electronic change inside particle , portion of light will be consumed as being an electron
that is elevated on a high vital orbit, the wavelength at which absorbance occur together with degree of
absorption at each wavelength are recorded by an optical spectrometer as in the diagram below
(Harris,2009).
5 | P a g e
Document Page
Pi –pi electron transition most occur due to promotion of electrons from high region to lower region of
molecular orbital. PI i and theater to theater transition are consider to be so energetic that they cannot
be recorded by up light spectrometer hence they cannot be analyzed. This is because the ultra violet
light can only be measure the range between 200 and 800nm but pi and theater have wavelength below
200nm therefore cannot be analyzed . Molecule with extended pi system increase conjugation and
absorb light that has longer wavelength which is almost 400mm.tis implies that they are absorbing light
which is at visible .This is why most molecules of extended pi system display color.
6.0 CONCLUSION
This done through several procedure and result obtain was recorded. It was found that different
absorbance and wavelength take place at difference spectrometric measure (MumFord,2008). It was
found that multipoint is more presides because of one tooth broken other will be able to work with any
problem .Incase of a single point which is more accurate because it has one edge sharp which is used
as cutting edge
6 | P a g e
Document Page
7.0 QUESTIONS
20.Multpoint is more presides because in case of one tooth breakage, other teeth can continue working
without any problem. At the same time higher feed rate can be given which increase material removal
at cutting edge. Therefore, insert base single point tool may have several cutting edge available on a
single tool, which out of one will take party cutting action at a pass.
21.There will be temperature different due to several engage of teeth. This is because different amount
Heat get dissipated from teeth hence rate of rise in tool temperature is actual low.
22.when the volume of the entire is more than accuracy. single point cutting tool give low feed rate
hence productivity is actual low.
23.Due to different bonding and non-bonding the concentration of caffeine will not be determine
accurately because of different wavelengths
24. The relationship must be established between mobile phase and composition.
Solutes capacity factors should be considered
Wealth of information is obtain in regards to an optimum mobile phase
Factors such humidity should be considered.
7 | P a g e
tabler-icon-diamond-filled.svg

Paraphrase This Document

Need a fresh take? Get an instant paraphrase of this document with our AI Paraphraser
Document Page
8.0 References
References
Chang, R. General Chemistry: The Essential Concepts, 3rd ed.; McGraw-Hill: Boston, 2013.
Gbalint-Kurti, G. G. Wavepacket Theory of Photodissociation and Reactive Scattering. In Advances
in Chemical Physics; Rice, S. A., Ed.; Wiley: New York, 2005; Vol. 128; p 257.
Goh, S. L. Polymer Chemistry in an Undergraduate Curriculum. In Introduction of Macromolecular
Science/Polymeric Materials into the Foundational Course in Organic Chemistry; ACS Symposium
Series 1151; American Chemical Society: Washington, DC, 2013; pp 113-127.
Powder Metallurgy. Kirk-Othmer Encyclopedia of Chemical Technology,3rd ed.; Wiley: New York,
2013; Vol. 19, pp 28-62.
Evans, D. A.; Fitch, D. M.; Smith, T. E.; Cee, V. J. Application of Complex Aldol Reactions to the
Total Synthesis of Phorboxazole B. J. Am. Chem. Soc. 2010, 122, 10033-10046..
Peacock-Lopez, E. Exact Solutions of the Quantum Double Square-Well Potential. Chem.
Ed. [Online] 2007, 11, 383-393 http://chemeducator.org/bibs/0011006/11060380lb.htm (accessed
Aug 23, 2007).
Harris, H., & Brewster, C. (2009). The coffee-machine system: how international selection really
works. International Journal of Human Resource Management, 10(3), 488-500.
Mumford, G. K., & Holtzman, S. G. (2008). Qualitative differences in the discriminative stimulus effects of
low and high doses of caffeine in the rat. Journal of Pharmacology and Experimental
Therapeutics, 258(3), 857-865.
homan, J. W., Jr. Studies of Molecular Deactivation: Surface-Active Free Radicals and S(O)para-
difluorobenzene. Ph.D. Dissertation, Massachusetts Institute of Technology, Cambridge, MA, 2014.
8 | P a g e
Document Page
9 | P a g e
chevron_up_icon
1 out of 9
circle_padding
hide_on_mobile
zoom_out_icon