Data Analysis Project: Analyzing Sports Skills with Regression Models
VerifiedAdded on 2022/08/23
|25
|2639
|19
Project
AI Summary
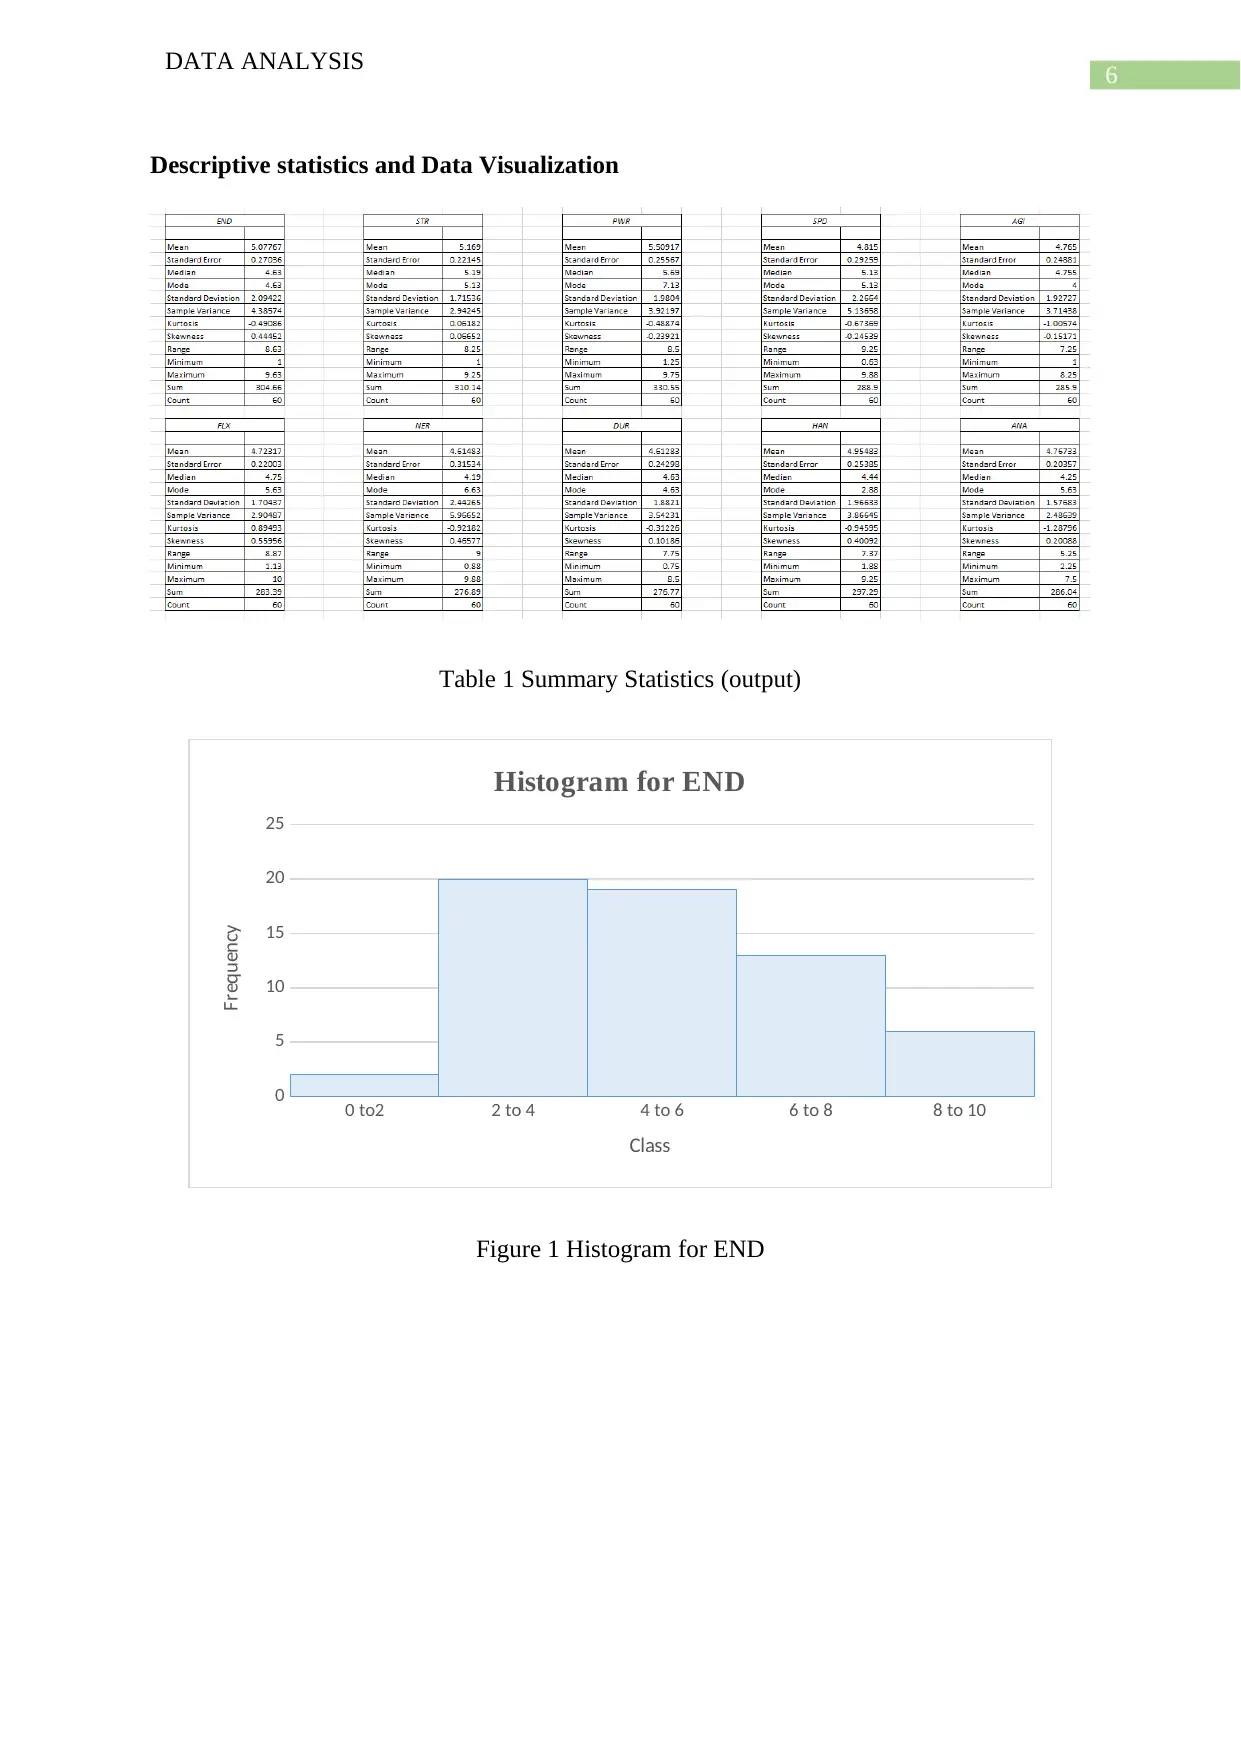
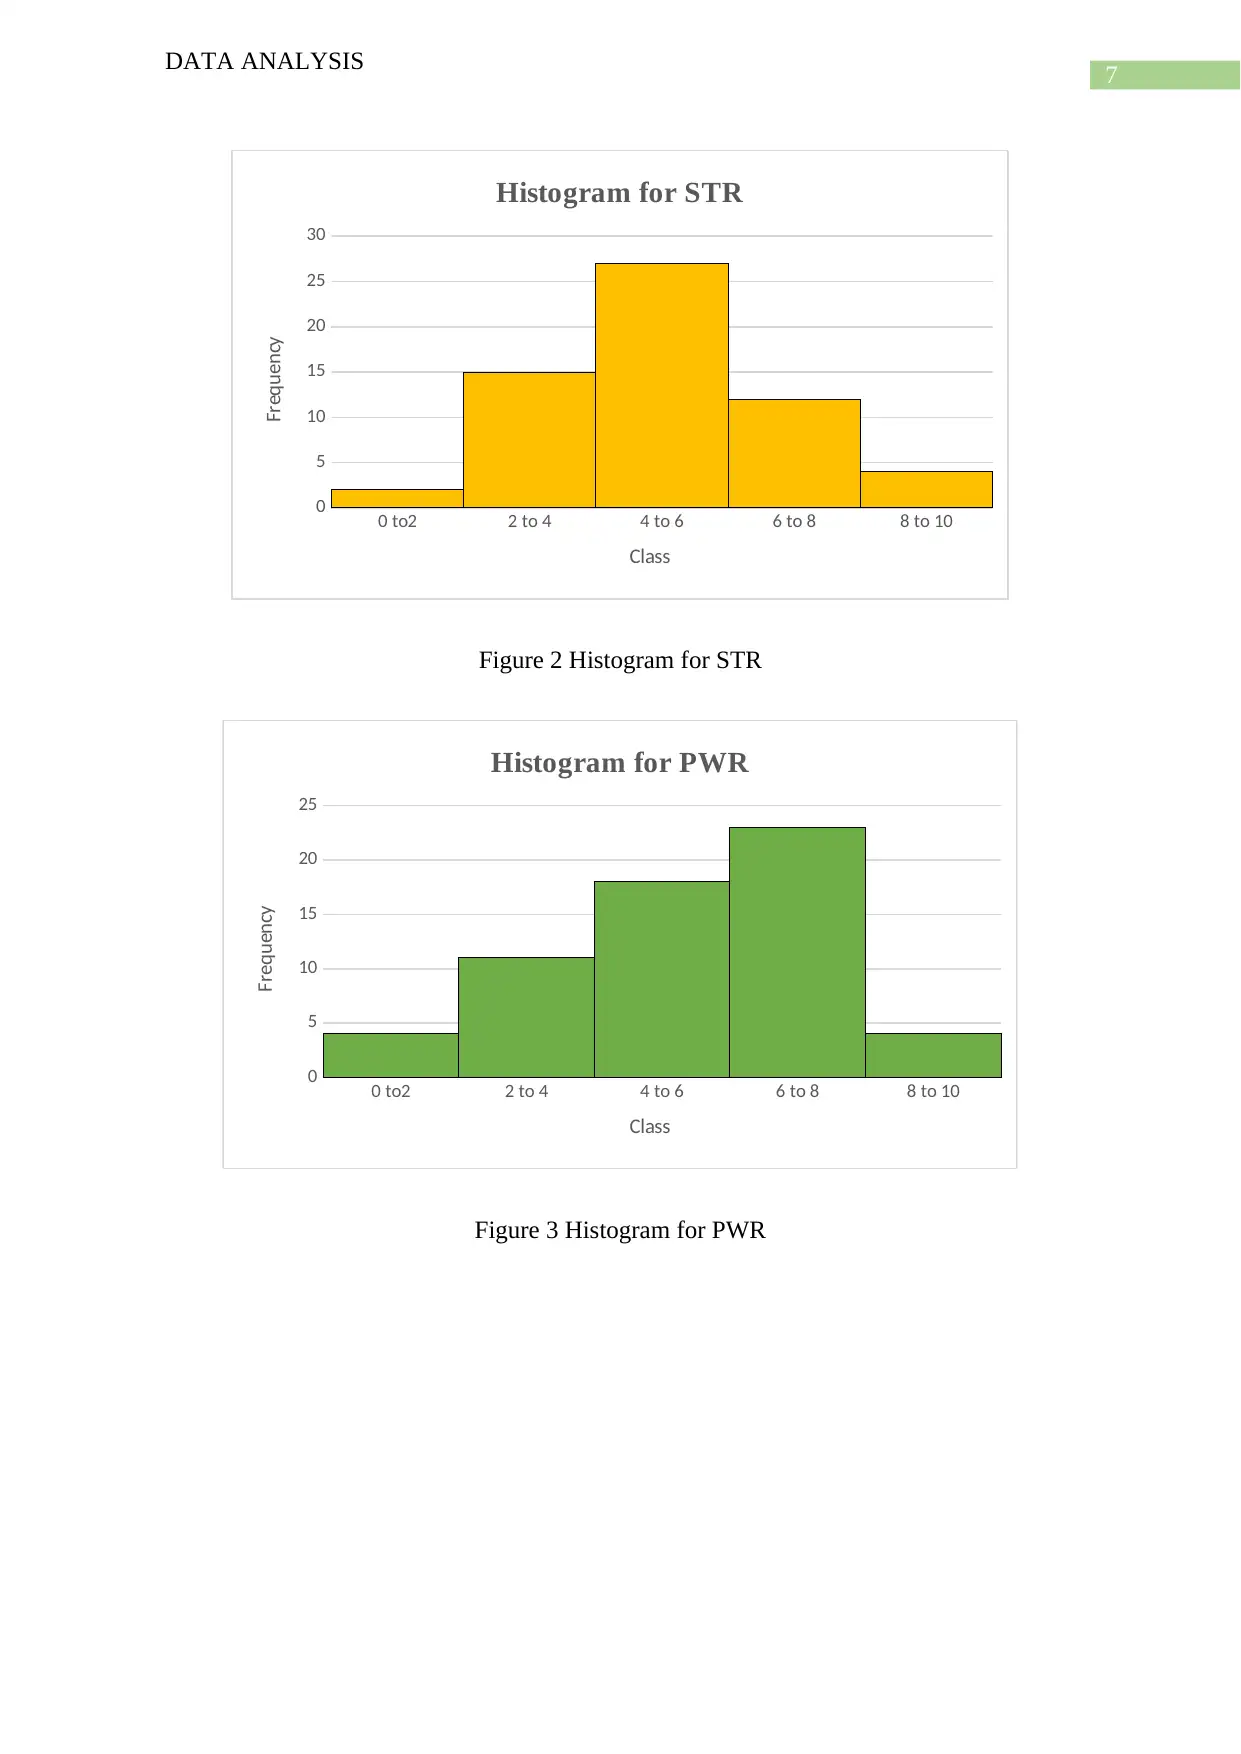
This data analysis project examines sports-specific skills, analyzing a dataset of 60 sports with 12 variables. The project conducts summary statistics, scatter plots, box plots, histograms, and regression analysis to explore relationships between variables. It emphasizes data cleaning to ensure data integrity. The study includes descriptive statistics, data visualization, and multiple regression analysis to identify significant relationships between variables. The analysis involves identifying skewness, outliers, and correlations. The project uses regression models to analyze the impact of different sports skills. The findings include positive and negative skewness and relationships between variables, supported by citations to relevant literature. The project concludes with a summary of the findings and suggestions for future research.

Running head: DATA ANALYSIS
Data Analysis
Name of the Student:
Name of the University:
Author note:
Data Analysis
Name of the Student:
Name of the University:
Author note:
Paraphrase This Document
Need a fresh take? Get an instant paraphrase of this document with our AI Paraphraser

1
DATA ANALYSIS
Table of Contents
Introduction and project description..........................................................................................2
Literature Review.......................................................................................................................3
Data sources, data cleaning and description..............................................................................4
Descriptive statistics and Data Visualization.............................................................................6
Analytical Model and Data Analysis.......................................................................................12
Results and discussion..............................................................................................................15
Summary and conclusion.........................................................................................................16
References and Bibliography...................................................................................................17
Appendix..................................................................................................................................19

2
DATA ANALYSIS
Introduction and project description
The study is based on sports-specific skills. There are 60 different sports, and 60
observations have been conducted in this study. There is a list of 12 variables has been
indicated in this study. This study conduct summary statistics, scatter plot, box plot, and
histogram and regression analysis. Moreover, an essential aspect of this study is data cleaning
and checking outliers. In this study, all the variables are quantitative numerical variables
(Prokoshyna et al., 2015).
⊘ This is a preview!⊘
Do you want full access?
Subscribe today to unlock all pages.

Trusted by 1+ million students worldwide

3
DATA ANALYSIS
Literature Review
The study on sports specific skills covers 60 different sports and 60 observations. The
previous research analyzes the assessing sports skills with different data set. Sports are
related to the area or field of data science. Moreover, sports is closely associated with the
training sciences and biomechanics of sports. The environment plays a vital role in sports
skills and sports applications. The data was collected by a questionnaire survey (Trottier &
Robitaille, 2014). The study was used to analyze the test for a different team. The present
research or previous study material are different. The study was conducted the inferential
statistics and descriptive statistics. The analysis part is the same for both the study analyzes
inferential and descriptive statistics (Holt et al., 2017). The finding from the previous study
showed that sports skills are based on the environment and guide of training. It has been
concluded that performance analysis depends upon team session group discussion and
defensive formations (Macnamara, Moreau & Hambrick, 2016). With the help of different
analytical skill, data visualization, and data duplication has been conducted. The present
study also shows the data duplication and display in MS-Excel software.
Paraphrase This Document
Need a fresh take? Get an instant paraphrase of this document with our AI Paraphraser

4
DATA ANALYSIS
Data sources, data cleaning, and description
In this study, all the variables are quantitative. There are ten variables have been
conducted in this study. There is no missing observation has been seen among all the
variables. There is a sample of 60 views has been taken in this study. The data has been
collected by a questionnaire survey in a location.
Data cleaning is a procedure that detects and remove corrupt or inaccurate data or
records from a data set. The cleaning is a procedure that modifies the data. This process may
be performed with the help of data wrangling tools or the system of batch (Chalamalla et al.,
2014).
When the data set is clean, then the next step is the cheek about the consistency of the
data. Inconsistent data always have error and missing. Thus this happens due to user error,
corruption in the transmission of storage. In that situation, the other important thing is the
data dictionary. Data cleaning maybe differs from data validation. The data validation defines
the invariability of data (Chu & Ilyas, 2016).
A proper process of data cleaning involves deleting the typographical error. There
some data cleaning procedure or solution has been done with the help of cross-checking with
valid data. In general, the cleaning procedure the enhancement in which data can be
converted by adding some related information. It is also related to the harmonization of data.
There are steps which involve in the data cleaning process. These are monitor errors,
standardize the process, and validate the accuracy, scrub for the duplicity of data and analyze
(Prokoshyna et al., 2015).
In the monitor, errors record and show the trend of data. In this case, most of the data
has been seen. It also helps to detect corrupt data. In this study, there is no missing data. But
some values are zero.

5
DATA ANALYSIS
In standardization, the essential point is to check the data at the time of entry. It helps
to produce useful data and reduce the risk of duplication (Chu, Krishnan & Wang, 2016)
Inaccuracy cleans the existing data. In research, the data tool allows for cleaning the
data. In this study, all the variables are valid.
The identification of duplicate data helps to save the time of analysis. There are
different data cleaning tools that avoid duplication.
In excel, with the help of a unique tool function, the missing data can be identified.
There is also another way to clean the data is that go to conditional formatting in highlight
cell rules, use duplicate values to identify duplication. After that, go-to information and
remove the duplicate, detect and remove the duplication. In this problem, there is no
duplicate value found.
⊘ This is a preview!⊘
Do you want full access?
Subscribe today to unlock all pages.

Trusted by 1+ million students worldwide

6
DATA ANALYSIS
Descriptive statistics and Data Visualization
Table 1 Summary Statistics (output)
0 to2 2 to 4 4 to 6 6 to 8 8 to 10
0
5
10
15
20
25
Histogram for END
Class
Frequency
Figure 1 Histogram for END
DATA ANALYSIS
Descriptive statistics and Data Visualization
Table 1 Summary Statistics (output)
0 to2 2 to 4 4 to 6 6 to 8 8 to 10
0
5
10
15
20
25
Histogram for END
Class
Frequency
Figure 1 Histogram for END
Paraphrase This Document
Need a fresh take? Get an instant paraphrase of this document with our AI Paraphraser

7
DATA ANALYSIS
0 to2 2 to 4 4 to 6 6 to 8 8 to 10
0
5
10
15
20
25
30
Histogram for STR
Class
Frequency
Figure 2 Histogram for STR
0 to2 2 to 4 4 to 6 6 to 8 8 to 10
0
5
10
15
20
25
Histogram for PWR
Class
Frequency
Figure 3 Histogram for PWR
DATA ANALYSIS
0 to2 2 to 4 4 to 6 6 to 8 8 to 10
0
5
10
15
20
25
30
Histogram for STR
Class
Frequency
Figure 2 Histogram for STR
0 to2 2 to 4 4 to 6 6 to 8 8 to 10
0
5
10
15
20
25
Histogram for PWR
Class
Frequency
Figure 3 Histogram for PWR

8
DATA ANALYSIS
0 to2 2 to 4 4 to 6 6 to 8 8 to 10
0
5
10
15
20
25
Histogram for SPD
Class
Frequency
Figure 4 Histogram for SPD
0 1 2 3 4 5 6 7 8 9
0
2
4
6
8
10
12
Scatter Plot on AGI versus FLX
AGI
FLX
Figure 5 Scatter Plot on AGI versus FLX
DATA ANALYSIS
0 to2 2 to 4 4 to 6 6 to 8 8 to 10
0
5
10
15
20
25
Histogram for SPD
Class
Frequency
Figure 4 Histogram for SPD
0 1 2 3 4 5 6 7 8 9
0
2
4
6
8
10
12
Scatter Plot on AGI versus FLX
AGI
FLX
Figure 5 Scatter Plot on AGI versus FLX
⊘ This is a preview!⊘
Do you want full access?
Subscribe today to unlock all pages.

Trusted by 1+ million students worldwide

9
DATA ANALYSIS
0 2 4 6 8 10 12
0
1
2
3
4
5
6
7
8
9
Scatter Plot on NER versus DUR
NER
DUR
Figure 6 Scatter Plot on NER versus DUR
1 2 3 4 5 6 7 8 9 10
0
1
2
3
4
5
6
7
8
Scatter Plot on HAN versus ANA
HAN
ANA
Figure 7 Scatter Plot on HAN versus ANA
DATA ANALYSIS
0 2 4 6 8 10 12
0
1
2
3
4
5
6
7
8
9
Scatter Plot on NER versus DUR
NER
DUR
Figure 6 Scatter Plot on NER versus DUR
1 2 3 4 5 6 7 8 9 10
0
1
2
3
4
5
6
7
8
Scatter Plot on HAN versus ANA
HAN
ANA
Figure 7 Scatter Plot on HAN versus ANA
Paraphrase This Document
Need a fresh take? Get an instant paraphrase of this document with our AI Paraphraser

10
DATA ANALYSIS
END STR PWR SPD
0
1
2
3
4
5
6
7
8
Box Plot
Figure 8 Box Plot on END, STR, PWR, and SPD
In the summary statistics of END it has been seen that the mean, median and mode of
END is 5.08, 4.63, and 4.63. It has been seen that the mean value of END is higher than the
median. Hence the END sports data is positively skewed. The variance, standard deviation
and range is 4.38, 2.09 and 8.63. The mean, median and mode of STR is 5.169, 5.19 and
5.13. Since mean is larger than the median. Hence the STR is positively skewed. In case of
PWR, SPD and AGI the mean value is smaller than the median. Hence their skewness is
negative. Similarly for FLX, NER, DUR, HAN and ANA the mean value is higher than the
median. Hence their skewness is positive. The variance, standard deviation and range among
all the variables has been calculated and which has been shown in the excel file or
appendices.
There are some histogram has been constructed. In this histogram the X-axis represent
the class and the Y-axis represent the frequency. Most of the histogram shows about
normality of data. There some histogram is skewed and some of normal.

11
DATA ANALYSIS
In the section of scatter plot shows the relationship between two variables at a time.
All the scatter plot shows that there is a positive relationship between these variables. It is
positive because the data points are close to the trend line. In the scatter plot section the
relationship AGI and FLX, NER and DUR, and HAN and ANA have been illustrated.
The box plot shows that the outliers are existed or not in this data set. It has been seen
that there are no outliers—there some box plot smmetric and some positively or negatively
skewed.
⊘ This is a preview!⊘
Do you want full access?
Subscribe today to unlock all pages.

Trusted by 1+ million students worldwide
1 out of 25
Related Documents
Your All-in-One AI-Powered Toolkit for Academic Success.
+13062052269
info@desklib.com
Available 24*7 on WhatsApp / Email
Unlock your academic potential
Copyright © 2020–2025 A2Z Services. All Rights Reserved. Developed and managed by ZUCOL.


