Ratio Analysis Report: Sports Direct International & JD Sports Fashion

Verified

Added on  2020/05/11

|30
|3860
|307
Report
AI Summary
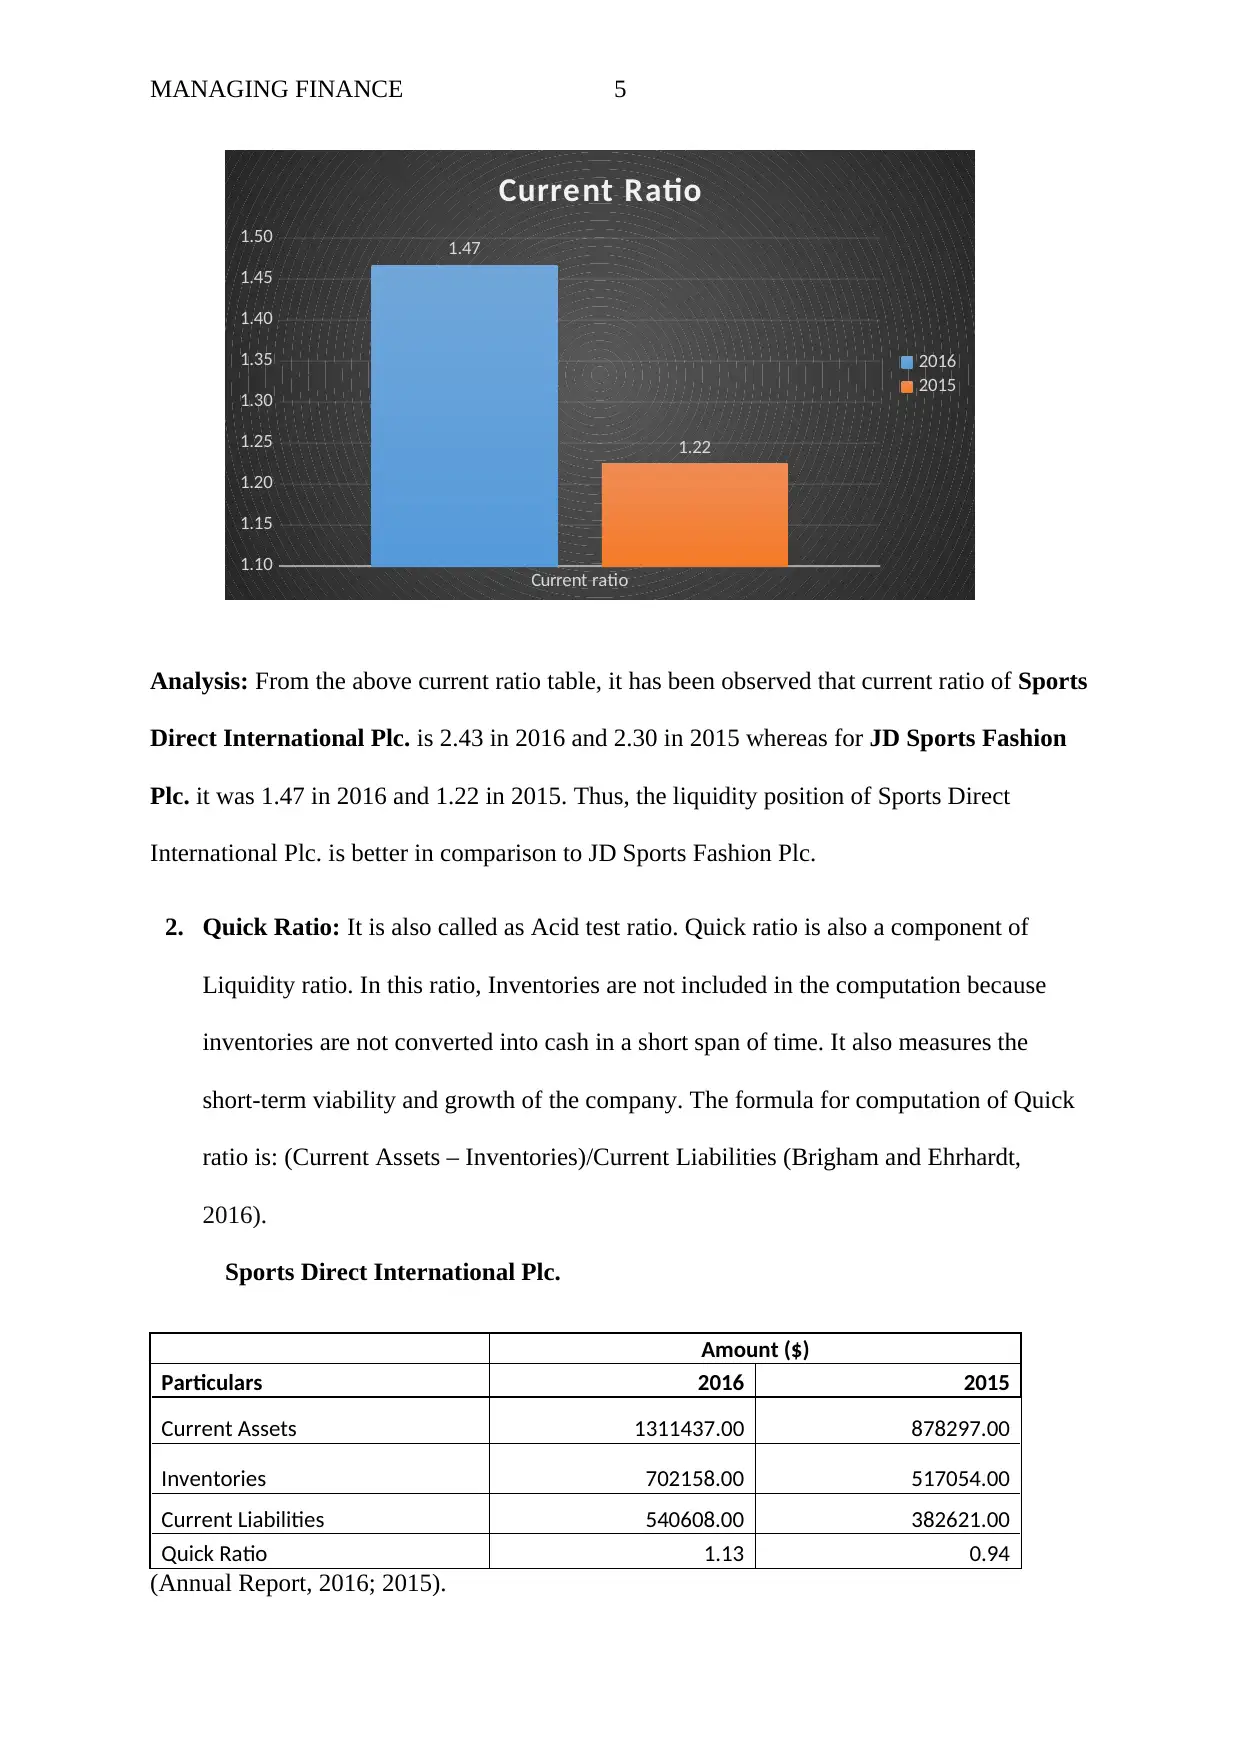
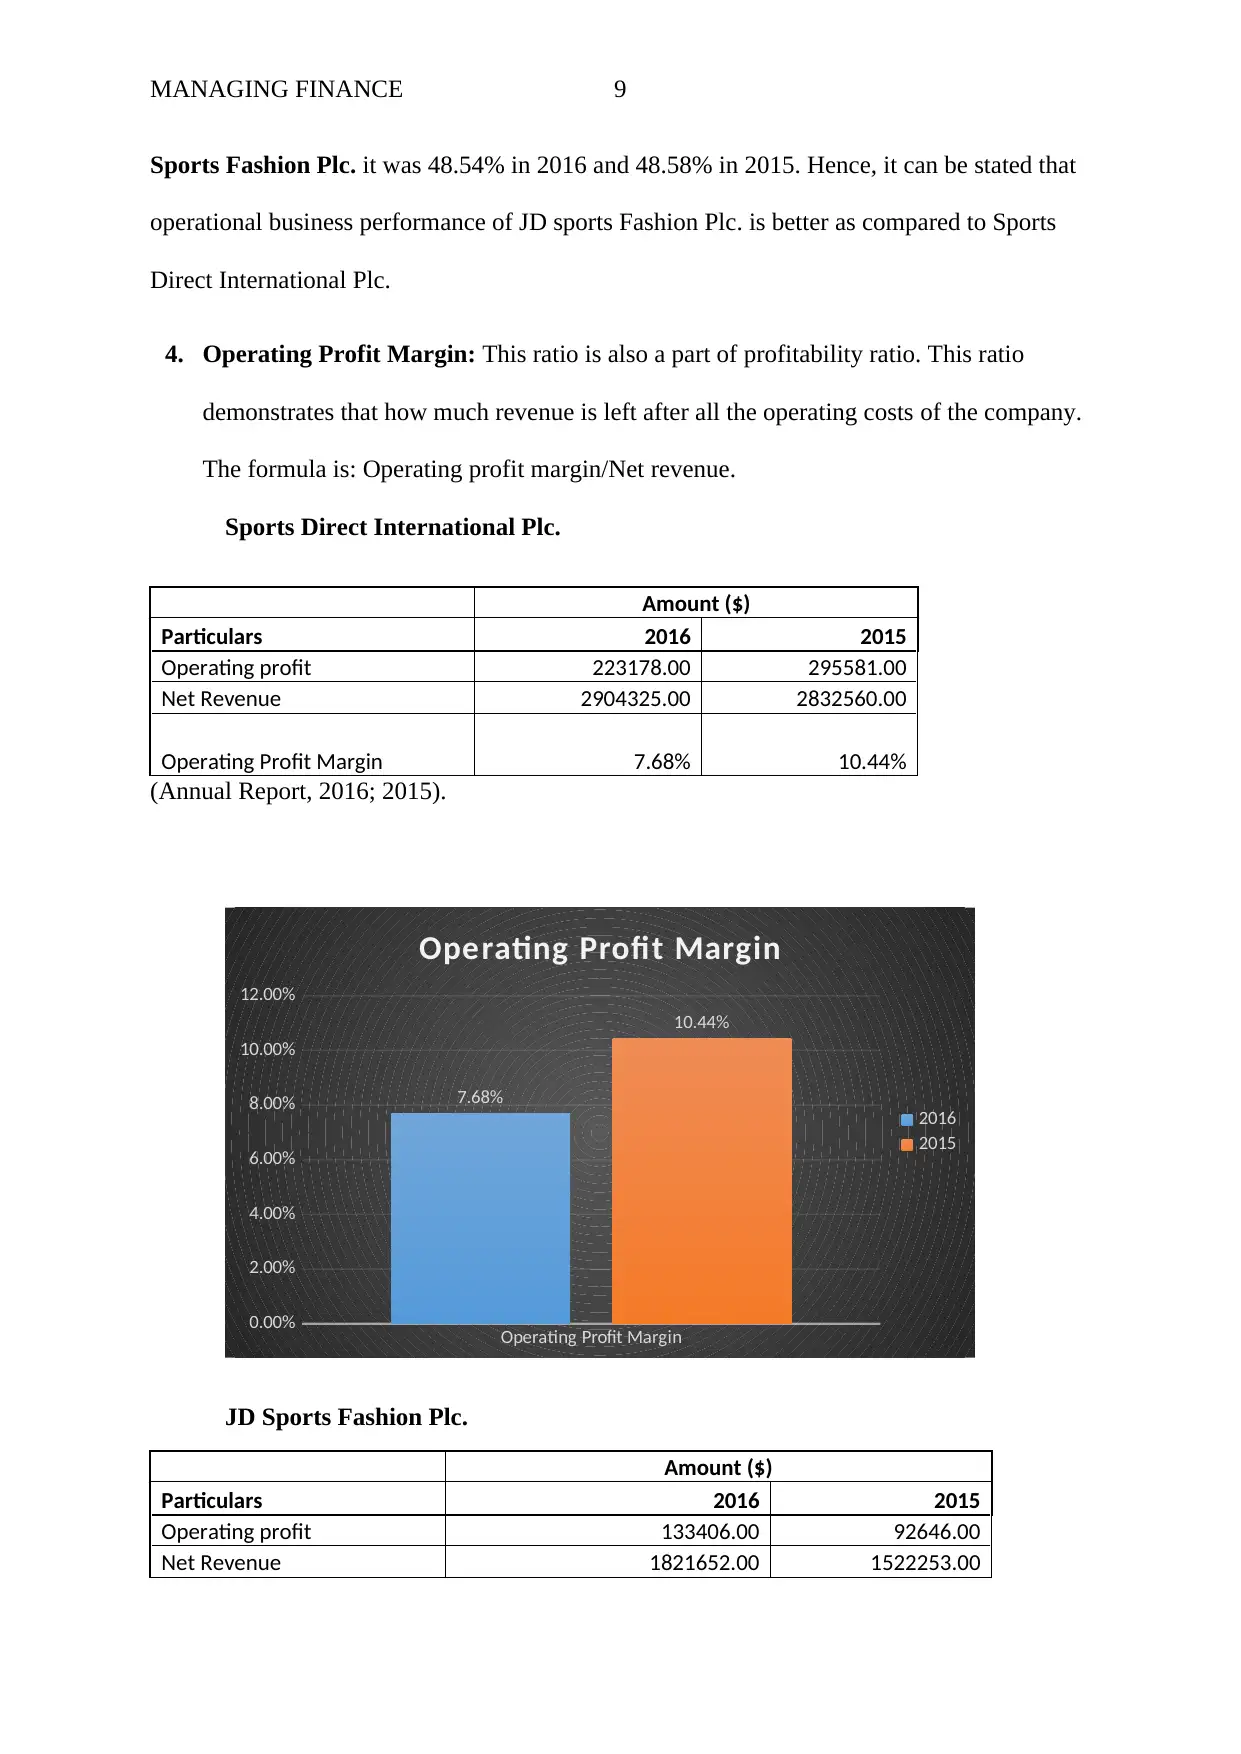
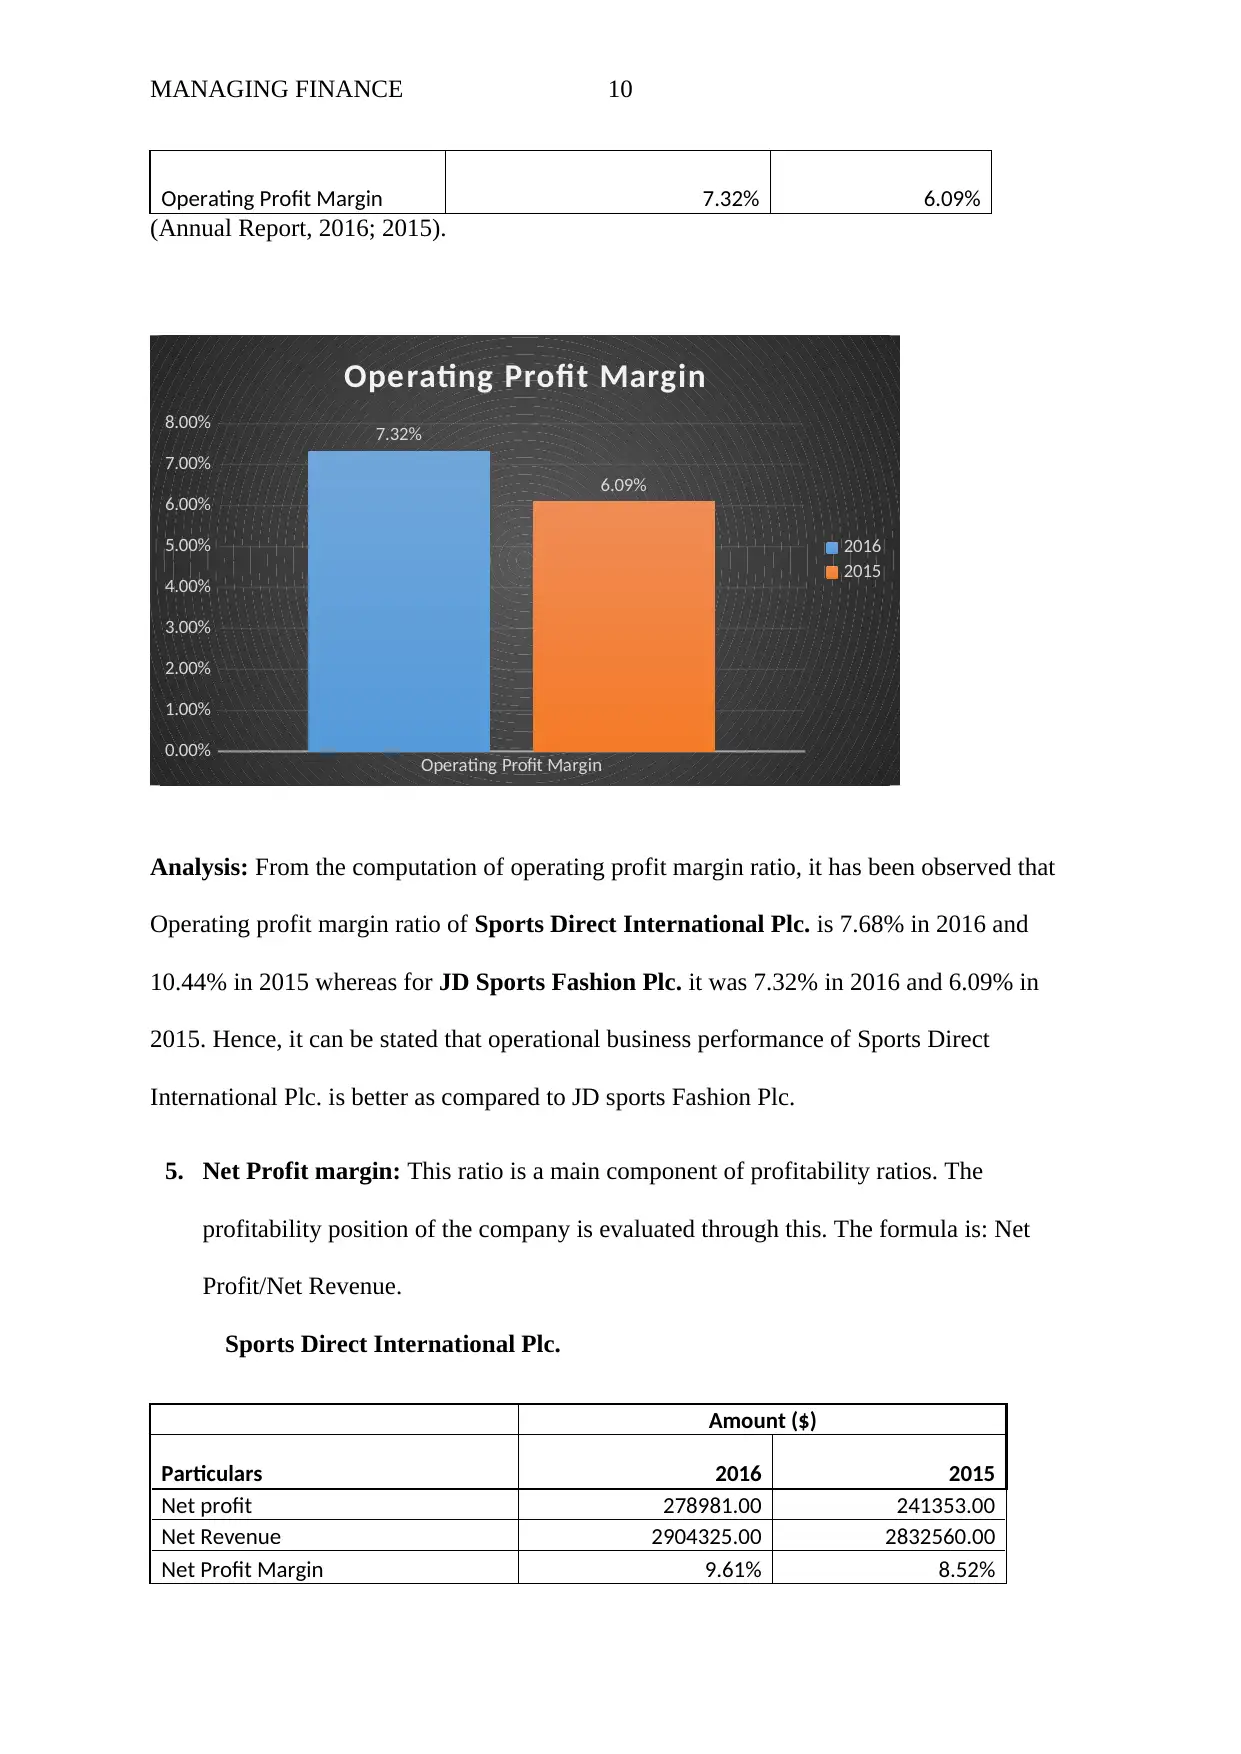
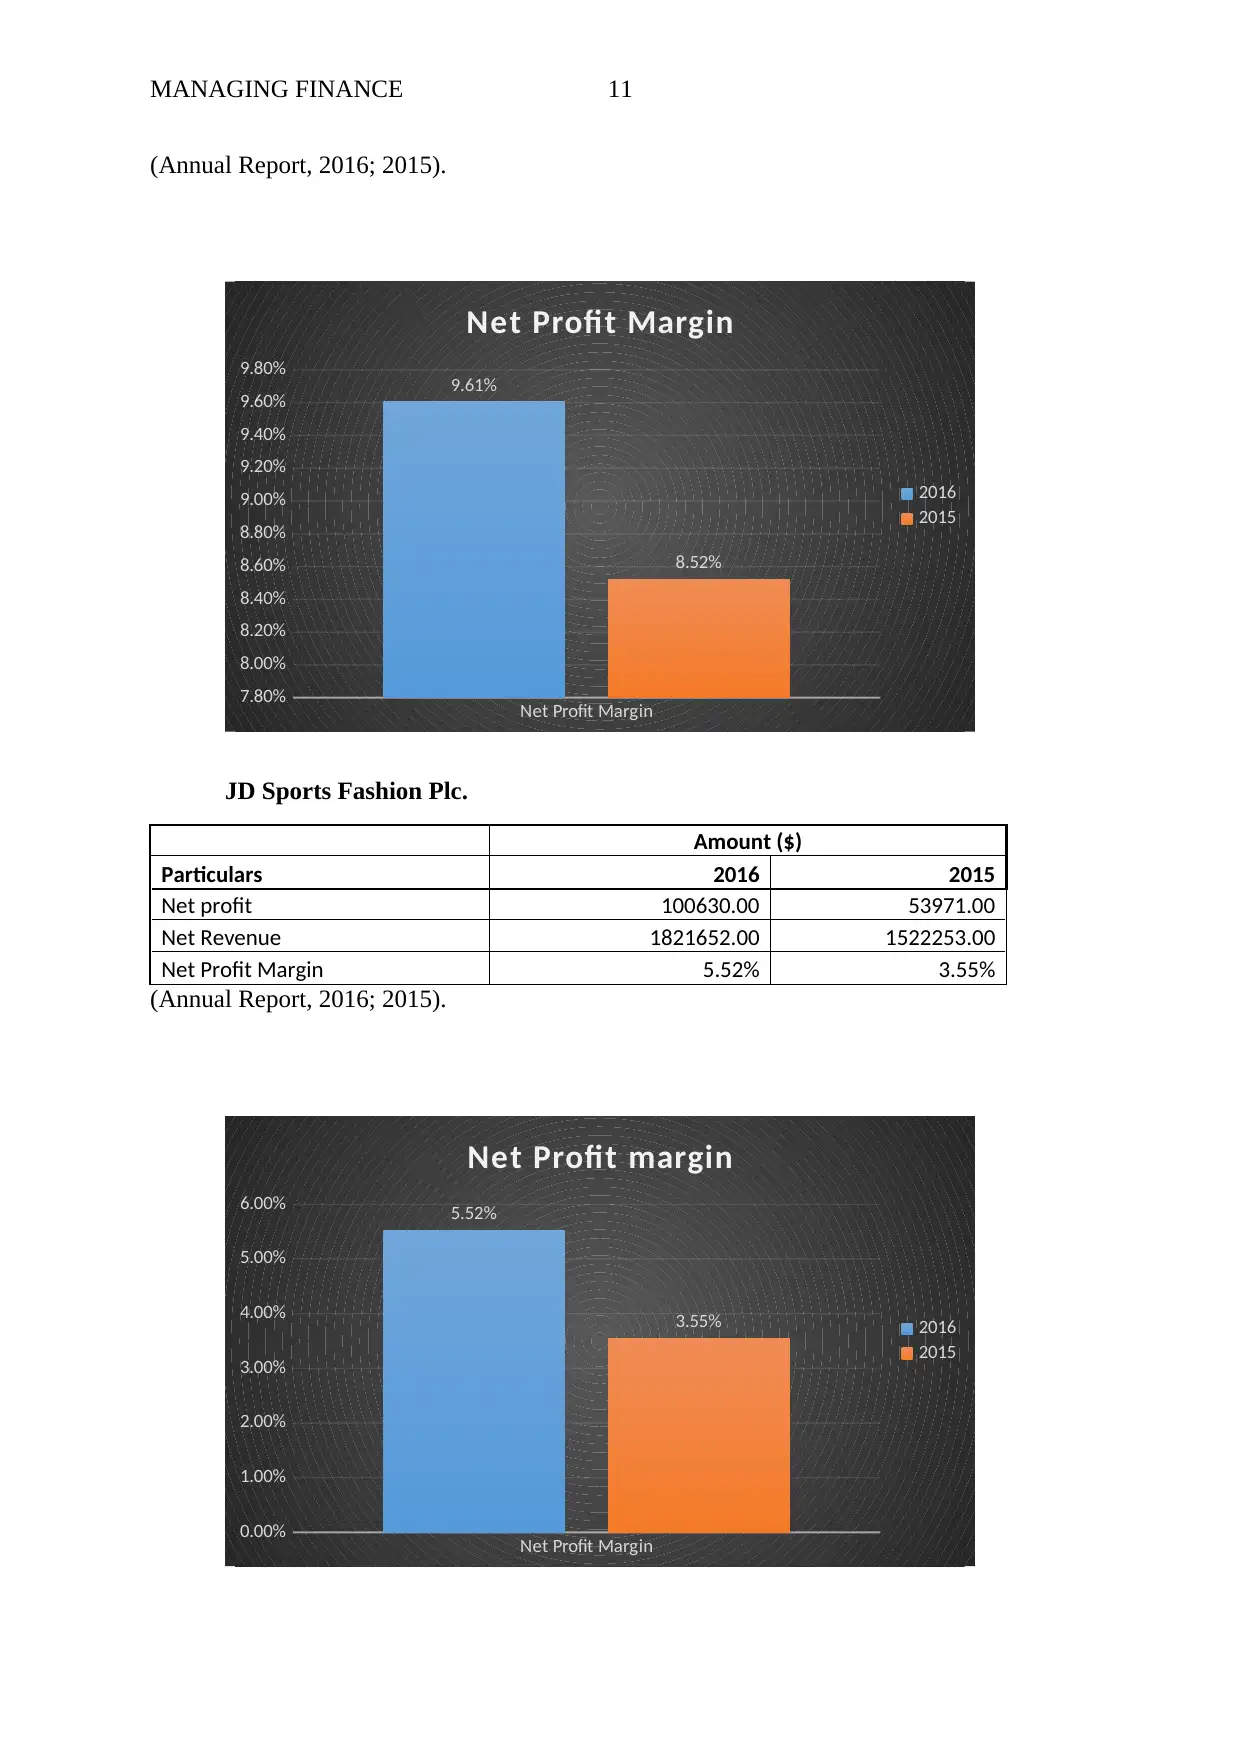
This report provides a comparative financial analysis of Sports Direct International Plc. and JD Sports Fashion Plc. The analysis is based on financial data from 2015 and 2016, extracted from balance sheets, income statements, and cash flow statements. The core of the report involves a detailed ratio analysis, including current ratio, quick ratio, gross profit margin, operating profit margin, net profit margin, gearing ratio, earnings per share (EPS), return on capital employed (ROCE), average inventory turnover period, and dividend payout ratio. The study aims to determine the financial health of each company to assess investment viability, offering insights into their liquidity, profitability, and solvency. The report concludes with recommendations for business performance improvement and acknowledges the limitations of ratio analysis.
Document Page
RUNNING HEAD: MANAGING FINANCE
MANAGING FINANCE
tabler-icon-diamond-filled.svg

Paraphrase This Document

Need a fresh take? Get an instant paraphrase of this document with our AI Paraphraser
Document Page
MANAGING FINANCE 1
Contents
PORTFOLIO 1.........................................................................................................................................2
INTRODUCTION.................................................................................................................................2
COMPANY OVERVIEW.......................................................................................................................2
SPORTS DIRECT INTERNATIOANL PLC............................................................................................2
JD SPORTS FASHION PLC................................................................................................................3
RATIO ANALYIS..................................................................................................................................3
CONCLUSION...................................................................................................................................20
RECOMMENDATION........................................................................................................................20
LIMITATIONS OF RATIO ANALYSIS...................................................................................................21
PORTFOLIO 2.......................................................................................................................................21
LIMITATION OF INVESTMENT APPRAISAL TECHNIQUES..................................................................27
REFERENCES........................................................................................................................................28
Document Page
MANAGING FINANCE 2
PORTFOLIO 1
INTRODUCTION
This report will include the company overviews of Sports Direct International Plc.
and JD Sports Fashion Plc. and the financial performance will be analysis for both the
companies through interpreting ratios for years 2015 and 2016. The financial data will be
extracted from the Balance sheet, income statement and the cash flow statement. The
financial health will be determined for the purpose of assessing whether the investor should
invest or not. This report will also provide conclusion. Further in this paper the
recommendations of business performance improvement and the limitations of the ratio
analysis is also given.
COMPANY OVERVIEW
SPORTS DIRECT INTERNATIOANL PLC
The Sports Direct International Plc is the largest and leading sports and
lifestyle company in UK. The company was established in 1982. The company has
diversified portfolio of clothing, footwear, equipment and accessories. The company
has also expanded its operations in Asia, Europe and USA (Financial Times, 2017). It
is operated through 4 business segments such as UK sports retail, International Sports
retail, Brands and Premium lifestyle. Further it is also offers the range of products
thorough SPORTSDIRECT.com and also licensed its brands to UK partners,
continental Europe, America’s and The Far East (Yahoo Finance, 2017). It has also 32
fitness gymnasiums. Approximately there are 757 stores in the world and around
18280 employees work together to serve the clients in order to attain the new level of
excellence (Annual report and accounts, 2017). The CEO of the company is Mike
Ashley and the chairman is Keith Hellawell.
Document Page
MANAGING FINANCE 3
JD SPORTS FASHION PLC
JD Sports Fashion Plc is a leading UK fashionable brand of multiple
companies, own brand sports and casual wear. The company was established in 1981.
The group has significant international brands such as Nike, Reebok, Puma and
Adidas and also gained its image for being the most advanced merchandiser by
keeping stylish ranges of sportswear. The group has expanded its business operations
in other parts of the world such as Ireland, France, Spain, Germany, Italy, New
Zealand and many more etc. Approximately the group has 1300 stores in the world
and around 23584 employees work together (Bloomberg, 2017). The group has
continued to grow organically by acquiring every year fashion brands store. The key
people of the group are: Mr. Peter Alan Cowgill is the Chairman and Mr. Brian Small
is the CFO of the group. Pent land Group Plc. is the holding company of the JD
Sports Fashion Plc. Further the company is also offers the range of products thorough
online portal named getthelabel.com (JD Sports Fashion Plc., 2017).
The above two companies are competitors to each other. Thus, the
performance of these two companies will be determined through Ratio analysis.
RATIO ANALYIS
The Ratio analysis is the best format to determine the financial stability of the
companies by the individuals so that decisions of the investments can be taken accordingly.
The companies are: Sports Direct International Plc. and the JD Sports Fashion Plc. are
chosen for this task. Below are the ten financial ratios which will be computed for years 2015
and 2016 and on the basis of ratios, recommendation will be given on the company which is
more viable option to invest.
1. Current ratio: Current Ratio is the component of Liquidity ratio which determines the
short-term viability and growth of the company. This ratio determines the company’s
tabler-icon-diamond-filled.svg

Paraphrase This Document

Need a fresh take? Get an instant paraphrase of this document with our AI Paraphraser
Document Page
MANAGING FINANCE 4
ability to meet the short-term obligations with the available short-term assets. The
formula for the computation of Current ratio is: Current Assets/Current Liabilities
(Tracy, 2012).
Sports Direct International Plc.
Amount ($)
Particulars 2016 2015
Current Assets 1311437.00 878297.00
Current Liabilities 540608.00 382621.00
Current Ratio 2.43 2.30
(Annual Report, 2016; 2015).
Current Ratio
2.20
2.25
2.30
2.35
2.40
2.45 2.43
2.30
Current ratio
2016
2015
JD Sports Fashion Plc.
Amount ($)
Particulars 2016 2015
Current Assets 510695.00 400259.00
Current Liabilities 348154.00 326748.00
Current Ratio 1.47 1.22
(Annual Report, 2016; 2015).
Document Page
MANAGING FINANCE 5
Current ratio
1.10
1.15
1.20
1.25
1.30
1.35
1.40
1.45
1.50 1.47
1.22
Current Ratio
2016
2015
Analysis: From the above current ratio table, it has been observed that current ratio of Sports
Direct International Plc. is 2.43 in 2016 and 2.30 in 2015 whereas for JD Sports Fashion
Plc. it was 1.47 in 2016 and 1.22 in 2015. Thus, the liquidity position of Sports Direct
International Plc. is better in comparison to JD Sports Fashion Plc.
2. Quick Ratio: It is also called as Acid test ratio. Quick ratio is also a component of
Liquidity ratio. In this ratio, Inventories are not included in the computation because
inventories are not converted into cash in a short span of time. It also measures the
short-term viability and growth of the company. The formula for computation of Quick
ratio is: (Current Assets – Inventories)/Current Liabilities (Brigham and Ehrhardt,
2016).
Sports Direct International Plc.
Amount ($)
Particulars 2016 2015
Current Assets 1311437.00 878297.00
Inventories 702158.00 517054.00
Current Liabilities 540608.00 382621.00
Quick Ratio 1.13 0.94
(Annual Report, 2016; 2015).
Document Page
MANAGING FINANCE 6
Quick Ratio
0.85
0.90
0.95
1.00
1.05
1.10
1.15 1.13
0.94
Quick Ratio
2016
2015
JD Sports Fashion Plc.
Amount ($)
Particulars 2016 2015
Current Assets 510695.00 400259.00
Inventories 238324.00 225020.00
Current Liabilities 348154.00 326748.00
Quick Ratio 0.78 0.54
(Annual Report, 2016; 2015).
tabler-icon-diamond-filled.svg

Paraphrase This Document

Need a fresh take? Get an instant paraphrase of this document with our AI Paraphraser
Document Page
MANAGING FINANCE 7
Quick Ratio
0.00
0.10
0.20
0.30
0.40
0.50
0.60
0.70
0.80
0.90
0.78
0.54
Quick ratio
2016
2015
Analysis: From the above Quick ratio table, it has been observed that quick ratio of Sports
Direct International Plc. is 1.13 in 2016 and 0.94 in 2015 whereas for JD Sports Fashion
Plc. it was 0.78 in 2016 and 0.54 in 2015. Therefore, the current assets of Sports Direct
International Plc. is quickly converted into cash in comparison to JD Sports Fashion Plc.
Thus, the liquidity position of Sports Direct International Plc. is better.
3. Gross Profit Margin: This ratio is a component of profitability ratio. In this ratio,
Operational business position is evaluated. The formula is: Gross profit/Net revenue.
Sports Direct International Plc.
Amount ($)
Particulars 2016 2015
Gross Profit 1284644.00 1240812.00
Net Revenue 2904325.00 2832560.00
Gross Profit Margin 44.23% 43.81%
(Annual Report, 2016; 2015).
Document Page
MANAGING FINANCE 8
Gross Profit Margin
43.50%
43.60%
43.70%
43.80%
43.90%
44.00%
44.10%
44.20%
44.30% 44.23%
43.81%
Gross Profit Margin
2016
2015
JD Sports Fashion Plc.
Amount ($)
Particulars 2016 2015
Gross Profit 884221.00 739550.00
Net Revenue 1821652.00 1522253.00
Gross Profit Margin 48.54% 48.58%
(Annual Report, 2016; 2015).
Gross Profit Margin
48.51%
48.52%
48.53%
48.54%
48.55%
48.56%
48.57%
48.58%
48.59%
48.54%
48.58%
Gross Profit Margin
2016
2015
Analysis: From the computation of Gross margin ratio, it has been observed that GP ratio of
Sports Direct International Plc. is 44.23% in 2016 and 43.81% in 2015 whereas for JD
Document Page
MANAGING FINANCE 9
Sports Fashion Plc. it was 48.54% in 2016 and 48.58% in 2015. Hence, it can be stated that
operational business performance of JD sports Fashion Plc. is better as compared to Sports
Direct International Plc.
4. Operating Profit Margin: This ratio is also a part of profitability ratio. This ratio
demonstrates that how much revenue is left after all the operating costs of the company.
The formula is: Operating profit margin/Net revenue.
Sports Direct International Plc.
Amount ($)
Particulars 2016 2015
Operating profit 223178.00 295581.00
Net Revenue 2904325.00 2832560.00
Operating Profit Margin 7.68% 10.44%
(Annual Report, 2016; 2015).
Operating Profit Margin
0.00%
2.00%
4.00%
6.00%
8.00%
10.00%
12.00%
7.68%
10.44%
Operating Profit Margin
2016
2015
JD Sports Fashion Plc.
Amount ($)
Particulars 2016 2015
Operating profit 133406.00 92646.00
Net Revenue 1821652.00 1522253.00
tabler-icon-diamond-filled.svg

Paraphrase This Document

Need a fresh take? Get an instant paraphrase of this document with our AI Paraphraser
Document Page
MANAGING FINANCE 10
Operating Profit Margin 7.32% 6.09%
(Annual Report, 2016; 2015).
Operating Profit Margin
0.00%
1.00%
2.00%
3.00%
4.00%
5.00%
6.00%
7.00%
8.00% 7.32%
6.09%
Operating Profit Margin
2016
2015
Analysis: From the computation of operating profit margin ratio, it has been observed that
Operating profit margin ratio of Sports Direct International Plc. is 7.68% in 2016 and
10.44% in 2015 whereas for JD Sports Fashion Plc. it was 7.32% in 2016 and 6.09% in
2015. Hence, it can be stated that operational business performance of Sports Direct
International Plc. is better as compared to JD sports Fashion Plc.
5. Net Profit margin: This ratio is a main component of profitability ratios. The
profitability position of the company is evaluated through this. The formula is: Net
Profit/Net Revenue.
Sports Direct International Plc.
Amount ($)
Particulars 2016 2015
Net profit 278981.00 241353.00
Net Revenue 2904325.00 2832560.00
Net Profit Margin 9.61% 8.52%
Document Page
MANAGING FINANCE 11
(Annual Report, 2016; 2015).
Net Profit Margin
7.80%
8.00%
8.20%
8.40%
8.60%
8.80%
9.00%
9.20%
9.40%
9.60%
9.80% 9.61%
8.52%
Net Profit Margin
2016
2015
JD Sports Fashion Plc.
Amount ($)
Particulars 2016 2015
Net profit 100630.00 53971.00
Net Revenue 1821652.00 1522253.00
Net Profit Margin 5.52% 3.55%
(Annual Report, 2016; 2015).
Net Profit Margin
0.00%
1.00%
2.00%
3.00%
4.00%
5.00%
6.00% 5.52%
3.55%
Net Profit margin
2016
2015
chevron_up_icon
1 out of 30
circle_padding
hide_on_mobile
zoom_out_icon
[object Object]