Comparative Financial Analysis: Sports Direct & JD Sports (2015-2016)
VerifiedAdded on 2020/09/08
|20
|4323
|67
Report
AI Summary
This report presents a detailed financial analysis comparing Sports Direct International PLC and JD Sports Fashion PLC for the years 2015 and 2016. The analysis focuses on key financial ratios, including current ratio, quick ratio, gross profit margin, operating profit margin, net profit margin, gearing ratio, earnings per share, return on capital employed, average inventory turnover period, and dividend payout ratio. The report evaluates the performance, investment potential, and financial position of both firms, offering insights into their profitability, financial health, and efficiency. Graphical representations are used to illustrate the trends and variations in the financial ratios. Recommendations are provided for improving financial performance, and the limitations of using financial ratios for interpretation are also discussed. The report also briefly touches upon investment appraisal techniques and their limitations in long-term decision-making.

Managerial Finance
Paraphrase This Document
Need a fresh take? Get an instant paraphrase of this document with our AI Paraphraser
TABLE OF CONTENTS
INTRODUCTION...........................................................................................................................1
QUESTION 1...................................................................................................................................1
A Analysing the financial ratios for 2015 and 2016...............................................................1
B Determining the performance, investment potential and financial position of both firms. 3
C Recommending ways to improve the financial performance of business........................12
D Evaluating the limitations of financial ratios to interpret firm performance....................12
QUESTION 2.................................................................................................................................13
A Application of investment appraisal techniques to advise senior manager......................13
B Evaluating the limitations over investment appraisal techniques for long term decision
making..................................................................................................................................16
CONCLUSION..............................................................................................................................16
REFERENCES..............................................................................................................................17
INTRODUCTION
To develop the operational efficiency of business, there is essential requirement of having
adequate amount of funds. In order to meet various business needs such as expansion, sales,
purchase or investment, it is necessary that the business must have financial strength which in
turn is helpful for making adequate growth of business. In the present assessments, there has
been analysis based on the two sports industries: Sport Direct International PLC and JD Sports
Fashion PLC. Therefore, the managers of these organisations will be suggested to make
necessary improvements in their operational activities as to enhance the financial strength. The
report will also evaluate various investment appraisals which in turn have some limitations and
necessity in the business operations.
QUESTION 1
A Analysing the financial ratios for 2015 and 2016
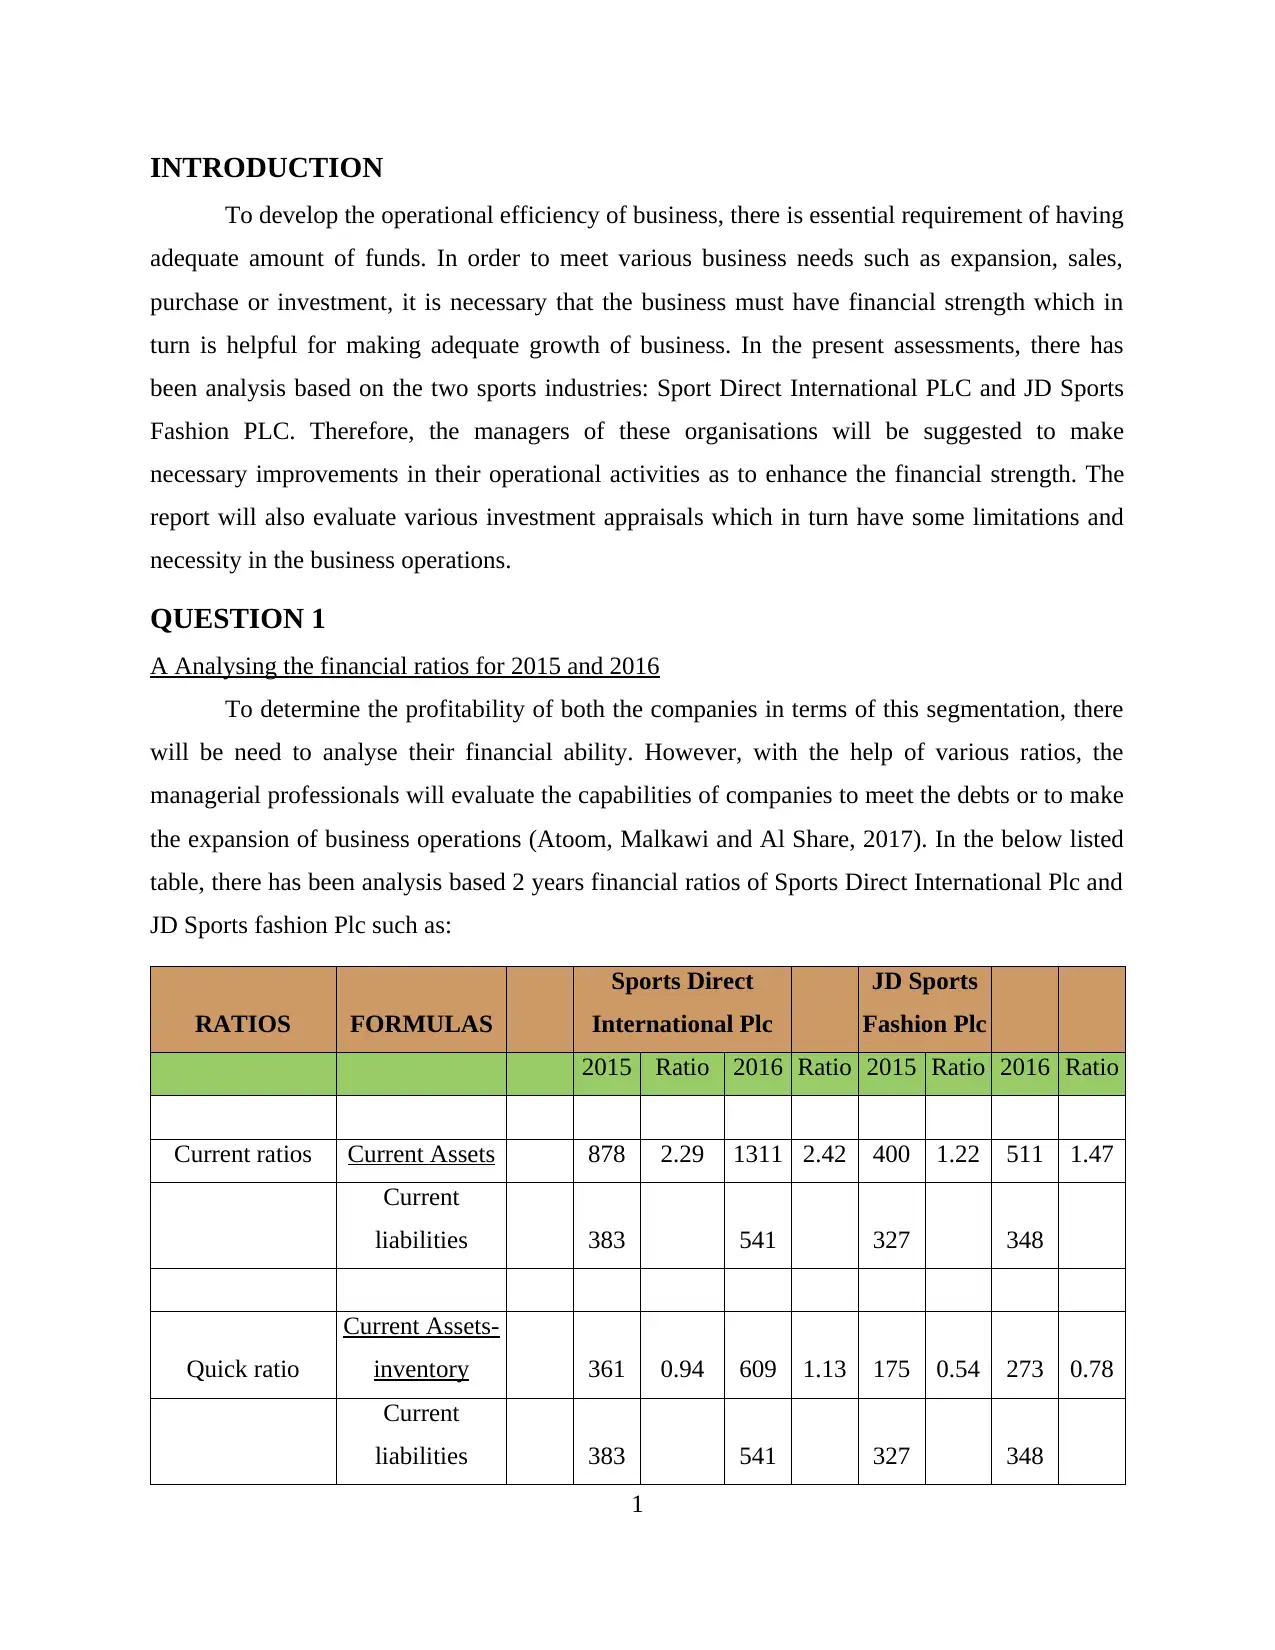
To determine the profitability of both the companies in terms of this segmentation, there
will be need to analyse their financial ability. However, with the help of various ratios, the
managerial professionals will evaluate the capabilities of companies to meet the debts or to make
the expansion of business operations (Atoom, Malkawi and Al Share, 2017). In the below listed
table, there has been analysis based 2 years financial ratios of Sports Direct International Plc and
JD Sports fashion Plc such as:
RATIOS FORMULAS
Sports Direct
International Plc
JD Sports
Fashion Plc
2015 Ratio 2016 Ratio 2015 Ratio 2016 Ratio
Current ratios Current Assets 878 2.29 1311 2.42 400 1.22 511 1.47
Current
liabilities 383 541 327 348
Quick ratio
Current Assets-
inventory 361 0.94 609 1.13 175 0.54 273 0.78
Current
liabilities 383 541 327 348
1
To develop the operational efficiency of business, there is essential requirement of having
adequate amount of funds. In order to meet various business needs such as expansion, sales,
purchase or investment, it is necessary that the business must have financial strength which in
turn is helpful for making adequate growth of business. In the present assessments, there has
been analysis based on the two sports industries: Sport Direct International PLC and JD Sports
Fashion PLC. Therefore, the managers of these organisations will be suggested to make
necessary improvements in their operational activities as to enhance the financial strength. The
report will also evaluate various investment appraisals which in turn have some limitations and
necessity in the business operations.
QUESTION 1
A Analysing the financial ratios for 2015 and 2016
To determine the profitability of both the companies in terms of this segmentation, there
will be need to analyse their financial ability. However, with the help of various ratios, the
managerial professionals will evaluate the capabilities of companies to meet the debts or to make
the expansion of business operations (Atoom, Malkawi and Al Share, 2017). In the below listed
table, there has been analysis based 2 years financial ratios of Sports Direct International Plc and
JD Sports fashion Plc such as:
RATIOS FORMULAS
Sports Direct
International Plc
JD Sports
Fashion Plc
2015 Ratio 2016 Ratio 2015 Ratio 2016 Ratio
Current ratios Current Assets 878 2.29 1311 2.42 400 1.22 511 1.47
Current
liabilities 383 541 327 348
Quick ratio
Current Assets-
inventory 361 0.94 609 1.13 175 0.54 273 0.78
Current
liabilities 383 541 327 348
1
⊘ This is a preview!⊘
Do you want full access?
Subscribe today to unlock all pages.
Trusted by 1+ million students worldwide
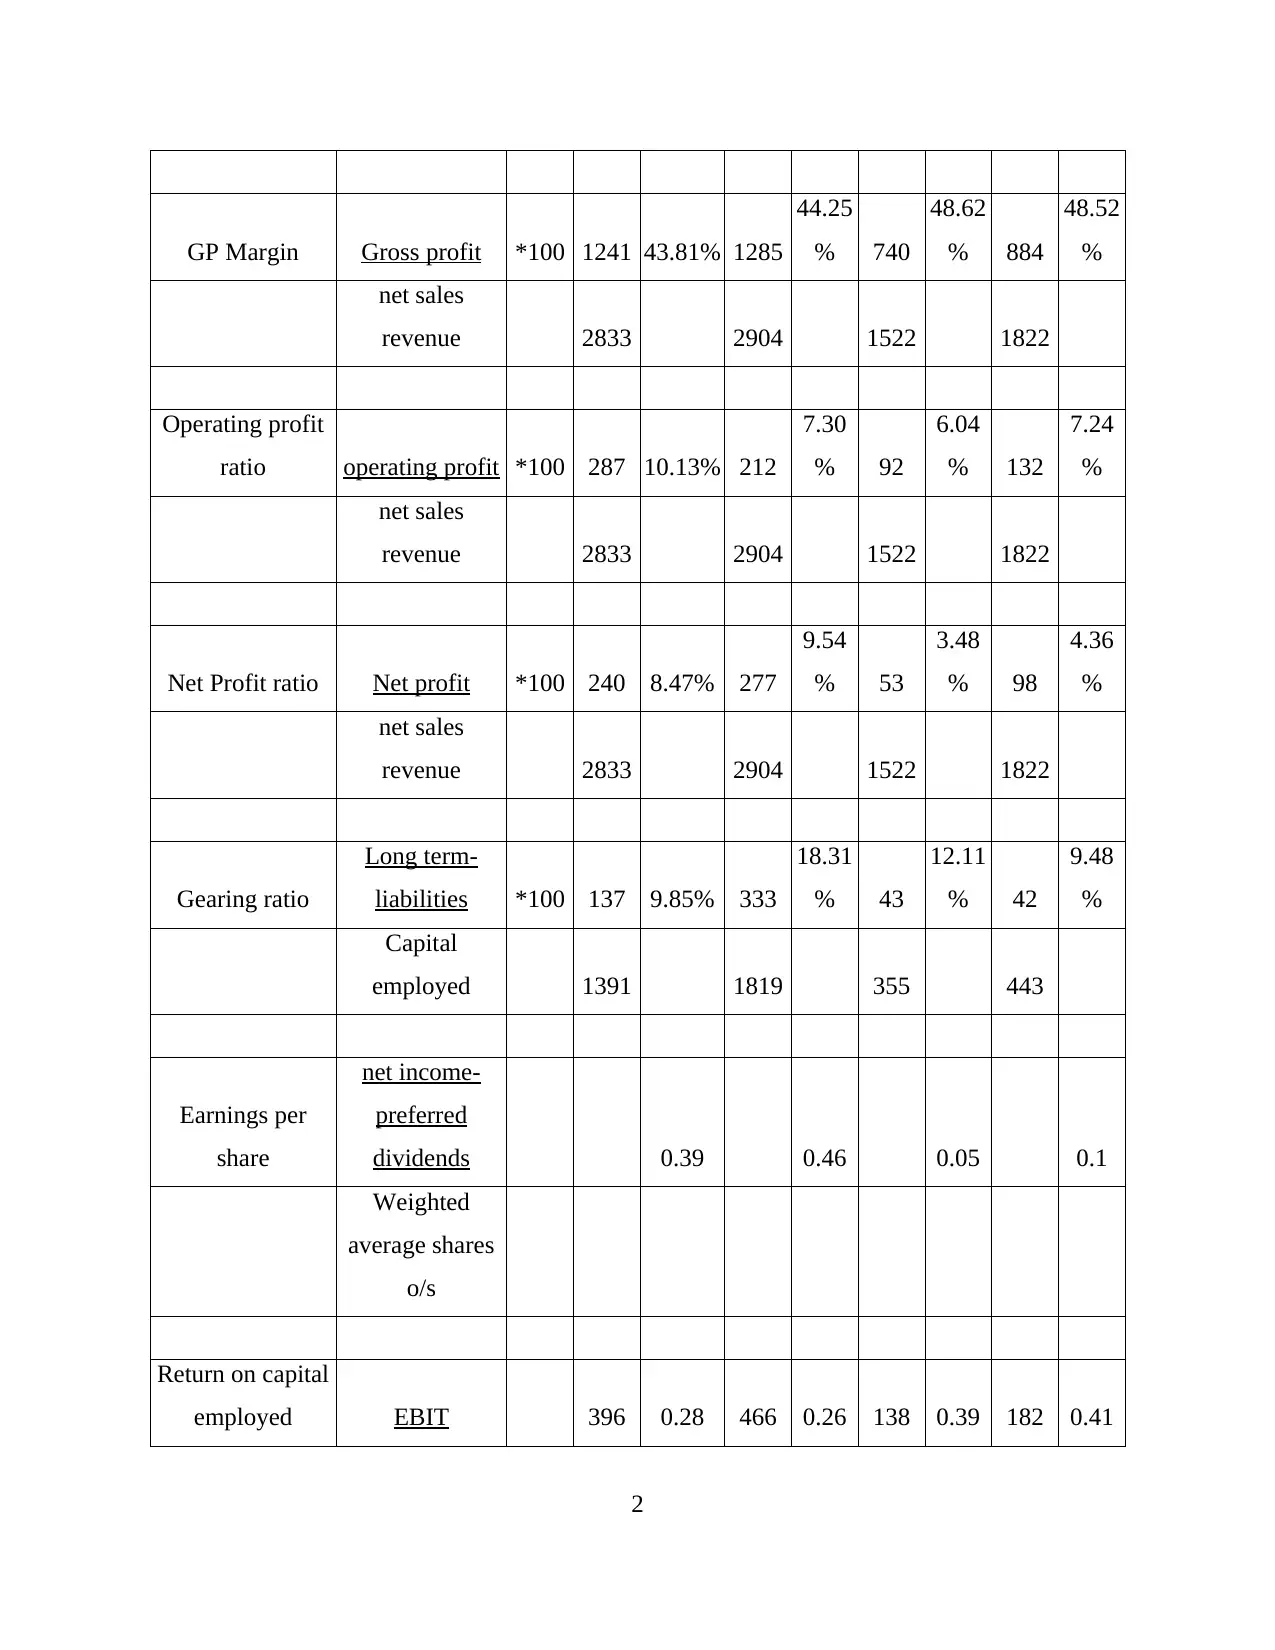
GP Margin Gross profit *100 1241 43.81% 1285
44.25
% 740
48.62
% 884
48.52
%
net sales
revenue 2833 2904 1522 1822
Operating profit
ratio operating profit *100 287 10.13% 212
7.30
% 92
6.04
% 132
7.24
%
net sales
revenue 2833 2904 1522 1822
Net Profit ratio Net profit *100 240 8.47% 277
9.54
% 53
3.48
% 98
4.36
%
net sales
revenue 2833 2904 1522 1822
Gearing ratio
Long term-
liabilities *100 137 9.85% 333
18.31
% 43
12.11
% 42
9.48
%
Capital
employed 1391 1819 355 443
Earnings per
share
net income-
preferred
dividends 0.39 0.46 0.05 0.1
Weighted
average shares
o/s
Return on capital
employed EBIT 396 0.28 466 0.26 138 0.39 182 0.41
2
Paraphrase This Document
Need a fresh take? Get an instant paraphrase of this document with our AI Paraphraser
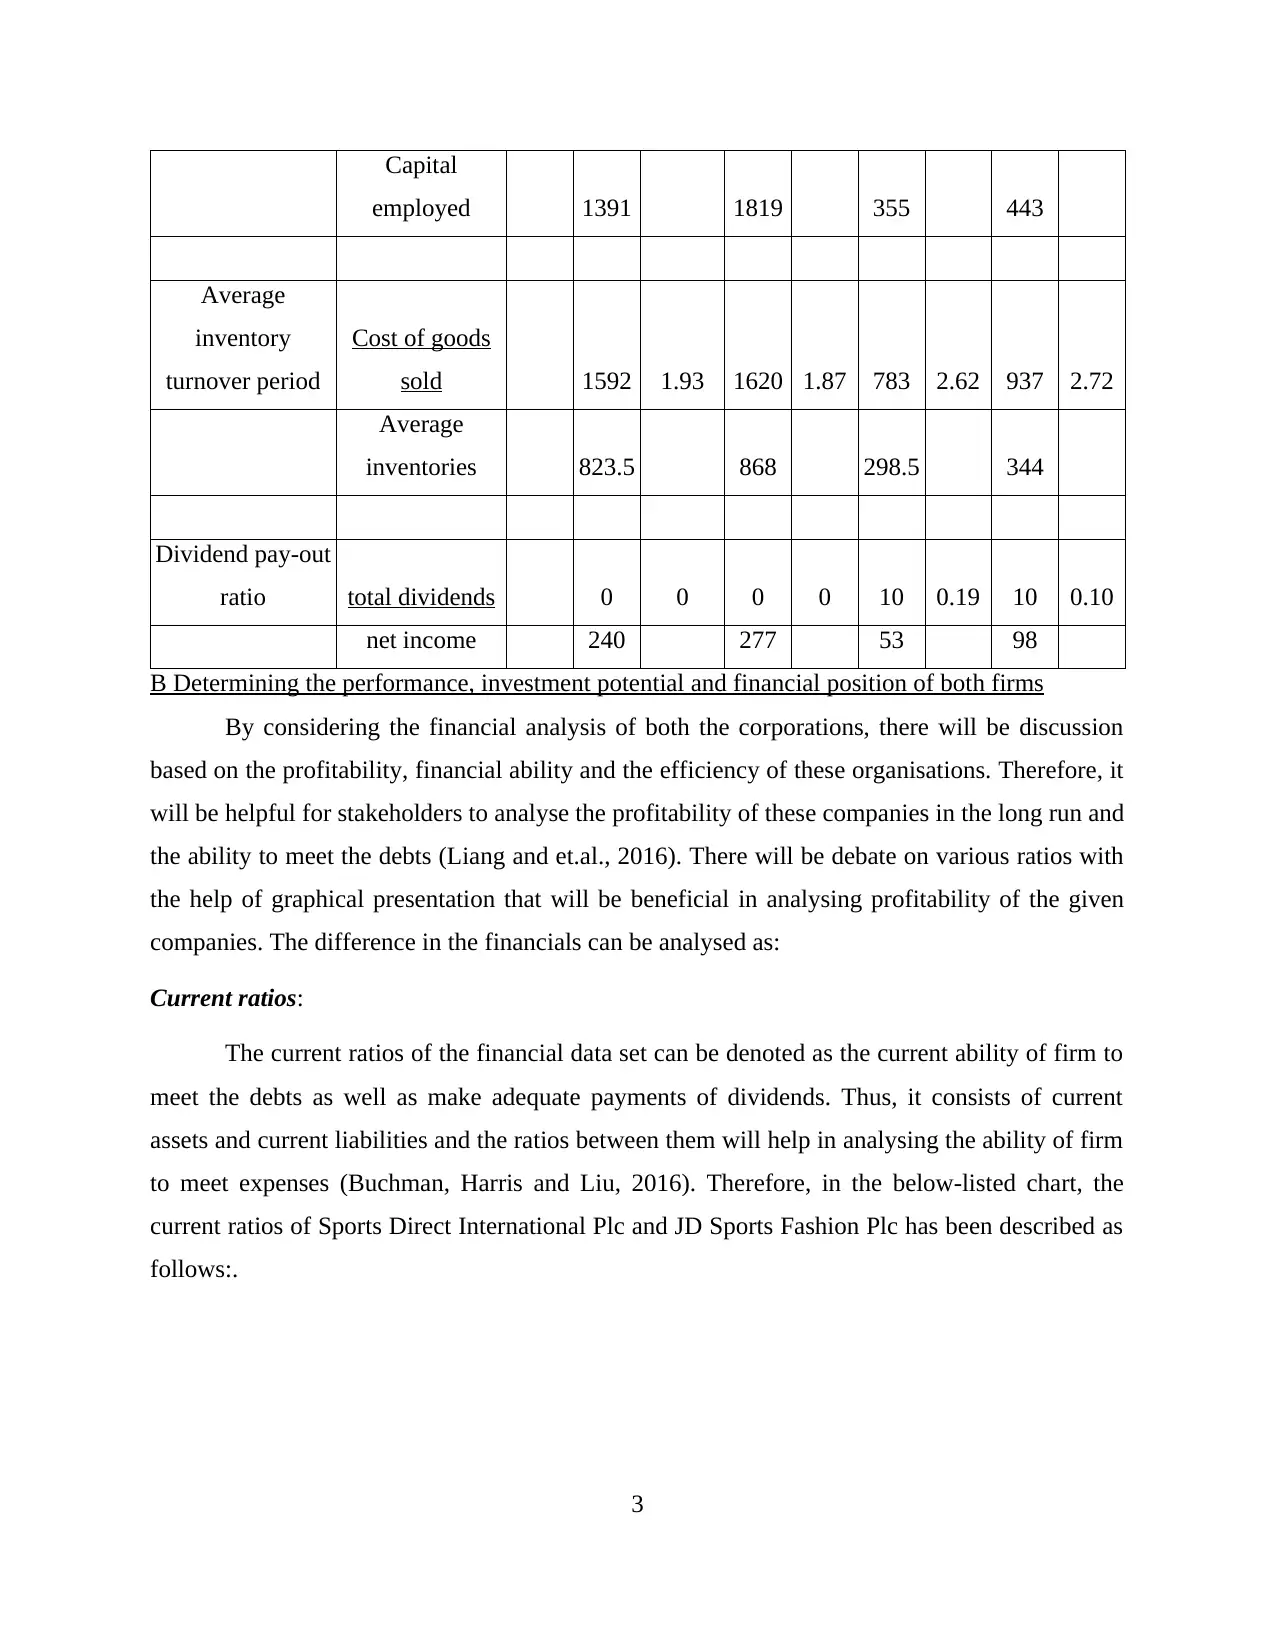
Capital
employed 1391 1819 355 443
Average
inventory
turnover period
Cost of goods
sold 1592 1.93 1620 1.87 783 2.62 937 2.72
Average
inventories 823.5 868 298.5 344
Dividend pay-out
ratio total dividends 0 0 0 0 10 0.19 10 0.10
net income 240 277 53 98
B Determining the performance, investment potential and financial position of both firms
By considering the financial analysis of both the corporations, there will be discussion
based on the profitability, financial ability and the efficiency of these organisations. Therefore, it
will be helpful for stakeholders to analyse the profitability of these companies in the long run and
the ability to meet the debts (Liang and et.al., 2016). There will be debate on various ratios with
the help of graphical presentation that will be beneficial in analysing profitability of the given
companies. The difference in the financials can be analysed as:
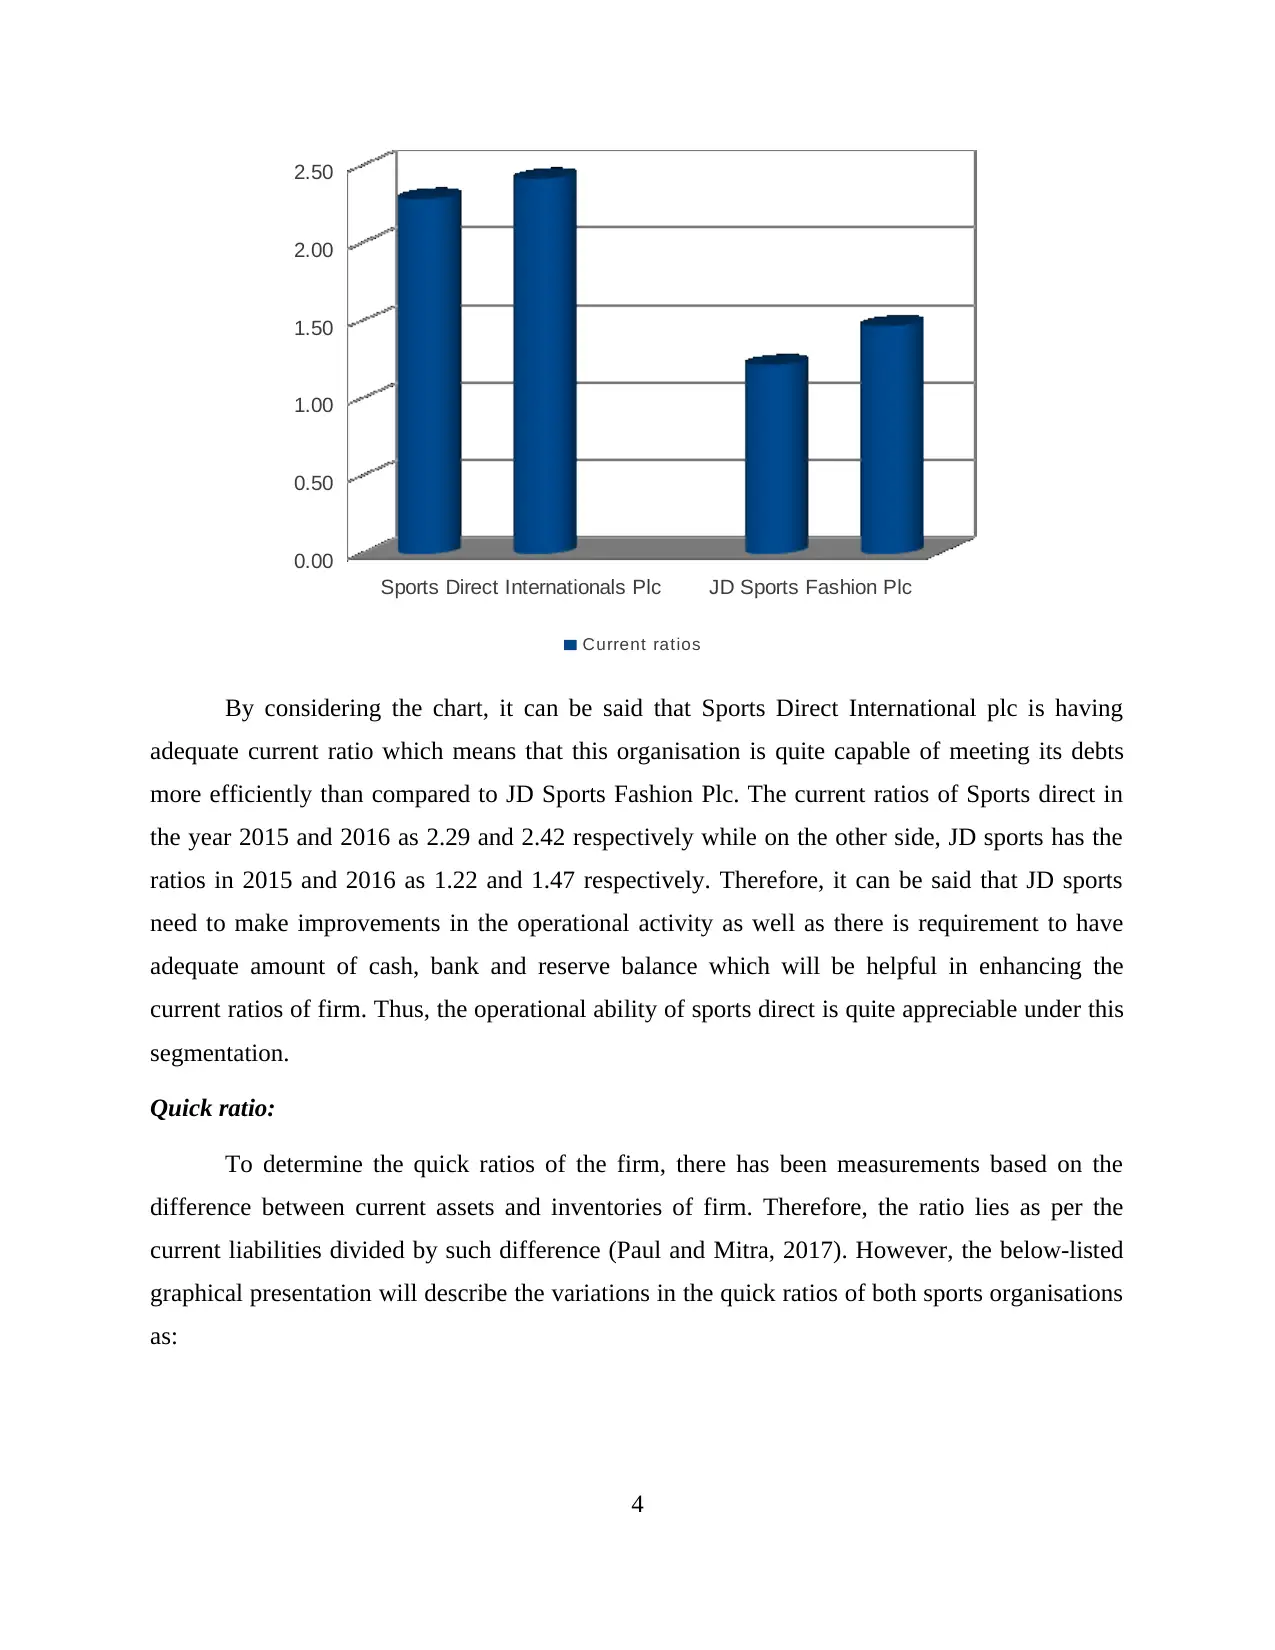
Current ratios:
The current ratios of the financial data set can be denoted as the current ability of firm to
meet the debts as well as make adequate payments of dividends. Thus, it consists of current
assets and current liabilities and the ratios between them will help in analysing the ability of firm
to meet expenses (Buchman, Harris and Liu, 2016). Therefore, in the below-listed chart, the
current ratios of Sports Direct International Plc and JD Sports Fashion Plc has been described as
follows:.
3
employed 1391 1819 355 443
Average
inventory
turnover period
Cost of goods
sold 1592 1.93 1620 1.87 783 2.62 937 2.72
Average
inventories 823.5 868 298.5 344
Dividend pay-out
ratio total dividends 0 0 0 0 10 0.19 10 0.10
net income 240 277 53 98
B Determining the performance, investment potential and financial position of both firms
By considering the financial analysis of both the corporations, there will be discussion
based on the profitability, financial ability and the efficiency of these organisations. Therefore, it
will be helpful for stakeholders to analyse the profitability of these companies in the long run and
the ability to meet the debts (Liang and et.al., 2016). There will be debate on various ratios with
the help of graphical presentation that will be beneficial in analysing profitability of the given
companies. The difference in the financials can be analysed as:
Current ratios:
The current ratios of the financial data set can be denoted as the current ability of firm to
meet the debts as well as make adequate payments of dividends. Thus, it consists of current
assets and current liabilities and the ratios between them will help in analysing the ability of firm
to meet expenses (Buchman, Harris and Liu, 2016). Therefore, in the below-listed chart, the
current ratios of Sports Direct International Plc and JD Sports Fashion Plc has been described as
follows:.
3
Sports Direct Internationals Plc JD Sports Fashion Plc
0.00
0.50
1.00
1.50
2.00
2.50
Current ratios
By considering the chart, it can be said that Sports Direct International plc is having
adequate current ratio which means that this organisation is quite capable of meeting its debts
more efficiently than compared to JD Sports Fashion Plc. The current ratios of Sports direct in
the year 2015 and 2016 as 2.29 and 2.42 respectively while on the other side, JD sports has the
ratios in 2015 and 2016 as 1.22 and 1.47 respectively. Therefore, it can be said that JD sports
need to make improvements in the operational activity as well as there is requirement to have
adequate amount of cash, bank and reserve balance which will be helpful in enhancing the
current ratios of firm. Thus, the operational ability of sports direct is quite appreciable under this
segmentation.
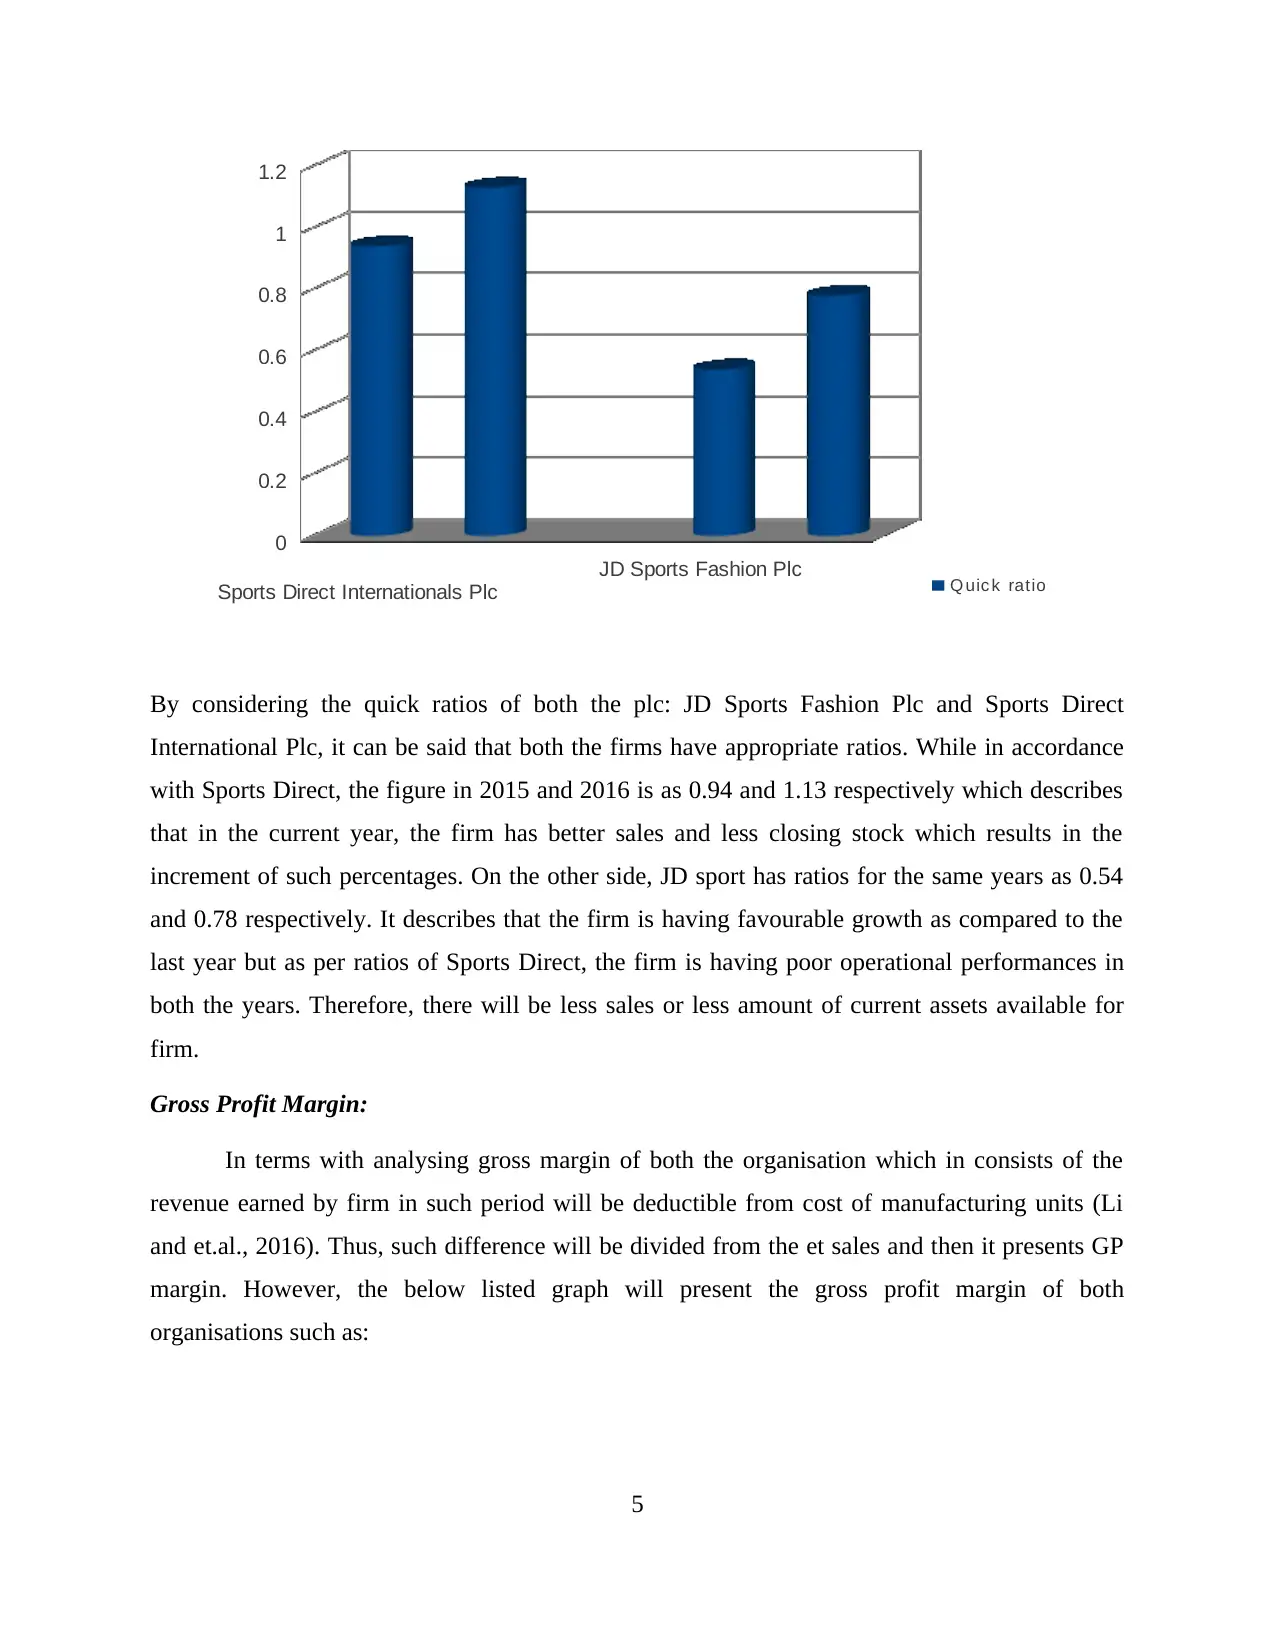
Quick ratio:
To determine the quick ratios of the firm, there has been measurements based on the
difference between current assets and inventories of firm. Therefore, the ratio lies as per the
current liabilities divided by such difference (Paul and Mitra, 2017). However, the below-listed
graphical presentation will describe the variations in the quick ratios of both sports organisations
as:
4
0.00
0.50
1.00
1.50
2.00
2.50
Current ratios
By considering the chart, it can be said that Sports Direct International plc is having
adequate current ratio which means that this organisation is quite capable of meeting its debts
more efficiently than compared to JD Sports Fashion Plc. The current ratios of Sports direct in
the year 2015 and 2016 as 2.29 and 2.42 respectively while on the other side, JD sports has the
ratios in 2015 and 2016 as 1.22 and 1.47 respectively. Therefore, it can be said that JD sports
need to make improvements in the operational activity as well as there is requirement to have
adequate amount of cash, bank and reserve balance which will be helpful in enhancing the
current ratios of firm. Thus, the operational ability of sports direct is quite appreciable under this
segmentation.
Quick ratio:
To determine the quick ratios of the firm, there has been measurements based on the
difference between current assets and inventories of firm. Therefore, the ratio lies as per the
current liabilities divided by such difference (Paul and Mitra, 2017). However, the below-listed
graphical presentation will describe the variations in the quick ratios of both sports organisations
as:
4
⊘ This is a preview!⊘
Do you want full access?
Subscribe today to unlock all pages.
Trusted by 1+ million students worldwide
Sports Direct Internationals Plc
JD Sports Fashion Plc
0
0.2
0.4
0.6
0.8
1
1.2
Q uic k ratio
By considering the quick ratios of both the plc: JD Sports Fashion Plc and Sports Direct
International Plc, it can be said that both the firms have appropriate ratios. While in accordance
with Sports Direct, the figure in 2015 and 2016 is as 0.94 and 1.13 respectively which describes
that in the current year, the firm has better sales and less closing stock which results in the
increment of such percentages. On the other side, JD sport has ratios for the same years as 0.54
and 0.78 respectively. It describes that the firm is having favourable growth as compared to the
last year but as per ratios of Sports Direct, the firm is having poor operational performances in
both the years. Therefore, there will be less sales or less amount of current assets available for
firm.
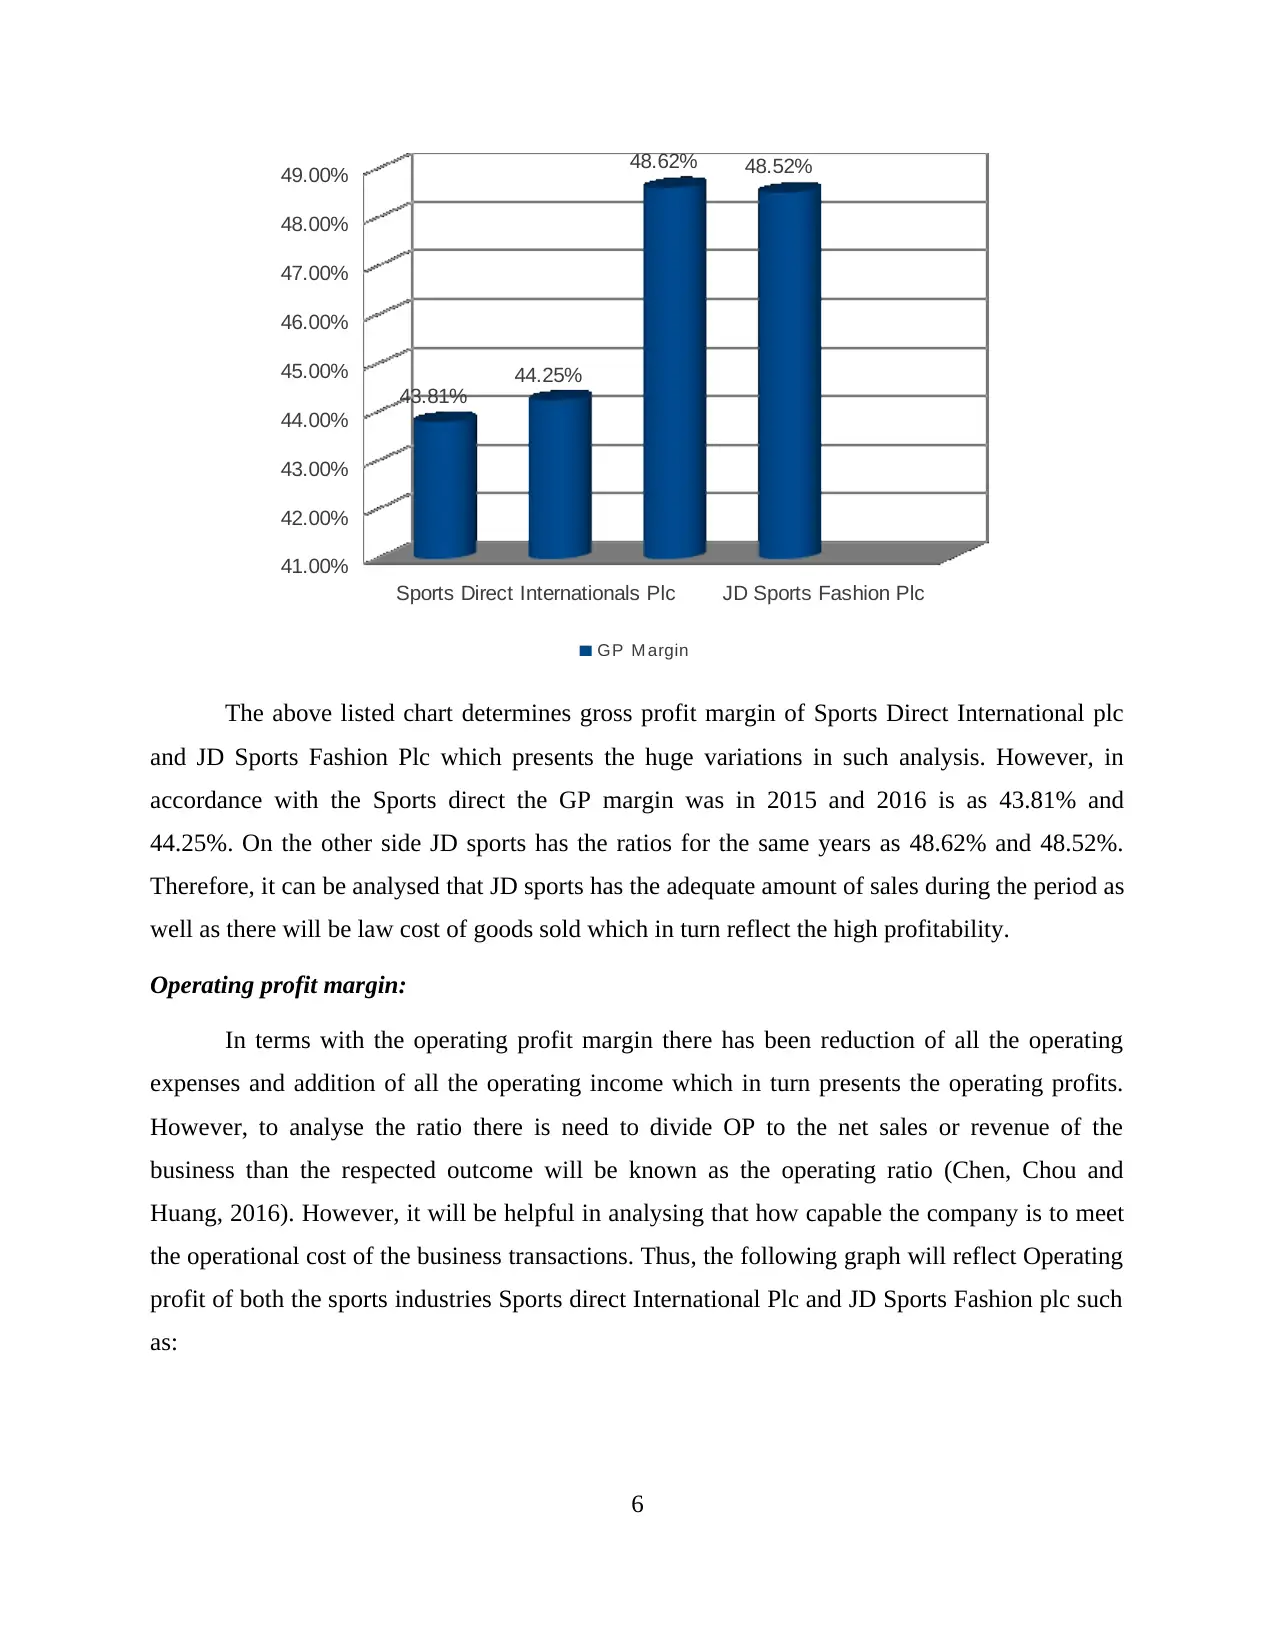
Gross Profit Margin:
In terms with analysing gross margin of both the organisation which in consists of the
revenue earned by firm in such period will be deductible from cost of manufacturing units (Li
and et.al., 2016). Thus, such difference will be divided from the et sales and then it presents GP
margin. However, the below listed graph will present the gross profit margin of both
organisations such as:
5
JD Sports Fashion Plc
0
0.2
0.4
0.6
0.8
1
1.2
Q uic k ratio
By considering the quick ratios of both the plc: JD Sports Fashion Plc and Sports Direct
International Plc, it can be said that both the firms have appropriate ratios. While in accordance
with Sports Direct, the figure in 2015 and 2016 is as 0.94 and 1.13 respectively which describes
that in the current year, the firm has better sales and less closing stock which results in the
increment of such percentages. On the other side, JD sport has ratios for the same years as 0.54
and 0.78 respectively. It describes that the firm is having favourable growth as compared to the
last year but as per ratios of Sports Direct, the firm is having poor operational performances in
both the years. Therefore, there will be less sales or less amount of current assets available for
firm.
Gross Profit Margin:
In terms with analysing gross margin of both the organisation which in consists of the
revenue earned by firm in such period will be deductible from cost of manufacturing units (Li
and et.al., 2016). Thus, such difference will be divided from the et sales and then it presents GP
margin. However, the below listed graph will present the gross profit margin of both
organisations such as:
5
Paraphrase This Document
Need a fresh take? Get an instant paraphrase of this document with our AI Paraphraser
Sports Direct Internationals Plc JD Sports Fashion Plc
41.00%
42.00%
43.00%
44.00%
45.00%
46.00%
47.00%
48.00%
49.00%
43.81%
44.25%
48.62% 48.52%
GP M argin
The above listed chart determines gross profit margin of Sports Direct International plc
and JD Sports Fashion Plc which presents the huge variations in such analysis. However, in
accordance with the Sports direct the GP margin was in 2015 and 2016 is as 43.81% and
44.25%. On the other side JD sports has the ratios for the same years as 48.62% and 48.52%.
Therefore, it can be analysed that JD sports has the adequate amount of sales during the period as
well as there will be law cost of goods sold which in turn reflect the high profitability.
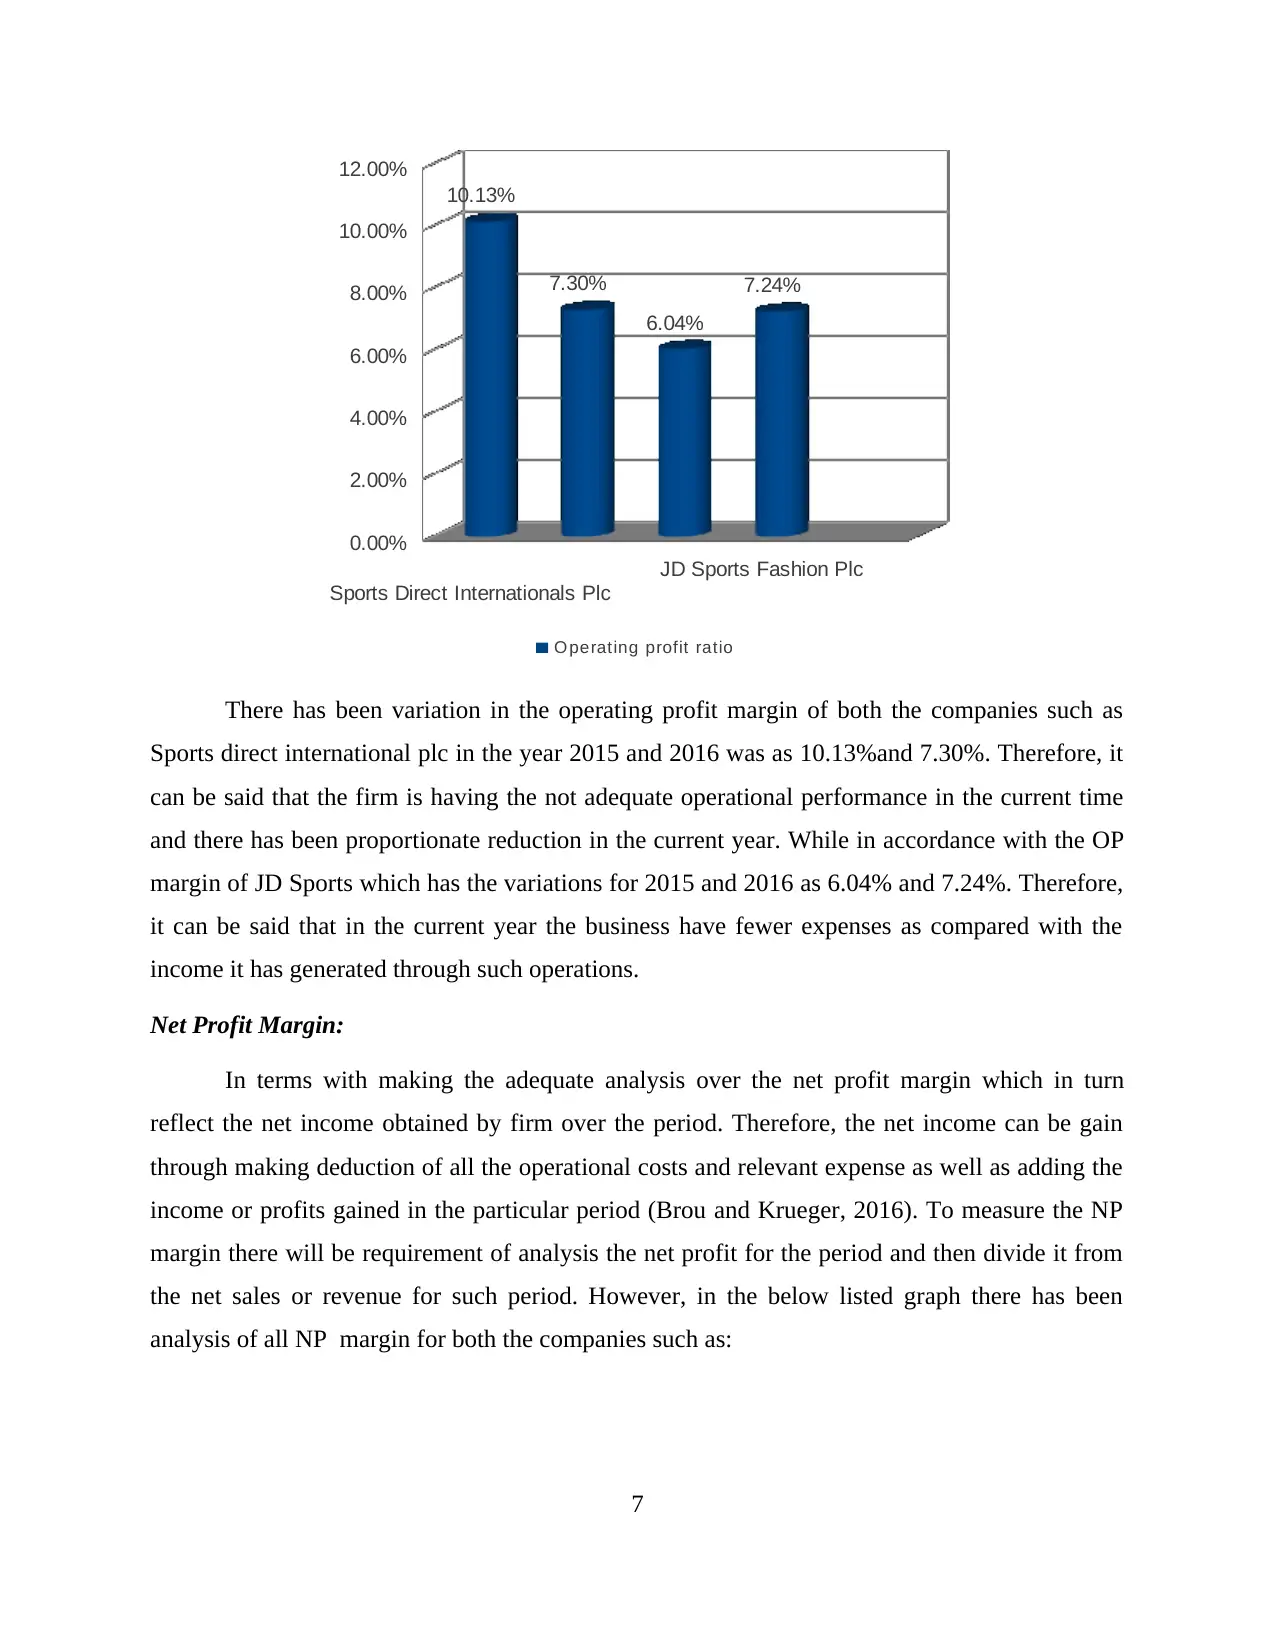
Operating profit margin:
In terms with the operating profit margin there has been reduction of all the operating
expenses and addition of all the operating income which in turn presents the operating profits.
However, to analyse the ratio there is need to divide OP to the net sales or revenue of the
business than the respected outcome will be known as the operating ratio (Chen, Chou and
Huang, 2016). However, it will be helpful in analysing that how capable the company is to meet
the operational cost of the business transactions. Thus, the following graph will reflect Operating
profit of both the sports industries Sports direct International Plc and JD Sports Fashion plc such
as:
6
41.00%
42.00%
43.00%
44.00%
45.00%
46.00%
47.00%
48.00%
49.00%
43.81%
44.25%
48.62% 48.52%
GP M argin
The above listed chart determines gross profit margin of Sports Direct International plc
and JD Sports Fashion Plc which presents the huge variations in such analysis. However, in
accordance with the Sports direct the GP margin was in 2015 and 2016 is as 43.81% and
44.25%. On the other side JD sports has the ratios for the same years as 48.62% and 48.52%.
Therefore, it can be analysed that JD sports has the adequate amount of sales during the period as
well as there will be law cost of goods sold which in turn reflect the high profitability.
Operating profit margin:
In terms with the operating profit margin there has been reduction of all the operating
expenses and addition of all the operating income which in turn presents the operating profits.
However, to analyse the ratio there is need to divide OP to the net sales or revenue of the
business than the respected outcome will be known as the operating ratio (Chen, Chou and
Huang, 2016). However, it will be helpful in analysing that how capable the company is to meet
the operational cost of the business transactions. Thus, the following graph will reflect Operating
profit of both the sports industries Sports direct International Plc and JD Sports Fashion plc such
as:
6
Sports Direct Internationals Plc
JD Sports Fashion Plc
0.00%
2.00%
4.00%
6.00%
8.00%
10.00%
12.00%
10.13%
7.30%
6.04%
7.24%
O perating profit ratio
There has been variation in the operating profit margin of both the companies such as
Sports direct international plc in the year 2015 and 2016 was as 10.13%and 7.30%. Therefore, it
can be said that the firm is having the not adequate operational performance in the current time
and there has been proportionate reduction in the current year. While in accordance with the OP
margin of JD Sports which has the variations for 2015 and 2016 as 6.04% and 7.24%. Therefore,
it can be said that in the current year the business have fewer expenses as compared with the
income it has generated through such operations.
Net Profit Margin:
In terms with making the adequate analysis over the net profit margin which in turn
reflect the net income obtained by firm over the period. Therefore, the net income can be gain
through making deduction of all the operational costs and relevant expense as well as adding the
income or profits gained in the particular period (Brou and Krueger, 2016). To measure the NP
margin there will be requirement of analysis the net profit for the period and then divide it from
the net sales or revenue for such period. However, in the below listed graph there has been
analysis of all NP margin for both the companies such as:
7
⊘ This is a preview!⊘
Do you want full access?
Subscribe today to unlock all pages.
Trusted by 1+ million students worldwide
Sports Direct Internationals Plc
JD Sports Fashion Plc
0.00%
1.00%
2.00%
3.00%
4.00%
5.00%
6.00%
7.00%
8.00%
9.00%
10.00%
8.47%
9.54%
3.48%
4.36%
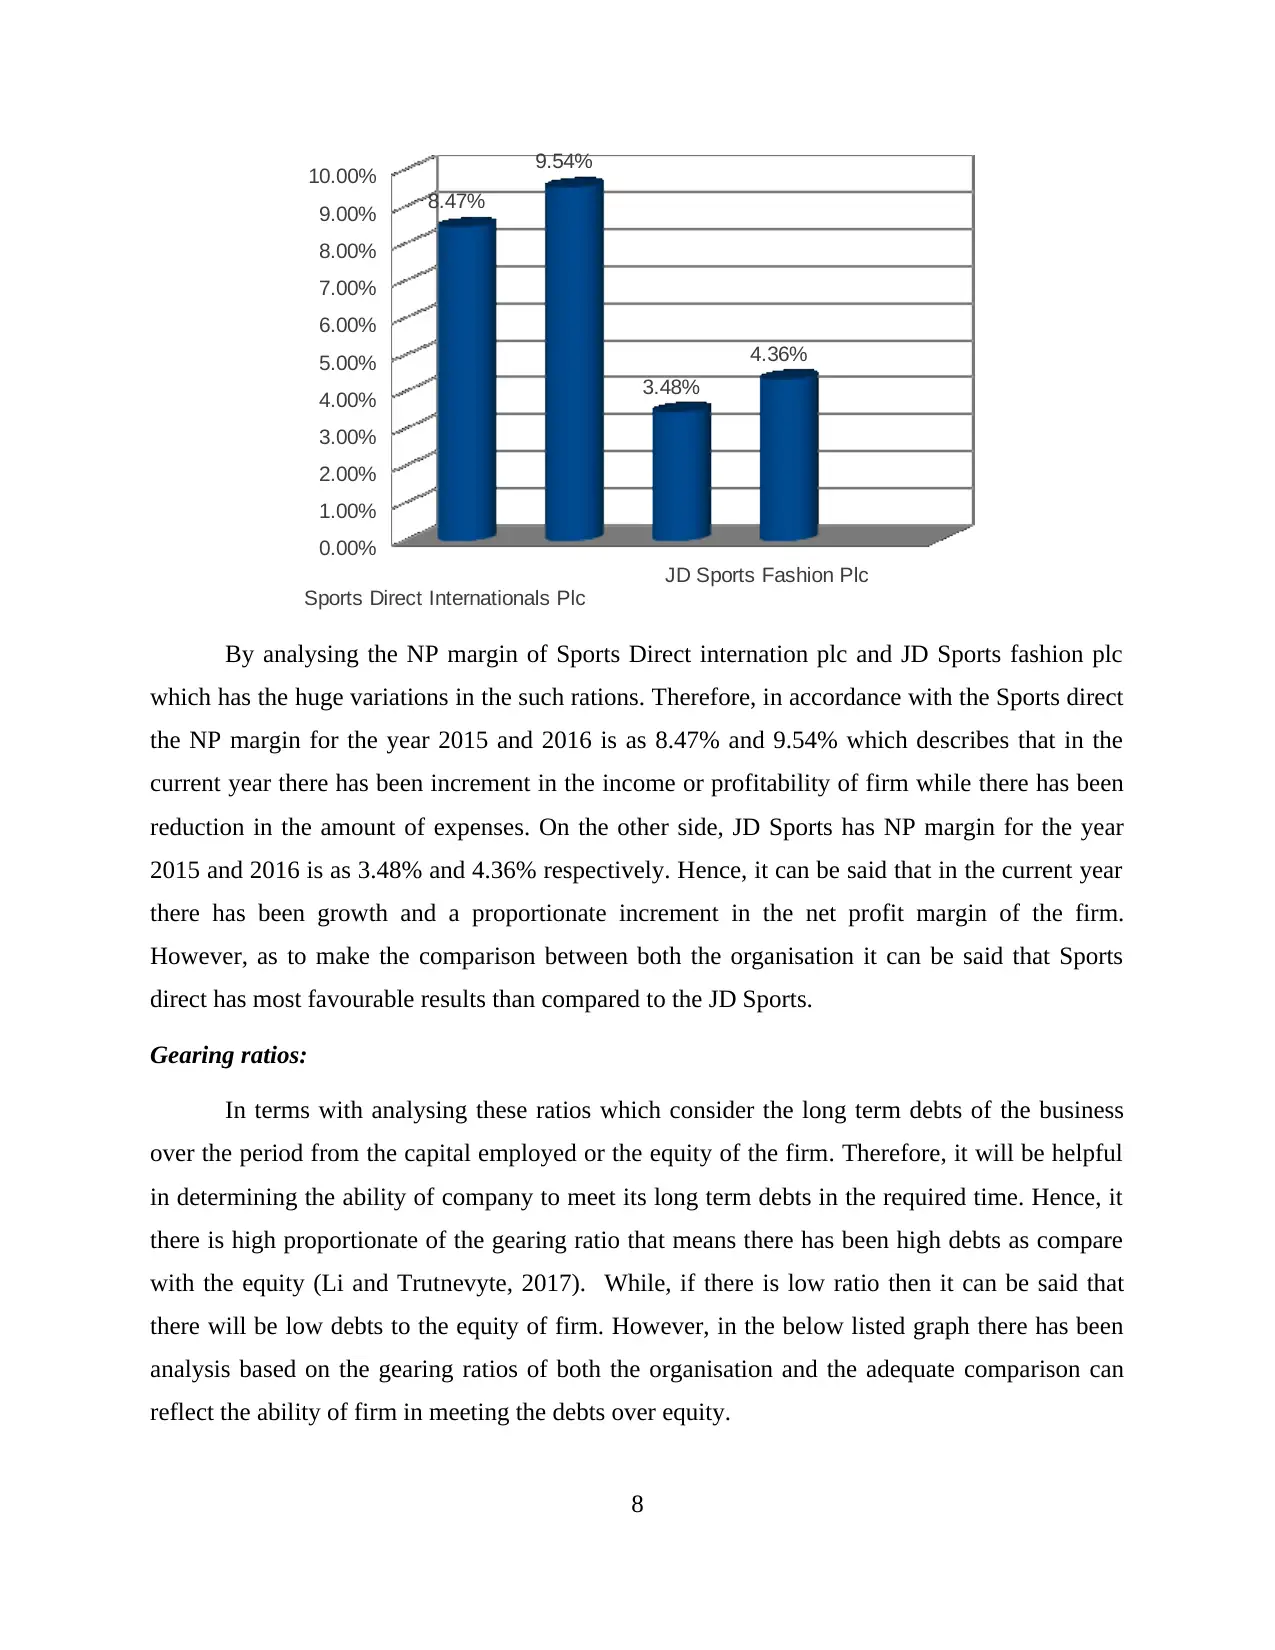
By analysing the NP margin of Sports Direct internation plc and JD Sports fashion plc
which has the huge variations in the such rations. Therefore, in accordance with the Sports direct
the NP margin for the year 2015 and 2016 is as 8.47% and 9.54% which describes that in the
current year there has been increment in the income or profitability of firm while there has been
reduction in the amount of expenses. On the other side, JD Sports has NP margin for the year
2015 and 2016 is as 3.48% and 4.36% respectively. Hence, it can be said that in the current year
there has been growth and a proportionate increment in the net profit margin of the firm.
However, as to make the comparison between both the organisation it can be said that Sports
direct has most favourable results than compared to the JD Sports.
Gearing ratios:
In terms with analysing these ratios which consider the long term debts of the business
over the period from the capital employed or the equity of the firm. Therefore, it will be helpful
in determining the ability of company to meet its long term debts in the required time. Hence, it
there is high proportionate of the gearing ratio that means there has been high debts as compare
with the equity (Li and Trutnevyte, 2017). While, if there is low ratio then it can be said that
there will be low debts to the equity of firm. However, in the below listed graph there has been
analysis based on the gearing ratios of both the organisation and the adequate comparison can
reflect the ability of firm in meeting the debts over equity.
8
JD Sports Fashion Plc
0.00%
1.00%
2.00%
3.00%
4.00%
5.00%
6.00%
7.00%
8.00%
9.00%
10.00%
8.47%
9.54%
3.48%
4.36%
By analysing the NP margin of Sports Direct internation plc and JD Sports fashion plc
which has the huge variations in the such rations. Therefore, in accordance with the Sports direct
the NP margin for the year 2015 and 2016 is as 8.47% and 9.54% which describes that in the
current year there has been increment in the income or profitability of firm while there has been
reduction in the amount of expenses. On the other side, JD Sports has NP margin for the year
2015 and 2016 is as 3.48% and 4.36% respectively. Hence, it can be said that in the current year
there has been growth and a proportionate increment in the net profit margin of the firm.
However, as to make the comparison between both the organisation it can be said that Sports
direct has most favourable results than compared to the JD Sports.
Gearing ratios:
In terms with analysing these ratios which consider the long term debts of the business
over the period from the capital employed or the equity of the firm. Therefore, it will be helpful
in determining the ability of company to meet its long term debts in the required time. Hence, it
there is high proportionate of the gearing ratio that means there has been high debts as compare
with the equity (Li and Trutnevyte, 2017). While, if there is low ratio then it can be said that
there will be low debts to the equity of firm. However, in the below listed graph there has been
analysis based on the gearing ratios of both the organisation and the adequate comparison can
reflect the ability of firm in meeting the debts over equity.
8
Paraphrase This Document
Need a fresh take? Get an instant paraphrase of this document with our AI Paraphraser
Sports Direct Internationals Plc
JD Sports Fashion Plc
0.00%
2.00%
4.00%
6.00%
8.00%
10.00%
12.00%
14.00%
16.00%
18.00%
20.00%
9.85%
18.31%
12.11%
9.48%
G earing ratio
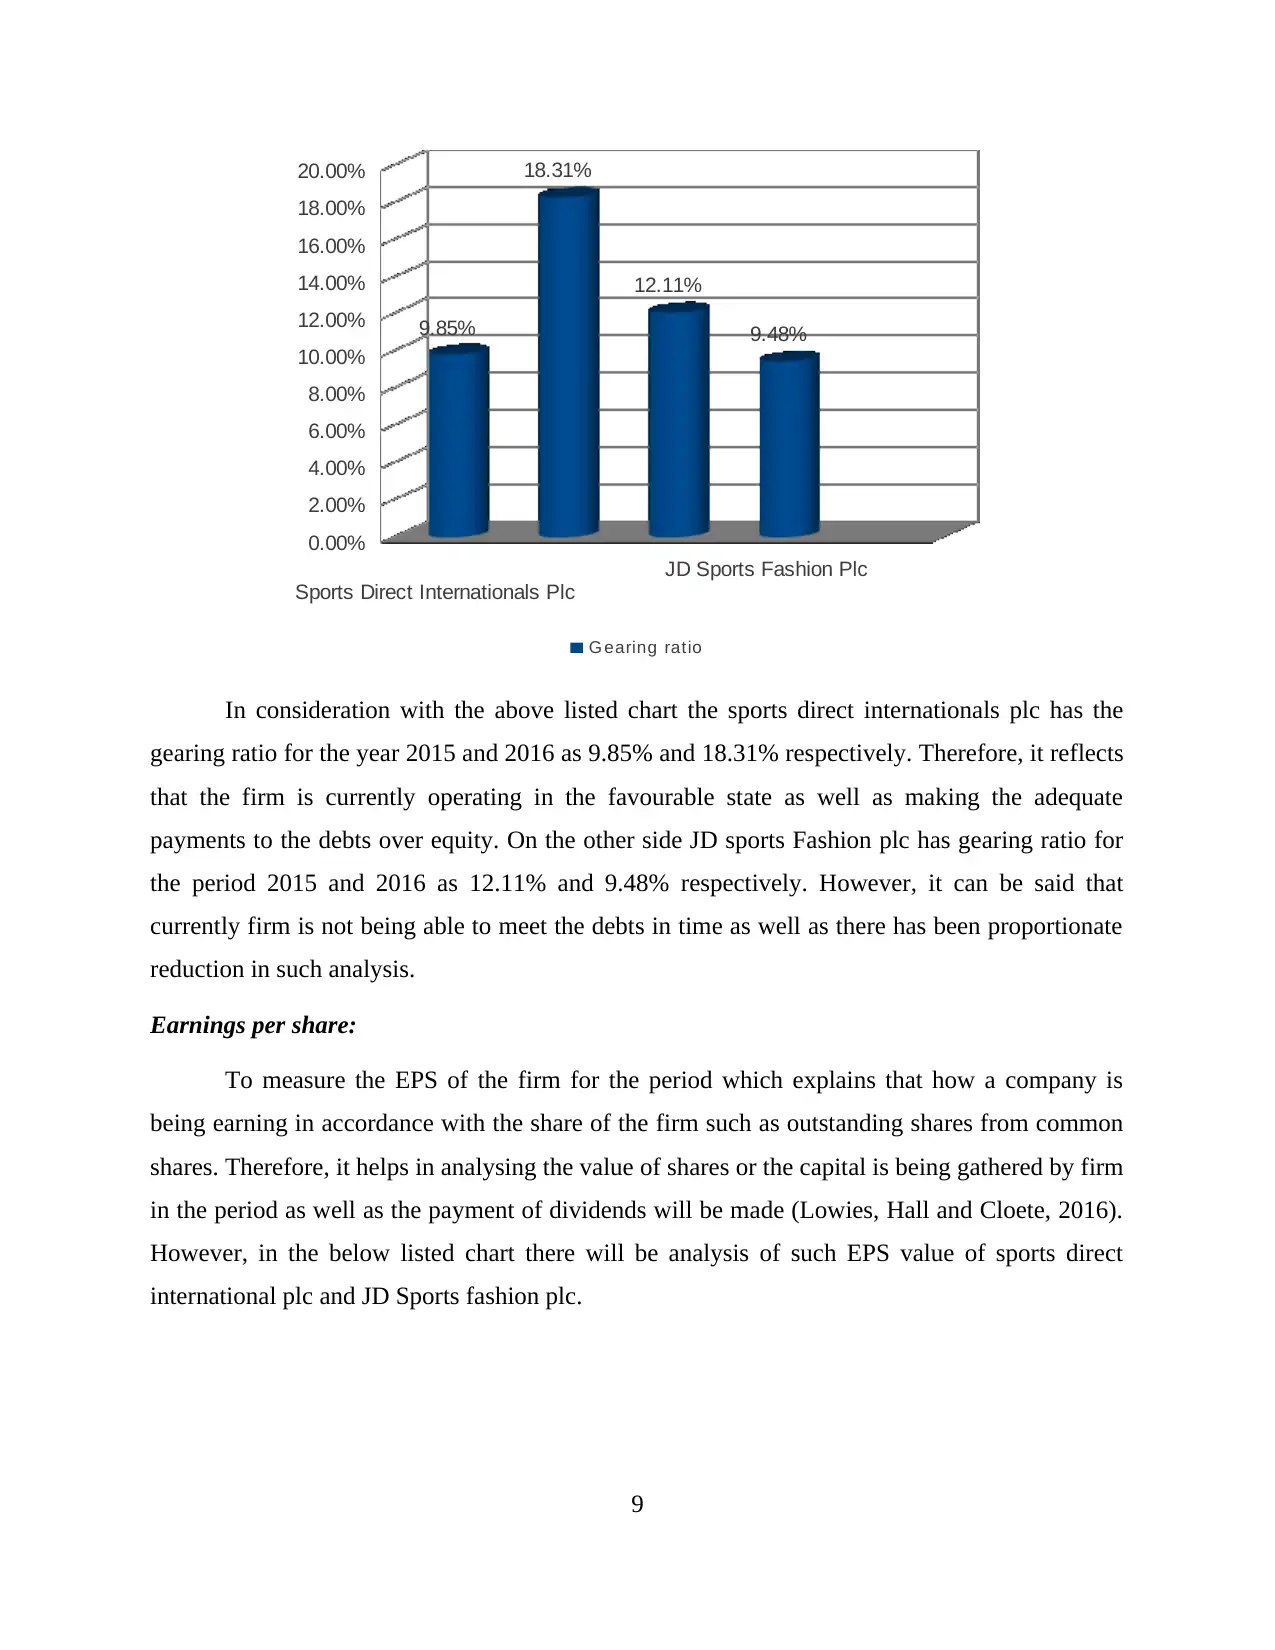
In consideration with the above listed chart the sports direct internationals plc has the
gearing ratio for the year 2015 and 2016 as 9.85% and 18.31% respectively. Therefore, it reflects
that the firm is currently operating in the favourable state as well as making the adequate
payments to the debts over equity. On the other side JD sports Fashion plc has gearing ratio for
the period 2015 and 2016 as 12.11% and 9.48% respectively. However, it can be said that
currently firm is not being able to meet the debts in time as well as there has been proportionate
reduction in such analysis.
Earnings per share:
To measure the EPS of the firm for the period which explains that how a company is
being earning in accordance with the share of the firm such as outstanding shares from common
shares. Therefore, it helps in analysing the value of shares or the capital is being gathered by firm
in the period as well as the payment of dividends will be made (Lowies, Hall and Cloete, 2016).
However, in the below listed chart there will be analysis of such EPS value of sports direct
international plc and JD Sports fashion plc.
9
JD Sports Fashion Plc
0.00%
2.00%
4.00%
6.00%
8.00%
10.00%
12.00%
14.00%
16.00%
18.00%
20.00%
9.85%
18.31%
12.11%
9.48%
G earing ratio
In consideration with the above listed chart the sports direct internationals plc has the
gearing ratio for the year 2015 and 2016 as 9.85% and 18.31% respectively. Therefore, it reflects
that the firm is currently operating in the favourable state as well as making the adequate
payments to the debts over equity. On the other side JD sports Fashion plc has gearing ratio for
the period 2015 and 2016 as 12.11% and 9.48% respectively. However, it can be said that
currently firm is not being able to meet the debts in time as well as there has been proportionate
reduction in such analysis.
Earnings per share:
To measure the EPS of the firm for the period which explains that how a company is
being earning in accordance with the share of the firm such as outstanding shares from common
shares. Therefore, it helps in analysing the value of shares or the capital is being gathered by firm
in the period as well as the payment of dividends will be made (Lowies, Hall and Cloete, 2016).
However, in the below listed chart there will be analysis of such EPS value of sports direct
international plc and JD Sports fashion plc.
9
Sports Direct Internationals Plc
JD Sports Fashion Plc
0
0.05
0.1
0.15
0.2
0.25
0.3
0.35
0.4
0.45
0.5
0.39
0.46
0.05
0.1
E arning per s hare
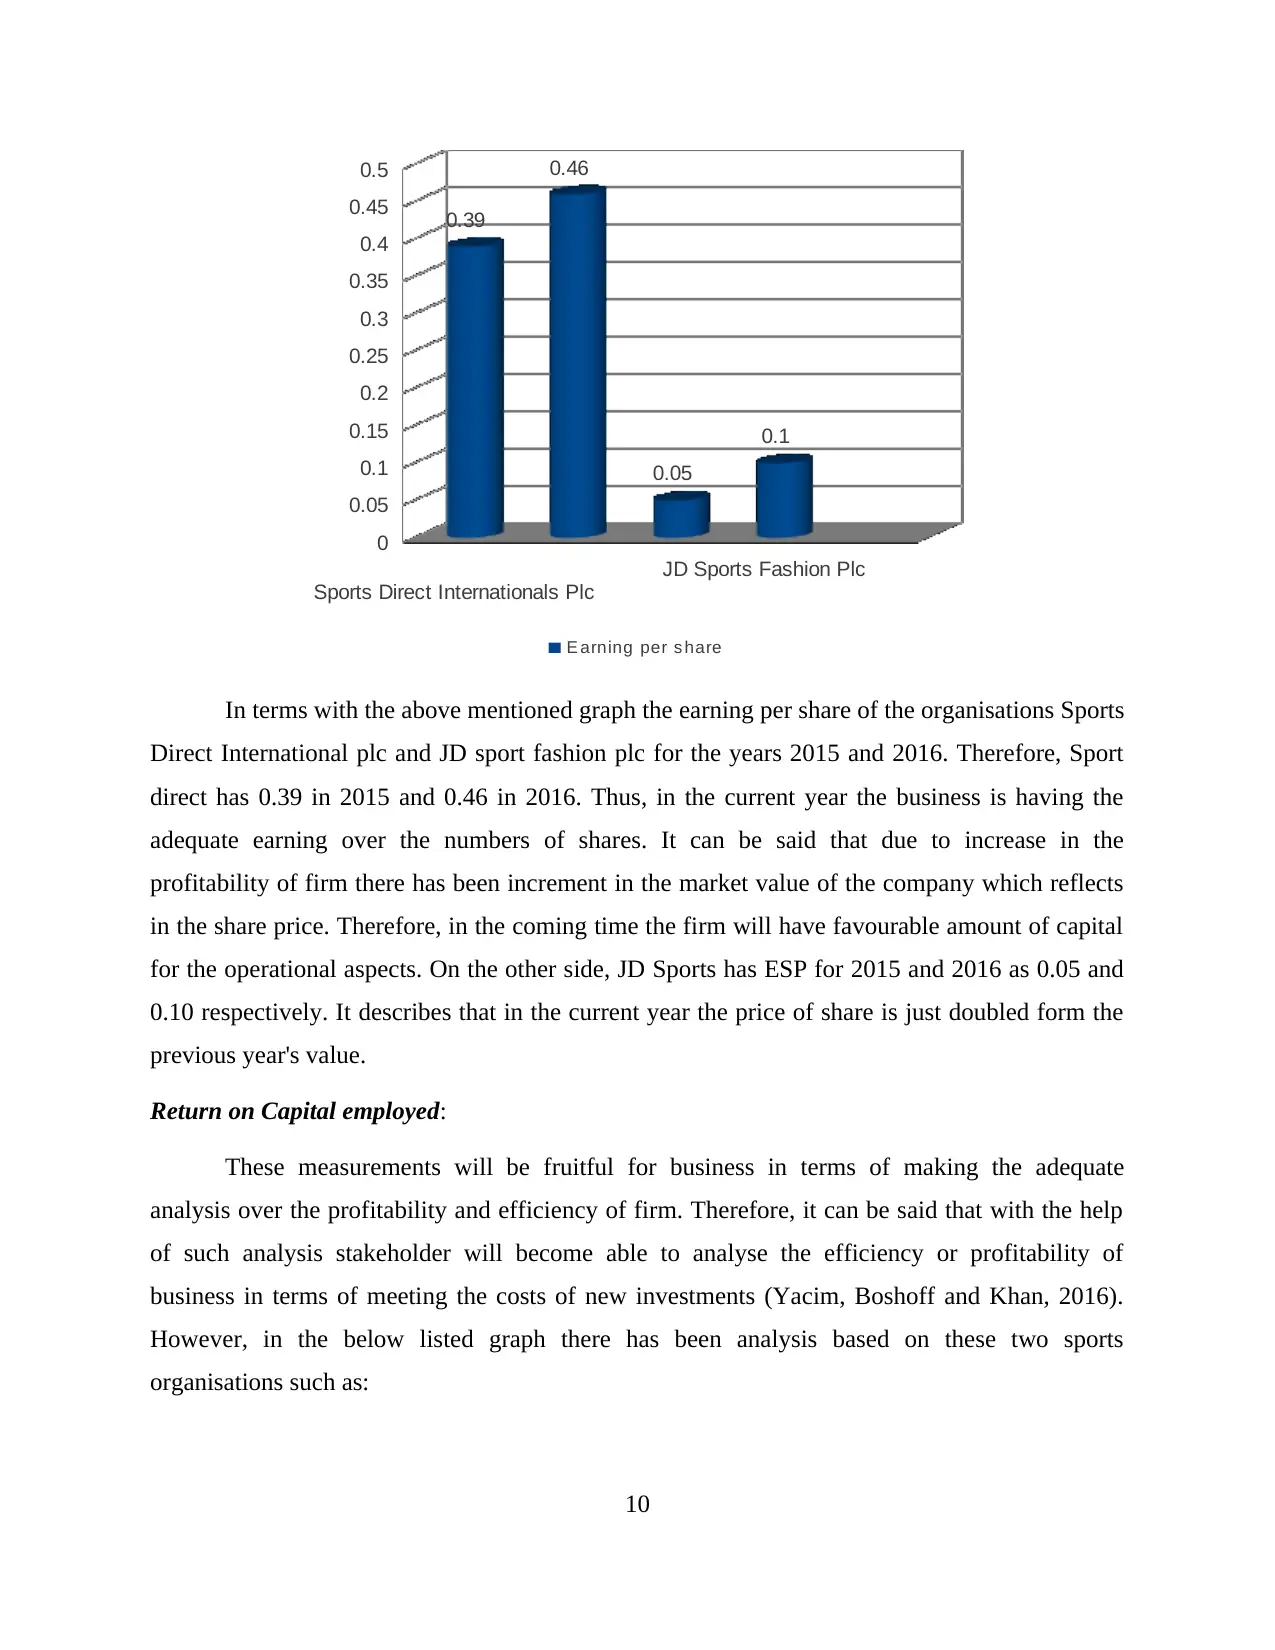
In terms with the above mentioned graph the earning per share of the organisations Sports
Direct International plc and JD sport fashion plc for the years 2015 and 2016. Therefore, Sport
direct has 0.39 in 2015 and 0.46 in 2016. Thus, in the current year the business is having the
adequate earning over the numbers of shares. It can be said that due to increase in the
profitability of firm there has been increment in the market value of the company which reflects
in the share price. Therefore, in the coming time the firm will have favourable amount of capital
for the operational aspects. On the other side, JD Sports has ESP for 2015 and 2016 as 0.05 and
0.10 respectively. It describes that in the current year the price of share is just doubled form the
previous year's value.
Return on Capital employed:
These measurements will be fruitful for business in terms of making the adequate
analysis over the profitability and efficiency of firm. Therefore, it can be said that with the help
of such analysis stakeholder will become able to analyse the efficiency or profitability of
business in terms of meeting the costs of new investments (Yacim, Boshoff and Khan, 2016).
However, in the below listed graph there has been analysis based on these two sports
organisations such as:
10
JD Sports Fashion Plc
0
0.05
0.1
0.15
0.2
0.25
0.3
0.35
0.4
0.45
0.5
0.39
0.46
0.05
0.1
E arning per s hare
In terms with the above mentioned graph the earning per share of the organisations Sports
Direct International plc and JD sport fashion plc for the years 2015 and 2016. Therefore, Sport
direct has 0.39 in 2015 and 0.46 in 2016. Thus, in the current year the business is having the
adequate earning over the numbers of shares. It can be said that due to increase in the
profitability of firm there has been increment in the market value of the company which reflects
in the share price. Therefore, in the coming time the firm will have favourable amount of capital
for the operational aspects. On the other side, JD Sports has ESP for 2015 and 2016 as 0.05 and
0.10 respectively. It describes that in the current year the price of share is just doubled form the
previous year's value.
Return on Capital employed:
These measurements will be fruitful for business in terms of making the adequate
analysis over the profitability and efficiency of firm. Therefore, it can be said that with the help
of such analysis stakeholder will become able to analyse the efficiency or profitability of
business in terms of meeting the costs of new investments (Yacim, Boshoff and Khan, 2016).
However, in the below listed graph there has been analysis based on these two sports
organisations such as:
10
⊘ This is a preview!⊘
Do you want full access?
Subscribe today to unlock all pages.
Trusted by 1+ million students worldwide
1 out of 20
Related Documents


Your All-in-One AI-Powered Toolkit for Academic Success.
+13062052269
info@desklib.com
Available 24*7 on WhatsApp / Email
![[object Object]](/_next/static/media/star-bottom.7253800d.svg)
Unlock your academic potential
Copyright © 2020–2026 A2Z Services. All Rights Reserved. Developed and managed by ZUCOL.