BABS Financial Analysis: Sports Direct UK Performance Review
VerifiedAdded on 2023/04/08
|22
|3356
|483
Report
AI Summary
This report provides a comprehensive financial analysis of Sports Direct UK using fundamental analysis and ratio analysis. It begins with an introduction to the company and its financial performance, followed by a detailed examination of various financial ratios, including profitability (Return on Assets, Net Profit Margin, Gross Profit Margin), liquidity (Current Ratio, Acid Test Ratio), working capital (Working Capital Ratio, Working Capital Turnover), capital structure (Debt to Equity Ratio, Debt Ratio), and stock market performance. The analysis assesses the company's ability to manage its assets, meet short-term obligations, and maintain a healthy capital structure. The report also discusses the limitations of ratio analysis, such as inflationary impacts, difficulties in industry comparisons, and differences in accounting methods. The conclusion summarizes the key findings and their implications for Sports Direct UK's financial health and future prospects.

FINANCIAL
MANAGEMENT
MANAGEMENT
Paraphrase This Document
Need a fresh take? Get an instant paraphrase of this document with our AI Paraphraser
Sports Direct UK
Executive Summary
When it comes to the point of financial analysis, the best method that can be followed is
fundamental analysis. It helps in knowing the performance of the company and helps to
ascertain the current position. Ratio analysis is used as a tool for financial comparison. In this
report, Sports Direct UK is considered for the purpose of report and analysis is done on the
same. The report initiates with the introduction followed by financial performance. It then
stresses the financial ratio that pertains to profitability, liquidity, working capital
management, capital structure, and stock market performance. Lastly, a discussion on the
deficiency of the ratio analysis is being done followed by the conclusion.
2
Sports Direct UK
Contents
Introduction...........................................................................................................................................6
Financial performance...........................................................................................................................6
1. Profitability ratio............................................................................................................................8
Return on Assets............................................................................................................................8
Net profit margin...........................................................................................................................9
Gross profit margin......................................................................................................................10
2. Liquidity.......................................................................................................................................10
Current ratio................................................................................................................................10
Acid test ratio..............................................................................................................................11
3. Working capital............................................................................................................................12
Working capital ratio...................................................................................................................12
Working capital turnover.............................................................................................................13
4. Capital Structure..........................................................................................................................14
Debt to equity ratio.....................................................................................................................14
Debt ratio.....................................................................................................................................14
5. Stock market performance..........................................................................................................15
Limitation of Ratio Analysis.................................................................................................................17
Inflationary impact......................................................................................................................17
Comparison with different industry is difficult............................................................................17
The difference in accounting methods........................................................................................17
Conclusion...........................................................................................................................................19
References...........................................................................................................................................20
Appendix.............................................................................................................................................22
3
⊘ This is a preview!⊘
Do you want full access?
Subscribe today to unlock all pages.
Trusted by 1+ million students worldwide
Sports Direct UK
Introduction
Sports Direct International Plc was founded by Michael James Wallace Ashley in 1982. Its
headquarters are in Shirebrook, UK. It deals in retailing of sports items. It retails in not just
sports brands but also fashion and lifestyle brands. The company performs in three segments
namely Sports Retail, Premium Lifestyle, and Brands. The Sports Retail segment is engaged
in the supply of sports and leisure equipment and apparel (Sports Direct UK., 2018). The
Premium Lifestyle segment provides a wide range of clothing, footwear, and accessories
from luxury retail brands. The Brands segment is all about the wholesale, licensing, and
distribution of the company’s own brand along with the third party brands which are then
sold to sports retails and premium lifestyle products.
Financial performance
The Group revenue of Sports Direct International Plc increased by 3.5 percent excluding
acquisitions, disposals on its 1st week. The same increased by 0.7 percent on a currency
neutral basis on 53rd week.
The UK Sports Retail revenue of Sports Direct International Plc decreased by 2.0 percent on
its first week excluding disposals and acquisitions. The same decreased by 0.3 percent on the
53rd week. Also, there was a fall of 0.6 percent in UK Sports Retail like-for-like stores gross
contribution. The revenue fell by 0.1 percent in European Sports Retail (formerly
International Retail) of Sports Direct International Plc excluding its acquisitions. The same
decreased by 3.2 percent on the 53rd week. Also, there was a fall by 2.0 percent in European
Sports Retail (formerly International Retail) like-for-like stores gross contribution (Sports
Direct UK., 2018).
On account of online sales and an increased store portfolio the Premium Lifestyle Retail
revenue increased by 42.7%. On the other hand, due to the acquisition of Bob’s Stores and
Eastern Mountain Sports, and increased inventory provisions there was an acquisition
accounting. This hampered the Group gross margin by allowing it to fall down from 41.0
percent to 39.7 percent.
4
Paraphrase This Document
Need a fresh take? Get an instant paraphrase of this document with our AI Paraphraser
Sports Direct UK
There was a noticeable increment in free cash flow (pre-capex) as the same increased from
£257.4 million to increase from £326.2 million dollars. There was a 12.2 percent increase in
Group underlying EBITDA. The same after an increase of 12.2 percent is about £306.1
million. The underlying Profit before tax increased to £152.9 million after a rise of at least
34.5 percent. The reported profit before tax came down from £281.6 million to £77.5 million
because of mainly two reasons (Sports Direct UK, 2018). First being the prior year
investment income from the sale of JD Sports shares and disposal of the Dunlop brand while
second being Debenhams strategic investment that impacted the company to suffer from a
loss of not less than £85.4 million.
Also, the reported earnings per share came down to 4.6p for the rise in underlying basic
earnings per share of about 19.9p. The Reported profit after tax came down to £27.6 million
from £231.7 million.
5
Sports Direct UK
1. Profitability ratio
Profitability ratio is determined through various types of ratios. Every organization focuses
on earning profits on its capital and with the help of return on capital employed it becomes
easier for the same to calculate and ascertain the amount of profit that has been yielded over a
period of time (Christensen, 2011). This also allows the investors to look for the profits
ascertained by an organization that enables them to make appropriate decisions regarding
making/adding investment in the same or reselling their held investments and switching to
another.
Return on assets indicates the efficiency with which the assets are put to use. When it comes
to return on assets, it indicates the efficiency of the company in using the assets...
Return on assets = Net income/ average assets
The above ratio helps the investors to assess the well being of an organization. The
profitability ratio can be evaluated in three stages that are the Return on Capital Employed,
Gross Profit Margin, and Net Profit Margin.
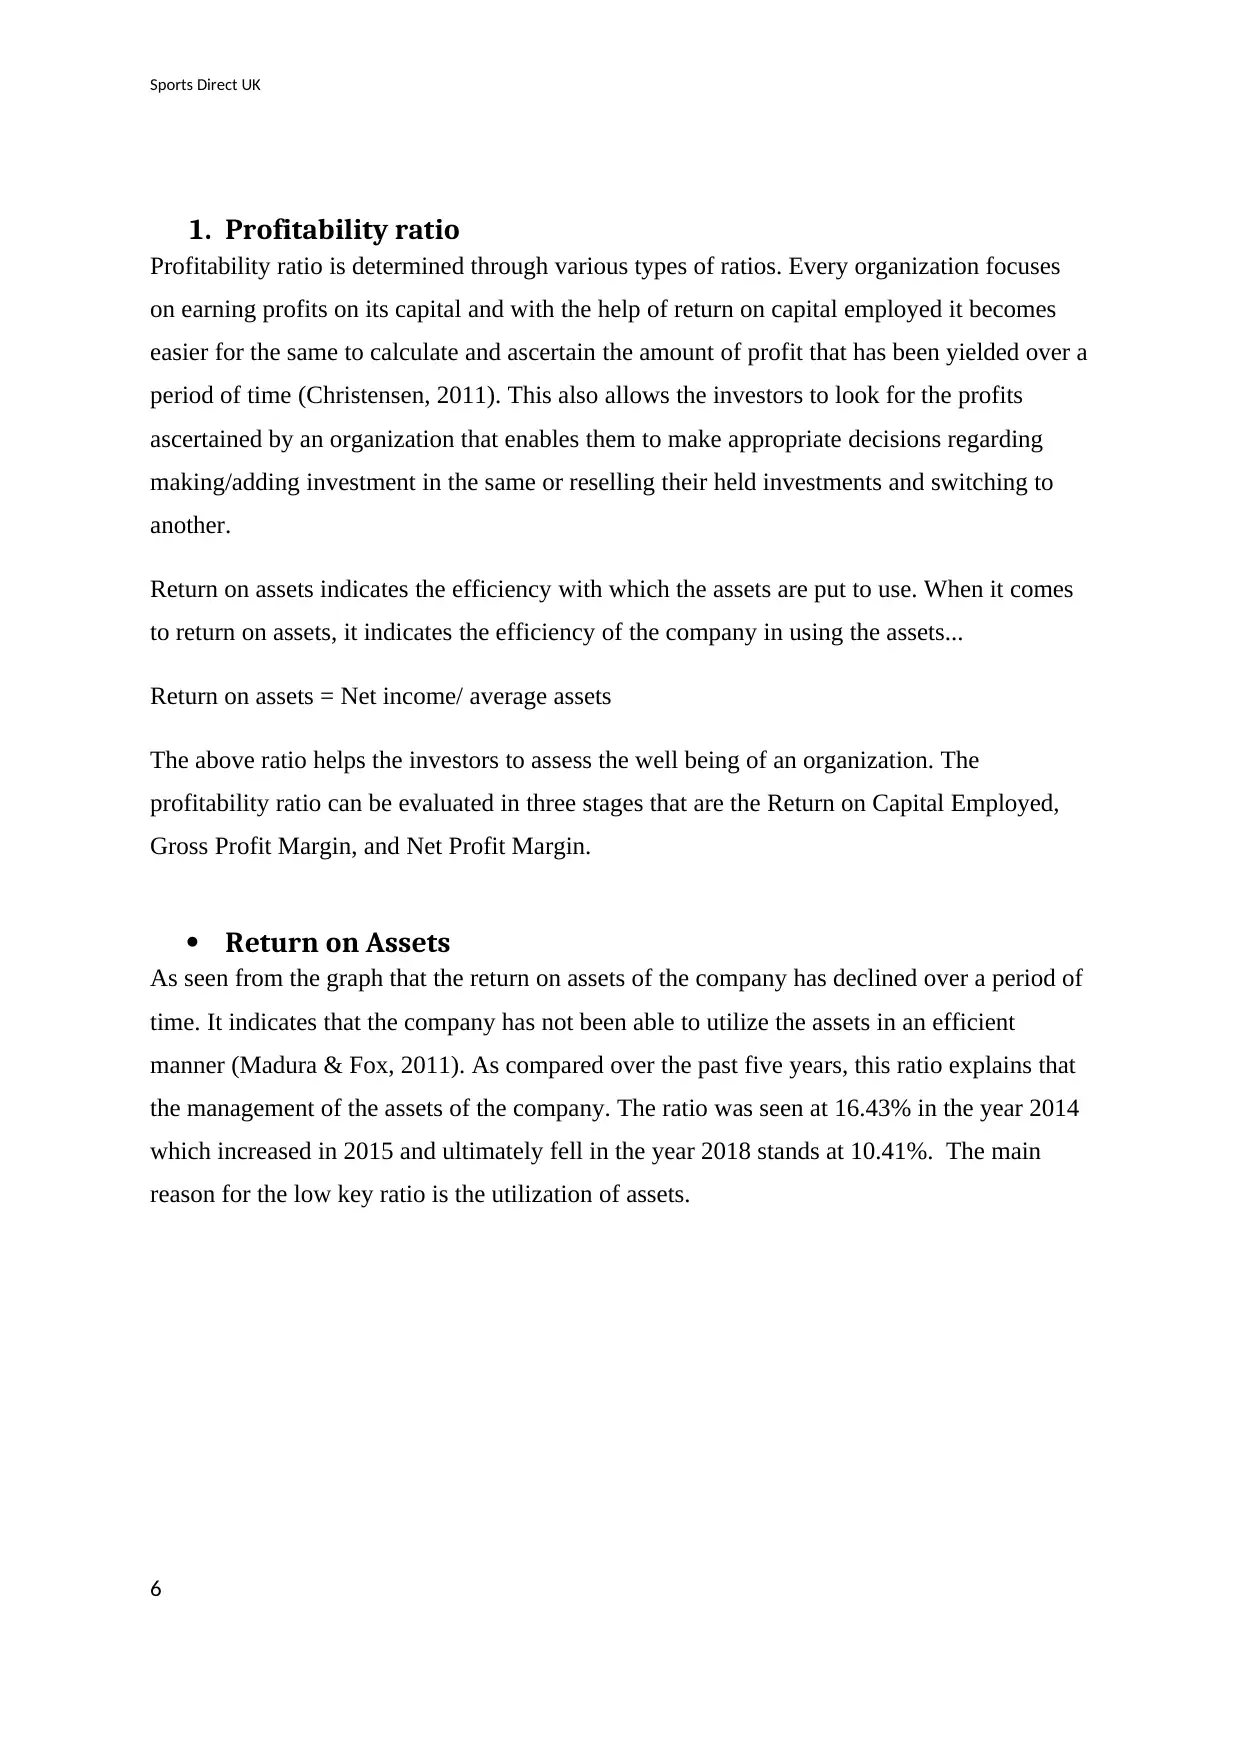
Return on Assets
As seen from the graph that the return on assets of the company has declined over a period of
time. It indicates that the company has not been able to utilize the assets in an efficient
manner (Madura & Fox, 2011). As compared over the past five years, this ratio explains that
the management of the assets of the company. The ratio was seen at 16.43% in the year 2014
which increased in 2015 and ultimately fell in the year 2018 stands at 10.41%. The main
reason for the low key ratio is the utilization of assets.
6
1. Profitability ratio
Profitability ratio is determined through various types of ratios. Every organization focuses
on earning profits on its capital and with the help of return on capital employed it becomes
easier for the same to calculate and ascertain the amount of profit that has been yielded over a
period of time (Christensen, 2011). This also allows the investors to look for the profits
ascertained by an organization that enables them to make appropriate decisions regarding
making/adding investment in the same or reselling their held investments and switching to
another.
Return on assets indicates the efficiency with which the assets are put to use. When it comes
to return on assets, it indicates the efficiency of the company in using the assets...
Return on assets = Net income/ average assets
The above ratio helps the investors to assess the well being of an organization. The
profitability ratio can be evaluated in three stages that are the Return on Capital Employed,
Gross Profit Margin, and Net Profit Margin.
Return on Assets
As seen from the graph that the return on assets of the company has declined over a period of
time. It indicates that the company has not been able to utilize the assets in an efficient
manner (Madura & Fox, 2011). As compared over the past five years, this ratio explains that
the management of the assets of the company. The ratio was seen at 16.43% in the year 2014
which increased in 2015 and ultimately fell in the year 2018 stands at 10.41%. The main
reason for the low key ratio is the utilization of assets.
6
⊘ This is a preview!⊘
Do you want full access?
Subscribe today to unlock all pages.
Trusted by 1+ million students worldwide
Sports Direct UK
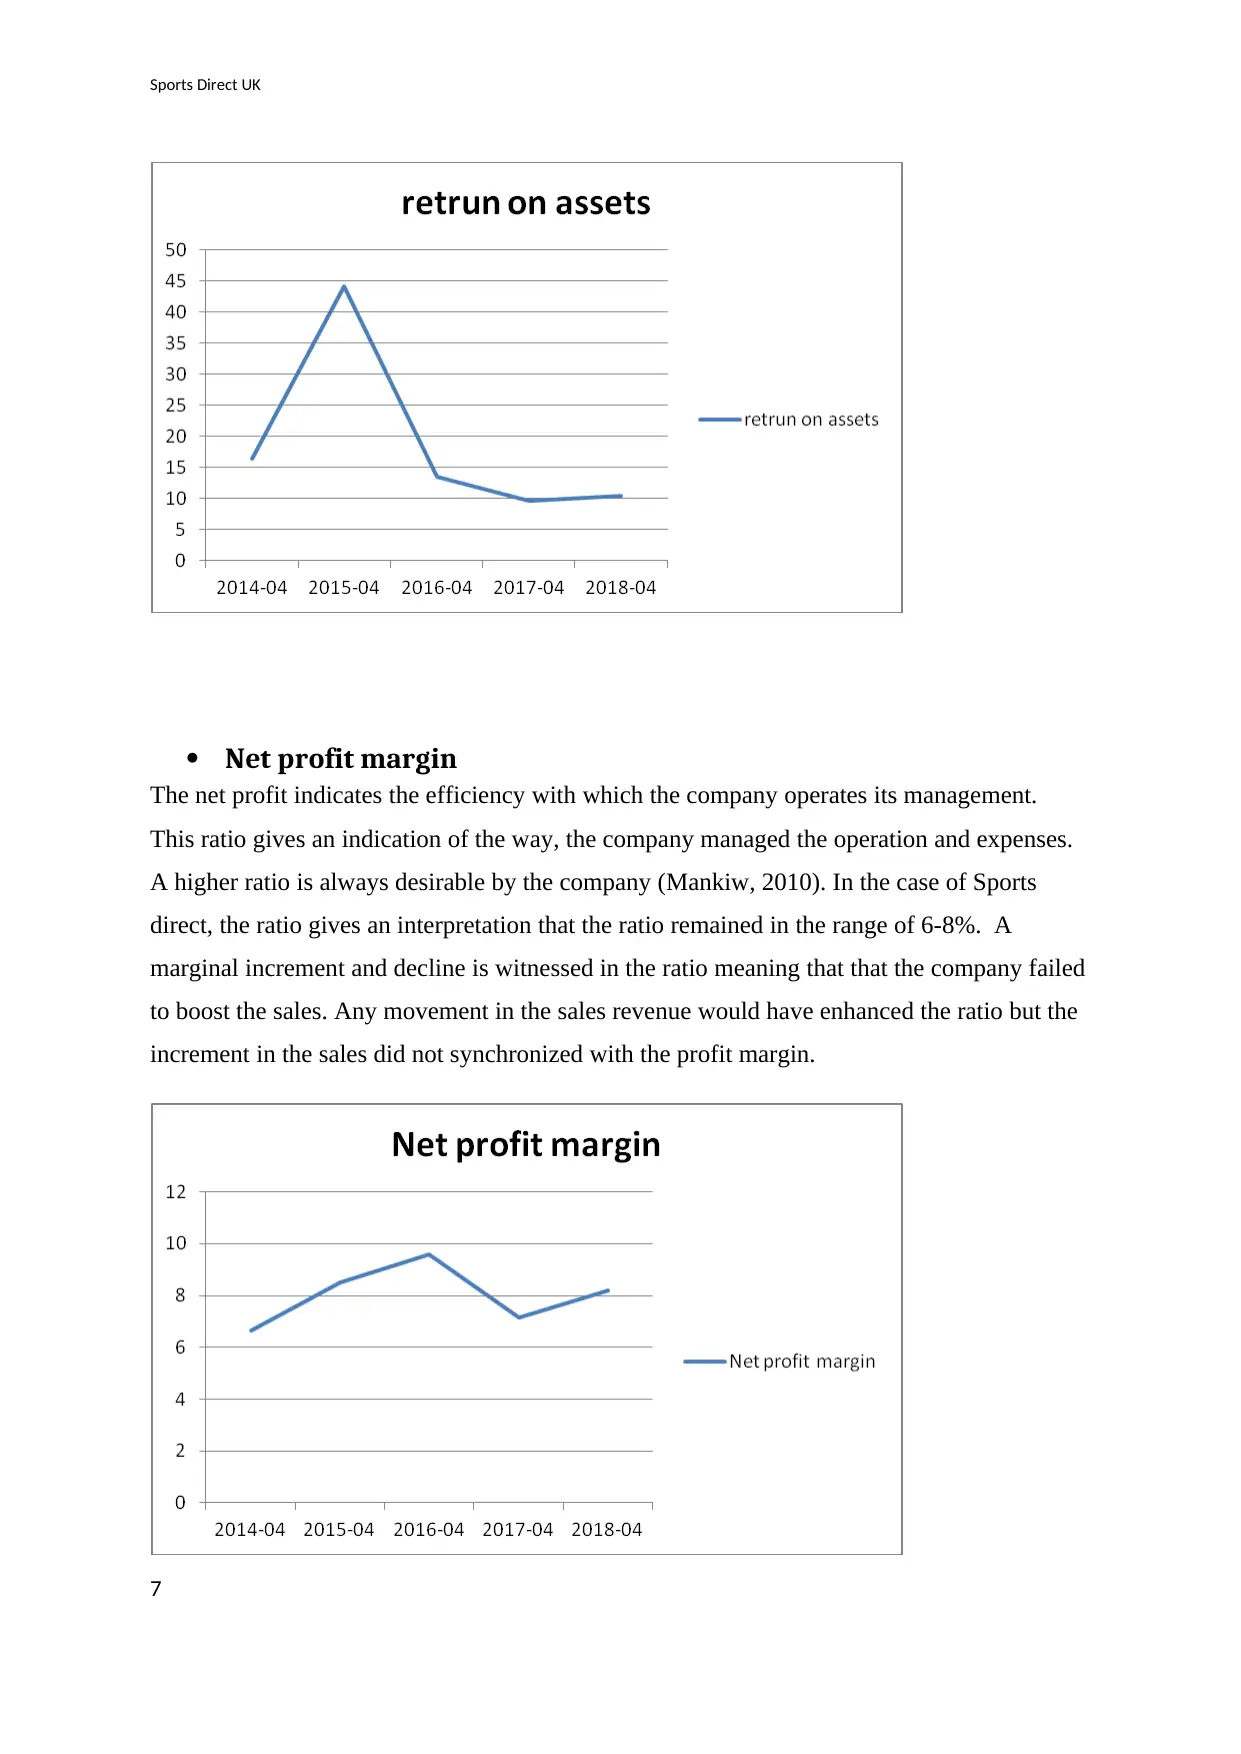
Net profit margin
The net profit indicates the efficiency with which the company operates its management.
This ratio gives an indication of the way, the company managed the operation and expenses.
A higher ratio is always desirable by the company (Mankiw, 2010). In the case of Sports
direct, the ratio gives an interpretation that the ratio remained in the range of 6-8%. A
marginal increment and decline is witnessed in the ratio meaning that that the company failed
to boost the sales. Any movement in the sales revenue would have enhanced the ratio but the
increment in the sales did not synchronized with the profit margin.
7
Paraphrase This Document
Need a fresh take? Get an instant paraphrase of this document with our AI Paraphraser
Sports Direct UK
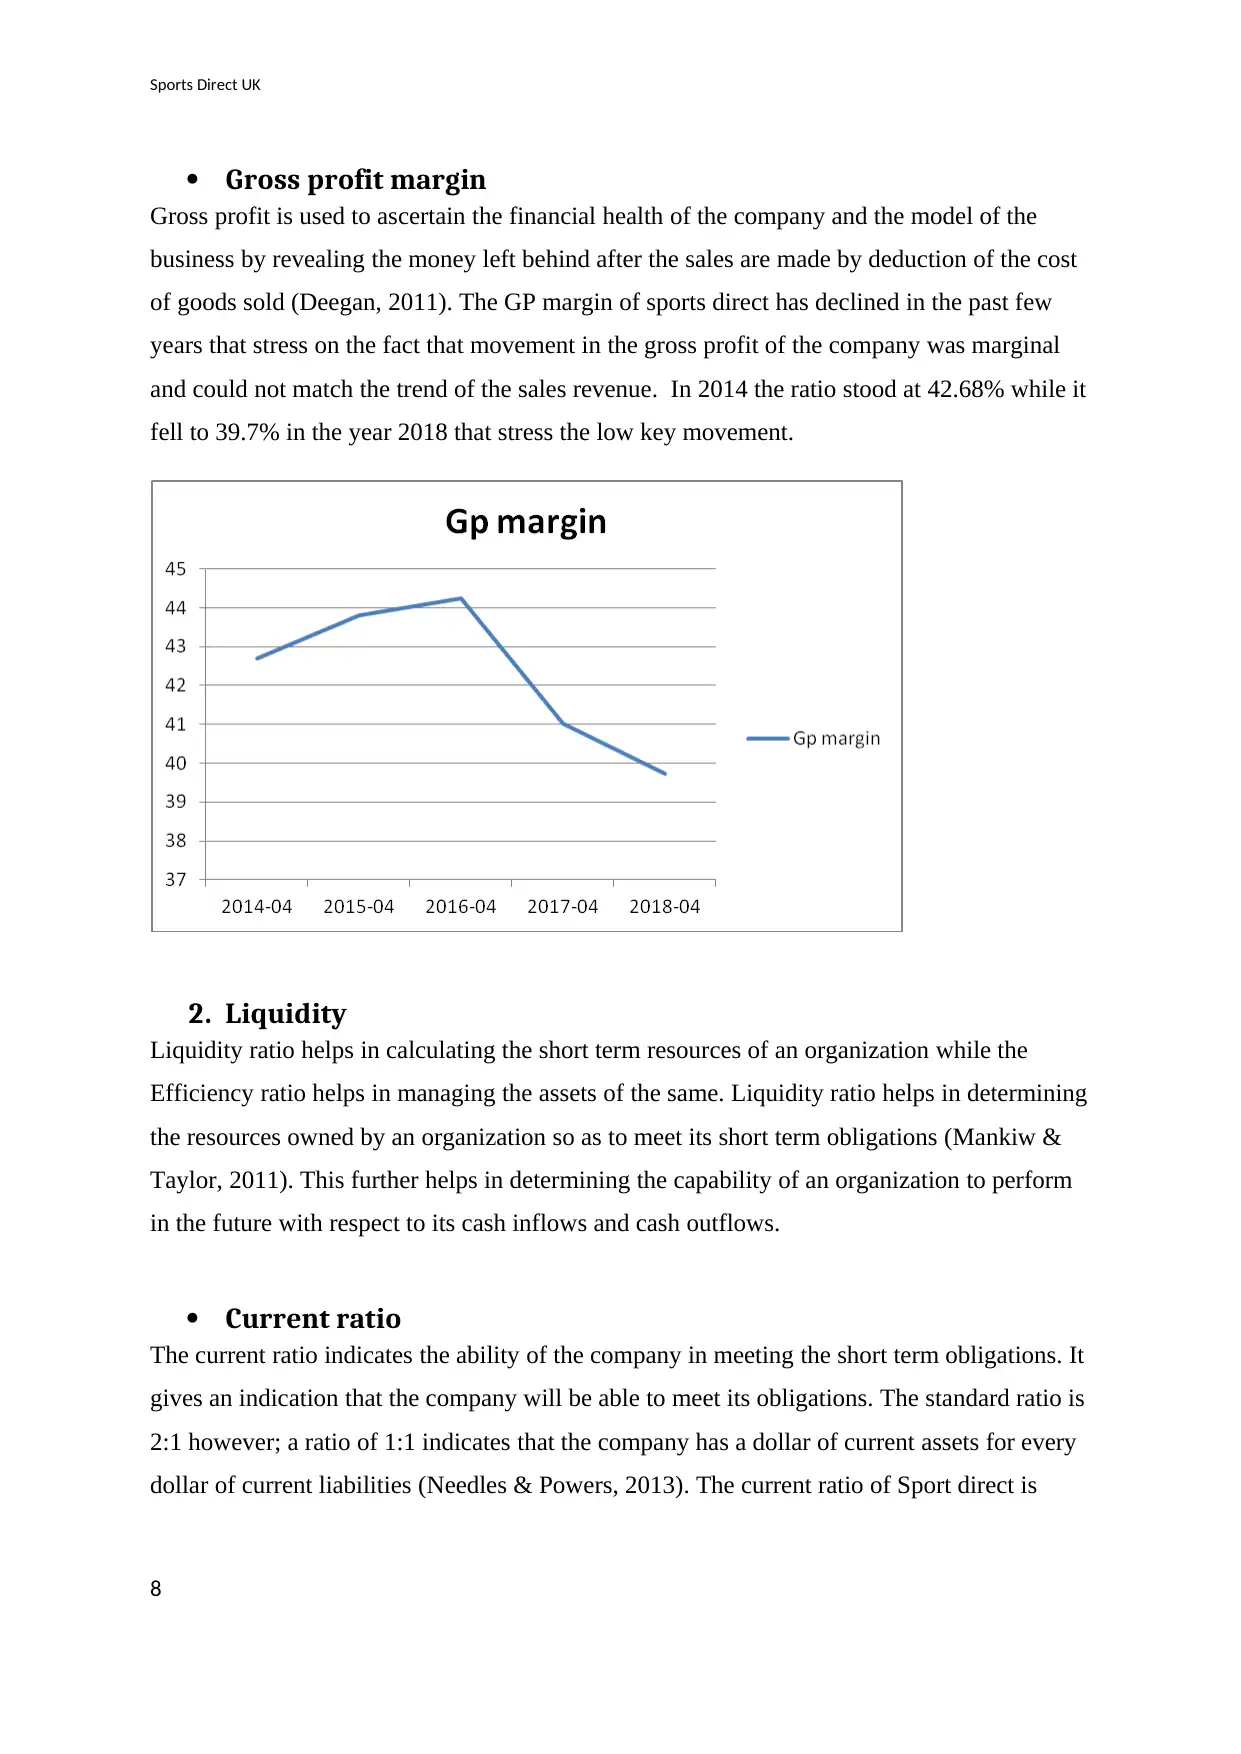
Gross profit margin
Gross profit is used to ascertain the financial health of the company and the model of the
business by revealing the money left behind after the sales are made by deduction of the cost
of goods sold (Deegan, 2011). The GP margin of sports direct has declined in the past few
years that stress on the fact that movement in the gross profit of the company was marginal
and could not match the trend of the sales revenue. In 2014 the ratio stood at 42.68% while it
fell to 39.7% in the year 2018 that stress the low key movement.
2. Liquidity
Liquidity ratio helps in calculating the short term resources of an organization while the
Efficiency ratio helps in managing the assets of the same. Liquidity ratio helps in determining
the resources owned by an organization so as to meet its short term obligations (Mankiw &
Taylor, 2011). This further helps in determining the capability of an organization to perform
in the future with respect to its cash inflows and cash outflows.
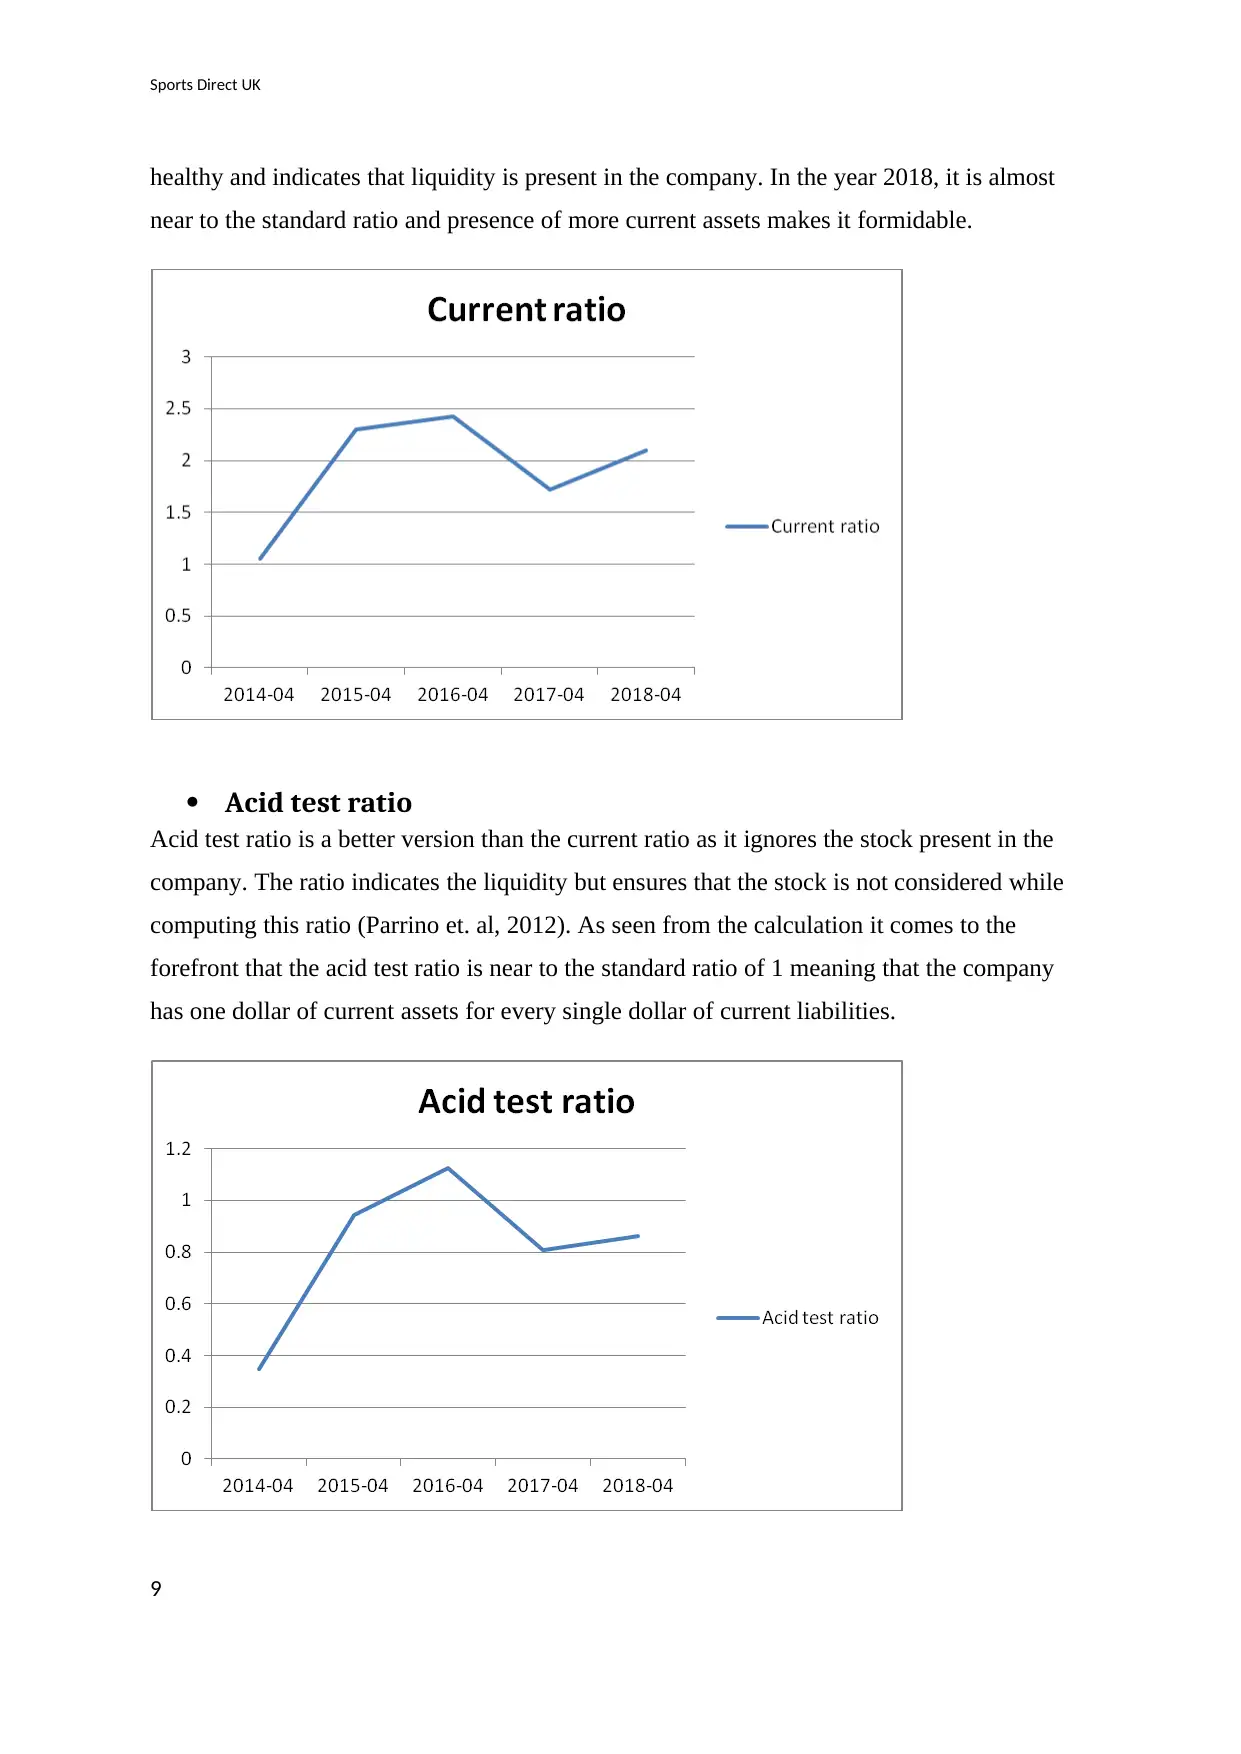
Current ratio
The current ratio indicates the ability of the company in meeting the short term obligations. It
gives an indication that the company will be able to meet its obligations. The standard ratio is
2:1 however; a ratio of 1:1 indicates that the company has a dollar of current assets for every
dollar of current liabilities (Needles & Powers, 2013). The current ratio of Sport direct is
8
Gross profit margin
Gross profit is used to ascertain the financial health of the company and the model of the
business by revealing the money left behind after the sales are made by deduction of the cost
of goods sold (Deegan, 2011). The GP margin of sports direct has declined in the past few
years that stress on the fact that movement in the gross profit of the company was marginal
and could not match the trend of the sales revenue. In 2014 the ratio stood at 42.68% while it
fell to 39.7% in the year 2018 that stress the low key movement.
2. Liquidity
Liquidity ratio helps in calculating the short term resources of an organization while the
Efficiency ratio helps in managing the assets of the same. Liquidity ratio helps in determining
the resources owned by an organization so as to meet its short term obligations (Mankiw &
Taylor, 2011). This further helps in determining the capability of an organization to perform
in the future with respect to its cash inflows and cash outflows.
Current ratio
The current ratio indicates the ability of the company in meeting the short term obligations. It
gives an indication that the company will be able to meet its obligations. The standard ratio is
2:1 however; a ratio of 1:1 indicates that the company has a dollar of current assets for every
dollar of current liabilities (Needles & Powers, 2013). The current ratio of Sport direct is
8
Sports Direct UK
healthy and indicates that liquidity is present in the company. In the year 2018, it is almost
near to the standard ratio and presence of more current assets makes it formidable.
Acid test ratio
Acid test ratio is a better version than the current ratio as it ignores the stock present in the
company. The ratio indicates the liquidity but ensures that the stock is not considered while
computing this ratio (Parrino et. al, 2012). As seen from the calculation it comes to the
forefront that the acid test ratio is near to the standard ratio of 1 meaning that the company
has one dollar of current assets for every single dollar of current liabilities.
9
⊘ This is a preview!⊘
Do you want full access?
Subscribe today to unlock all pages.
Trusted by 1+ million students worldwide
Sports Direct UK
3. Working capital
With working capital, it is easier to evaluate the efficacy of an organization and how it is
doing in terms of cash inflows and outflows, accounts payable, debt management, financial
credit receivable, revenue collection, payments to suppliers and other short-term accounts
(Henderson et. al, 2015).
When the current liabilities are less than the current assets of an organization the working
capital is said to be positive which indicates that it is less likely for an organization to go
liquidity crisis in the coming time (Laux, 2014). When the current liabilities exceed current
assets of an organization the working capital is said to be negative which indicates that the
same shall not be able to set off its current liabilities as and when it falls due.
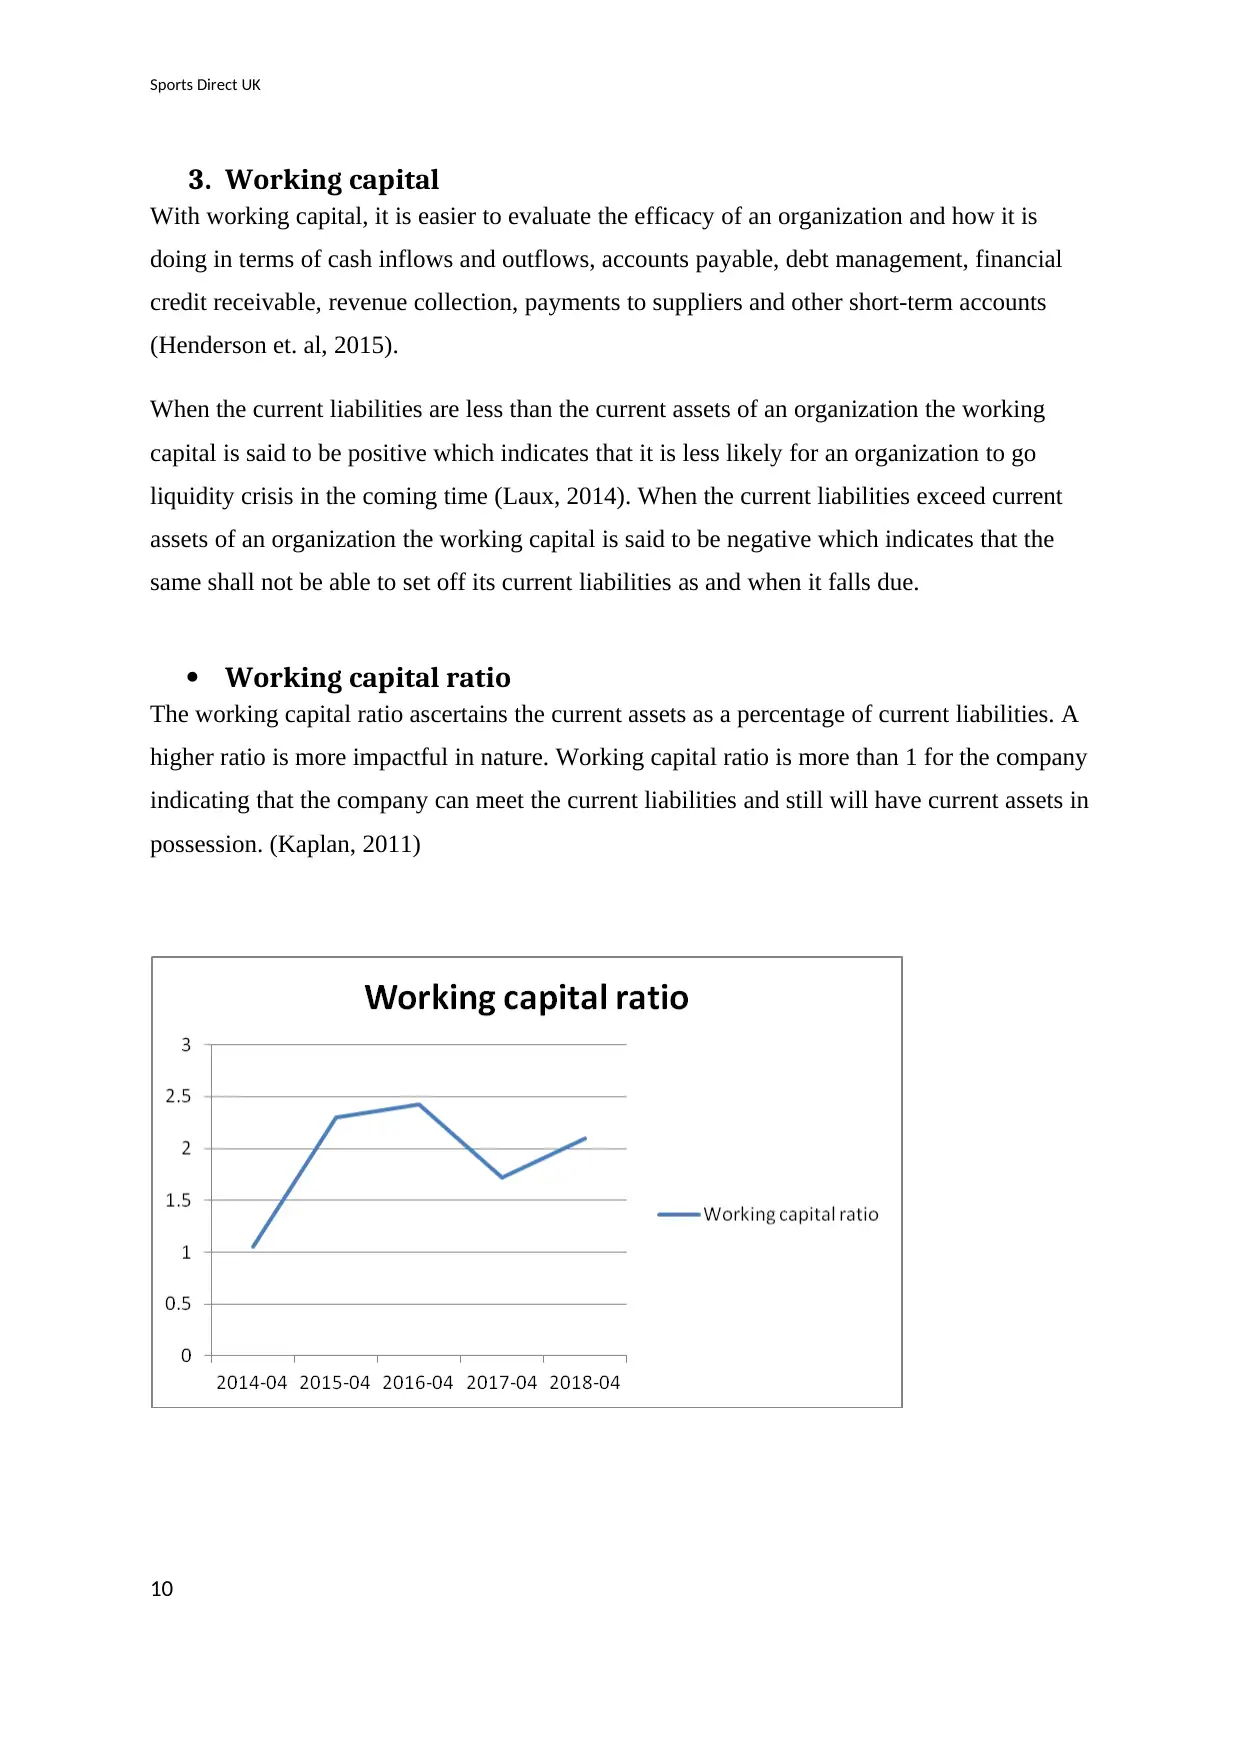
Working capital ratio
The working capital ratio ascertains the current assets as a percentage of current liabilities. A
higher ratio is more impactful in nature. Working capital ratio is more than 1 for the company
indicating that the company can meet the current liabilities and still will have current assets in
possession. (Kaplan, 2011)
10
3. Working capital
With working capital, it is easier to evaluate the efficacy of an organization and how it is
doing in terms of cash inflows and outflows, accounts payable, debt management, financial
credit receivable, revenue collection, payments to suppliers and other short-term accounts
(Henderson et. al, 2015).
When the current liabilities are less than the current assets of an organization the working
capital is said to be positive which indicates that it is less likely for an organization to go
liquidity crisis in the coming time (Laux, 2014). When the current liabilities exceed current
assets of an organization the working capital is said to be negative which indicates that the
same shall not be able to set off its current liabilities as and when it falls due.
Working capital ratio
The working capital ratio ascertains the current assets as a percentage of current liabilities. A
higher ratio is more impactful in nature. Working capital ratio is more than 1 for the company
indicating that the company can meet the current liabilities and still will have current assets in
possession. (Kaplan, 2011)
10
Paraphrase This Document
Need a fresh take? Get an instant paraphrase of this document with our AI Paraphraser
Sports Direct UK
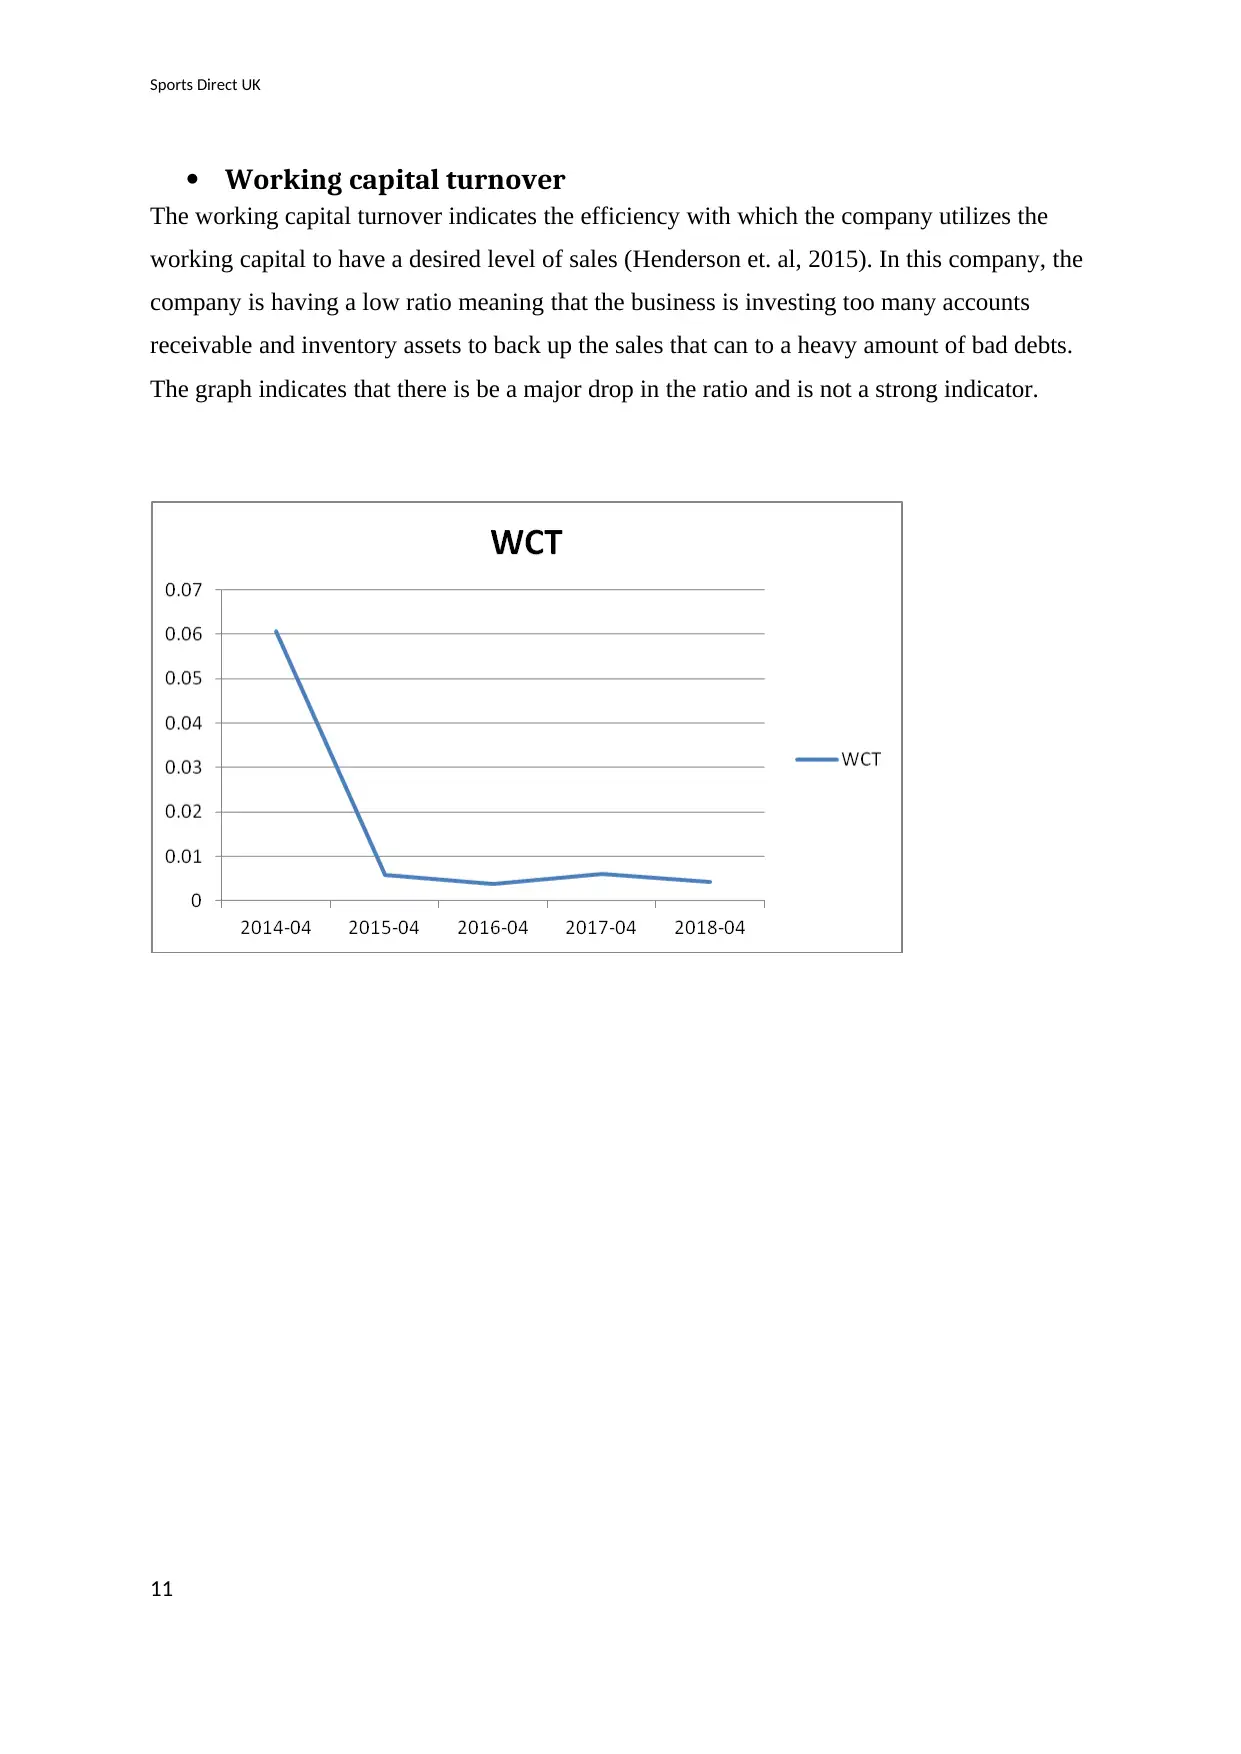
Working capital turnover
The working capital turnover indicates the efficiency with which the company utilizes the
working capital to have a desired level of sales (Henderson et. al, 2015). In this company, the
company is having a low ratio meaning that the business is investing too many accounts
receivable and inventory assets to back up the sales that can to a heavy amount of bad debts.
The graph indicates that there is be a major drop in the ratio and is not a strong indicator.
11
Sports Direct UK
4. Capital Structure
The long term liability of an organization is evaluated by means of shareholders and long
term solvency ratio. This allows an organization to not just determine its long term liabilities
but also calculate its expenses (Leo, 2011). The long term solvency ratio allows an
organization to achieve its growth. Debt equity and debt ratio are the ratios used to evaluate
the results from the shareholder and long term solvency ratio.
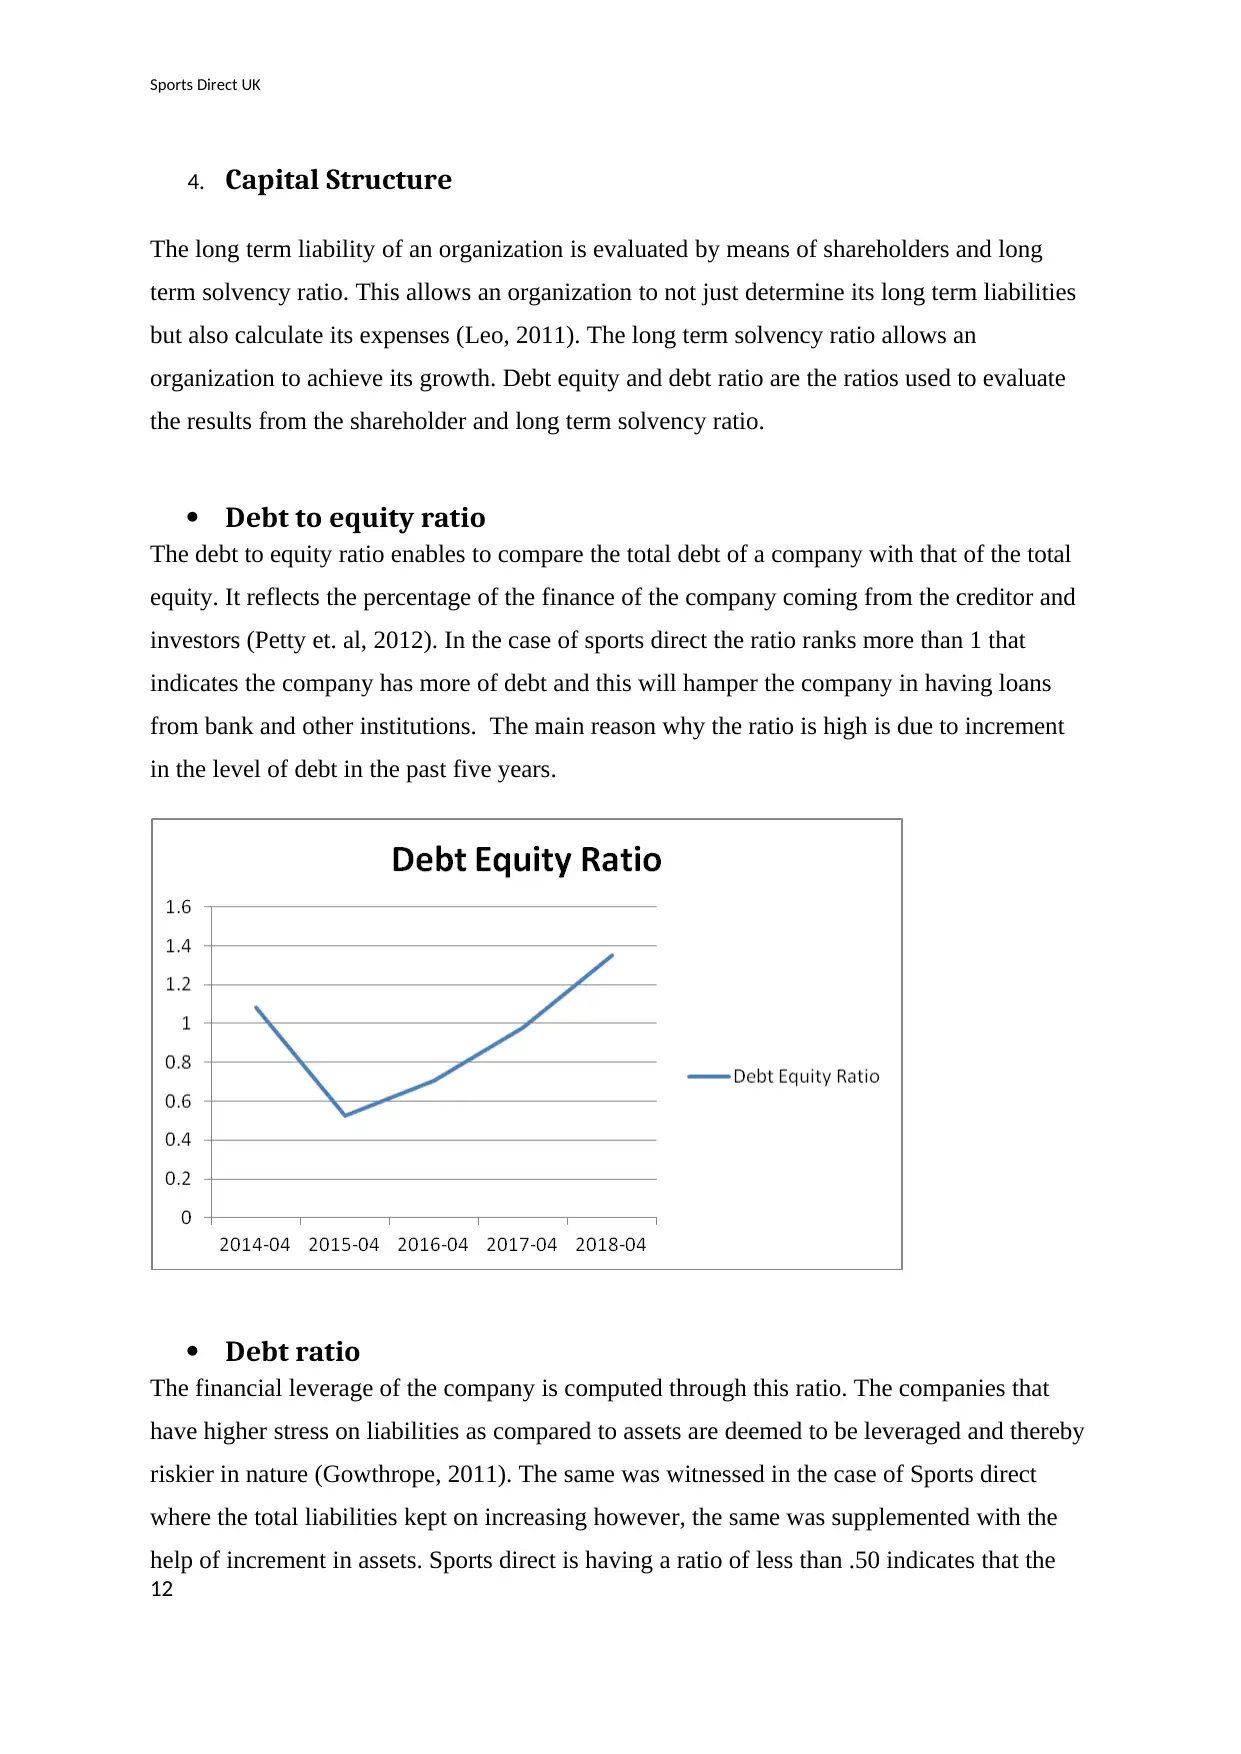
Debt to equity ratio
The debt to equity ratio enables to compare the total debt of a company with that of the total
equity. It reflects the percentage of the finance of the company coming from the creditor and
investors (Petty et. al, 2012). In the case of sports direct the ratio ranks more than 1 that
indicates the company has more of debt and this will hamper the company in having loans
from bank and other institutions. The main reason why the ratio is high is due to increment
in the level of debt in the past five years.
Debt ratio
The financial leverage of the company is computed through this ratio. The companies that
have higher stress on liabilities as compared to assets are deemed to be leveraged and thereby
riskier in nature (Gowthrope, 2011). The same was witnessed in the case of Sports direct
where the total liabilities kept on increasing however, the same was supplemented with the
help of increment in assets. Sports direct is having a ratio of less than .50 indicates that the
12
4. Capital Structure
The long term liability of an organization is evaluated by means of shareholders and long
term solvency ratio. This allows an organization to not just determine its long term liabilities
but also calculate its expenses (Leo, 2011). The long term solvency ratio allows an
organization to achieve its growth. Debt equity and debt ratio are the ratios used to evaluate
the results from the shareholder and long term solvency ratio.
Debt to equity ratio
The debt to equity ratio enables to compare the total debt of a company with that of the total
equity. It reflects the percentage of the finance of the company coming from the creditor and
investors (Petty et. al, 2012). In the case of sports direct the ratio ranks more than 1 that
indicates the company has more of debt and this will hamper the company in having loans
from bank and other institutions. The main reason why the ratio is high is due to increment
in the level of debt in the past five years.
Debt ratio
The financial leverage of the company is computed through this ratio. The companies that
have higher stress on liabilities as compared to assets are deemed to be leveraged and thereby
riskier in nature (Gowthrope, 2011). The same was witnessed in the case of Sports direct
where the total liabilities kept on increasing however, the same was supplemented with the
help of increment in assets. Sports direct is having a ratio of less than .50 indicates that the
12
⊘ This is a preview!⊘
Do you want full access?
Subscribe today to unlock all pages.
Trusted by 1+ million students worldwide
1 out of 22
Related Documents


Your All-in-One AI-Powered Toolkit for Academic Success.
+13062052269
info@desklib.com
Available 24*7 on WhatsApp / Email
![[object Object]](/_next/static/media/star-bottom.7253800d.svg)
Unlock your academic potential
Copyright © 2020–2026 A2Z Services. All Rights Reserved. Developed and managed by ZUCOL.