Cox Electric Profit Calculation: Spreadsheet Model & Data Analysis
VerifiedAdded on  2022/09/27
|7
|1000
|22
Homework Assignment
AI Summary
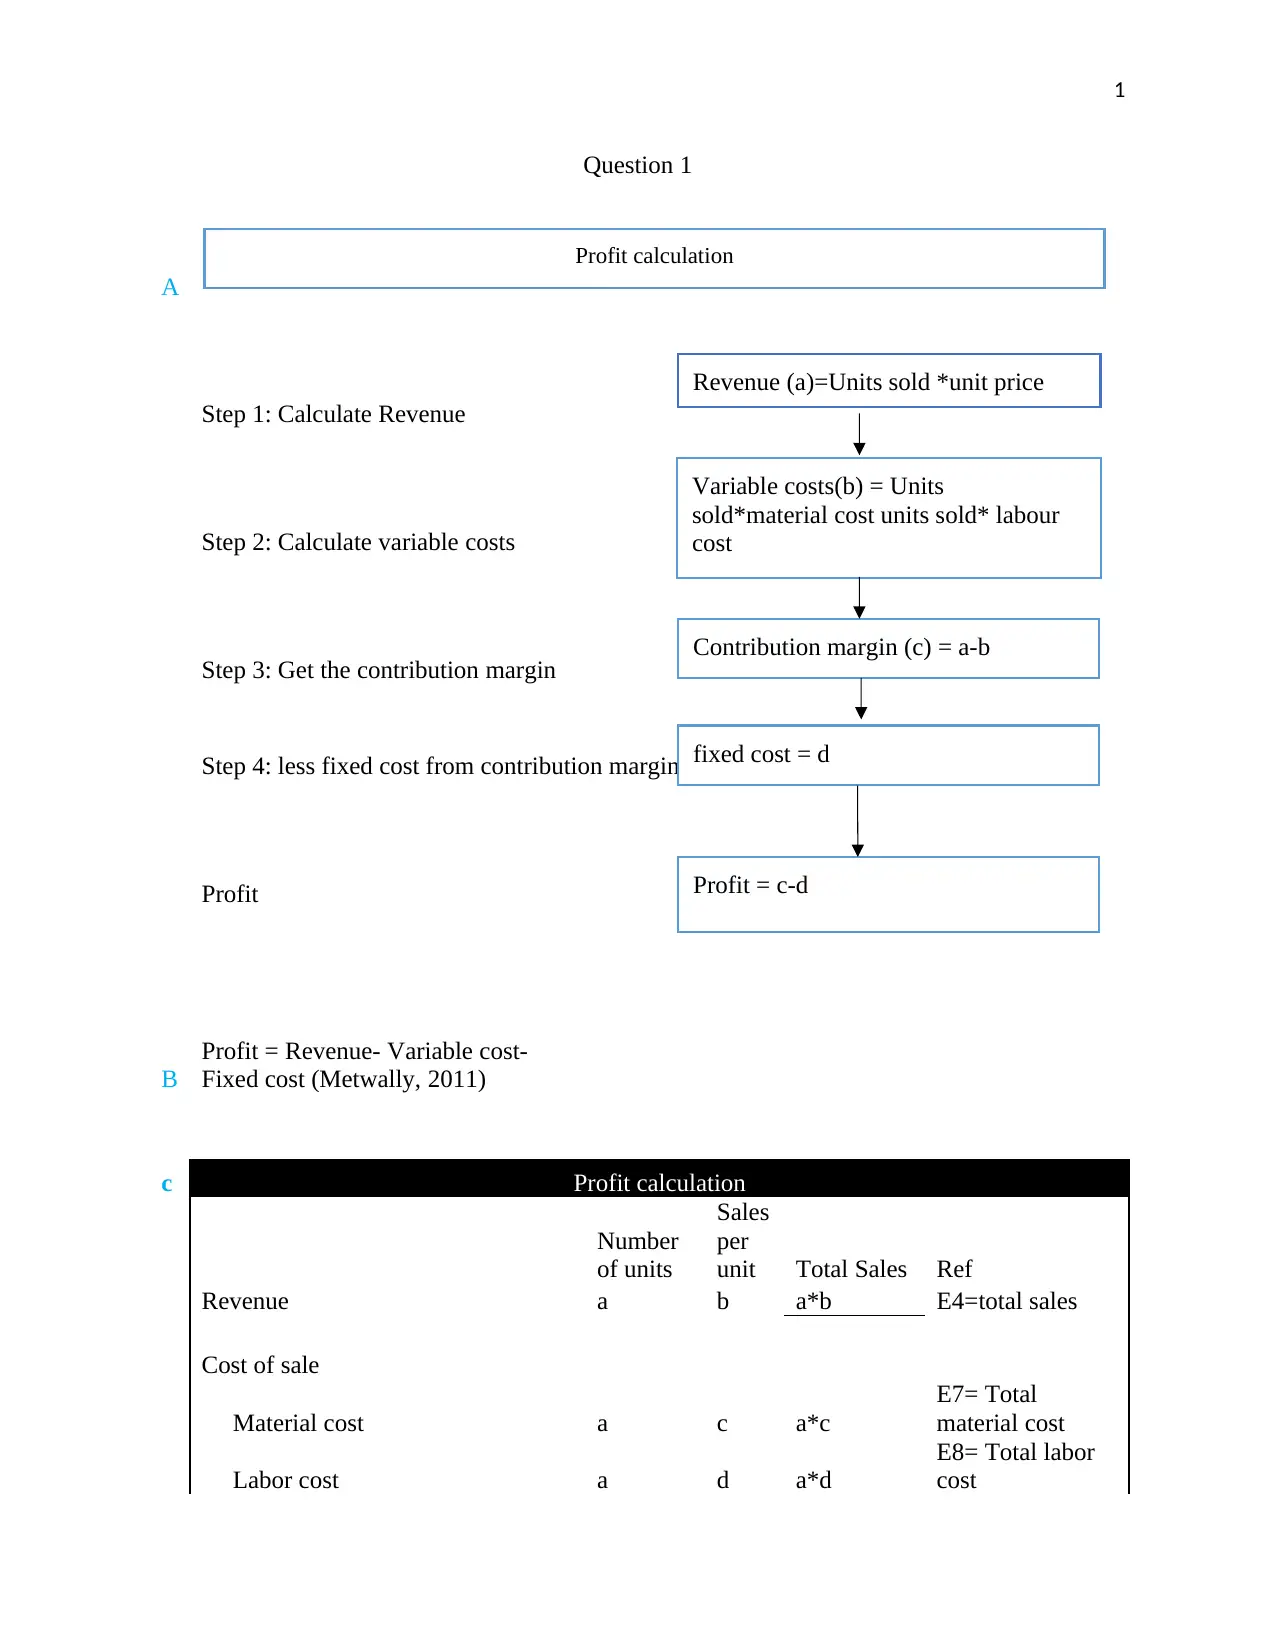
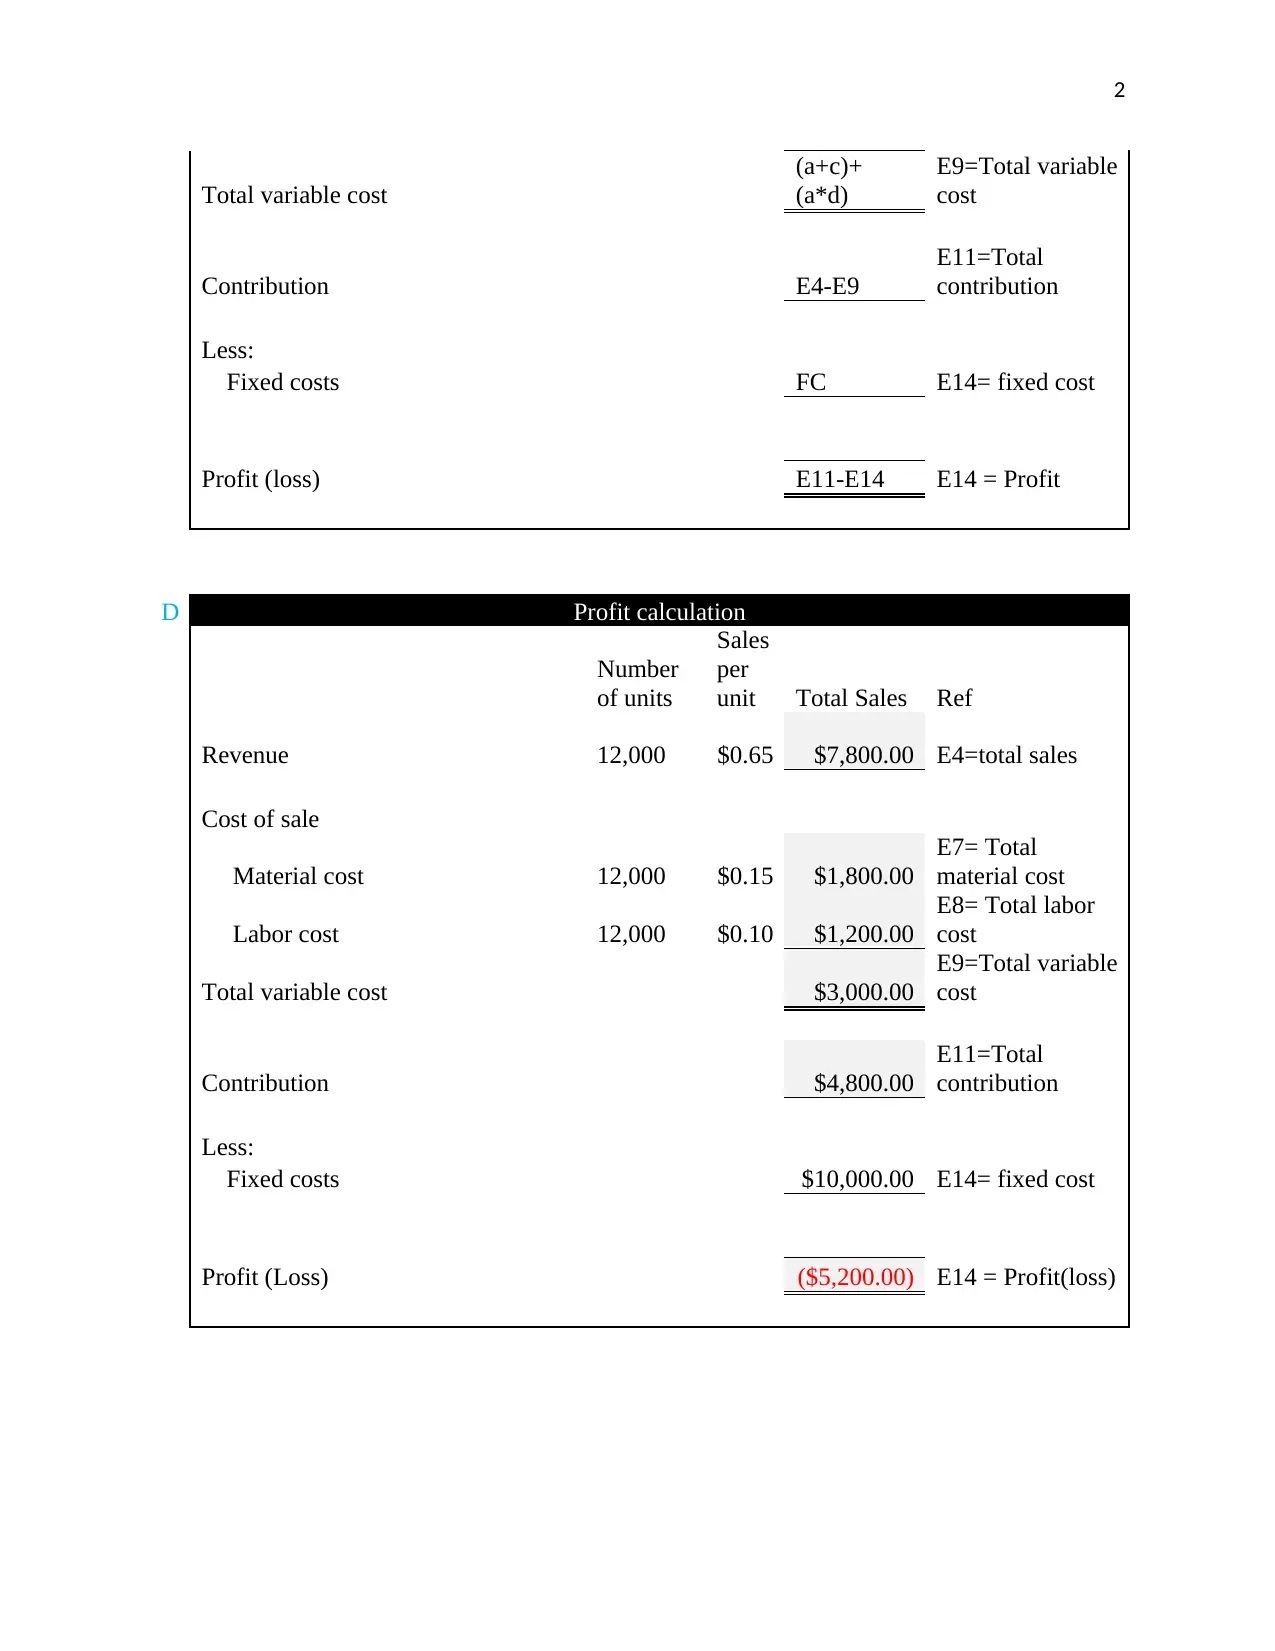
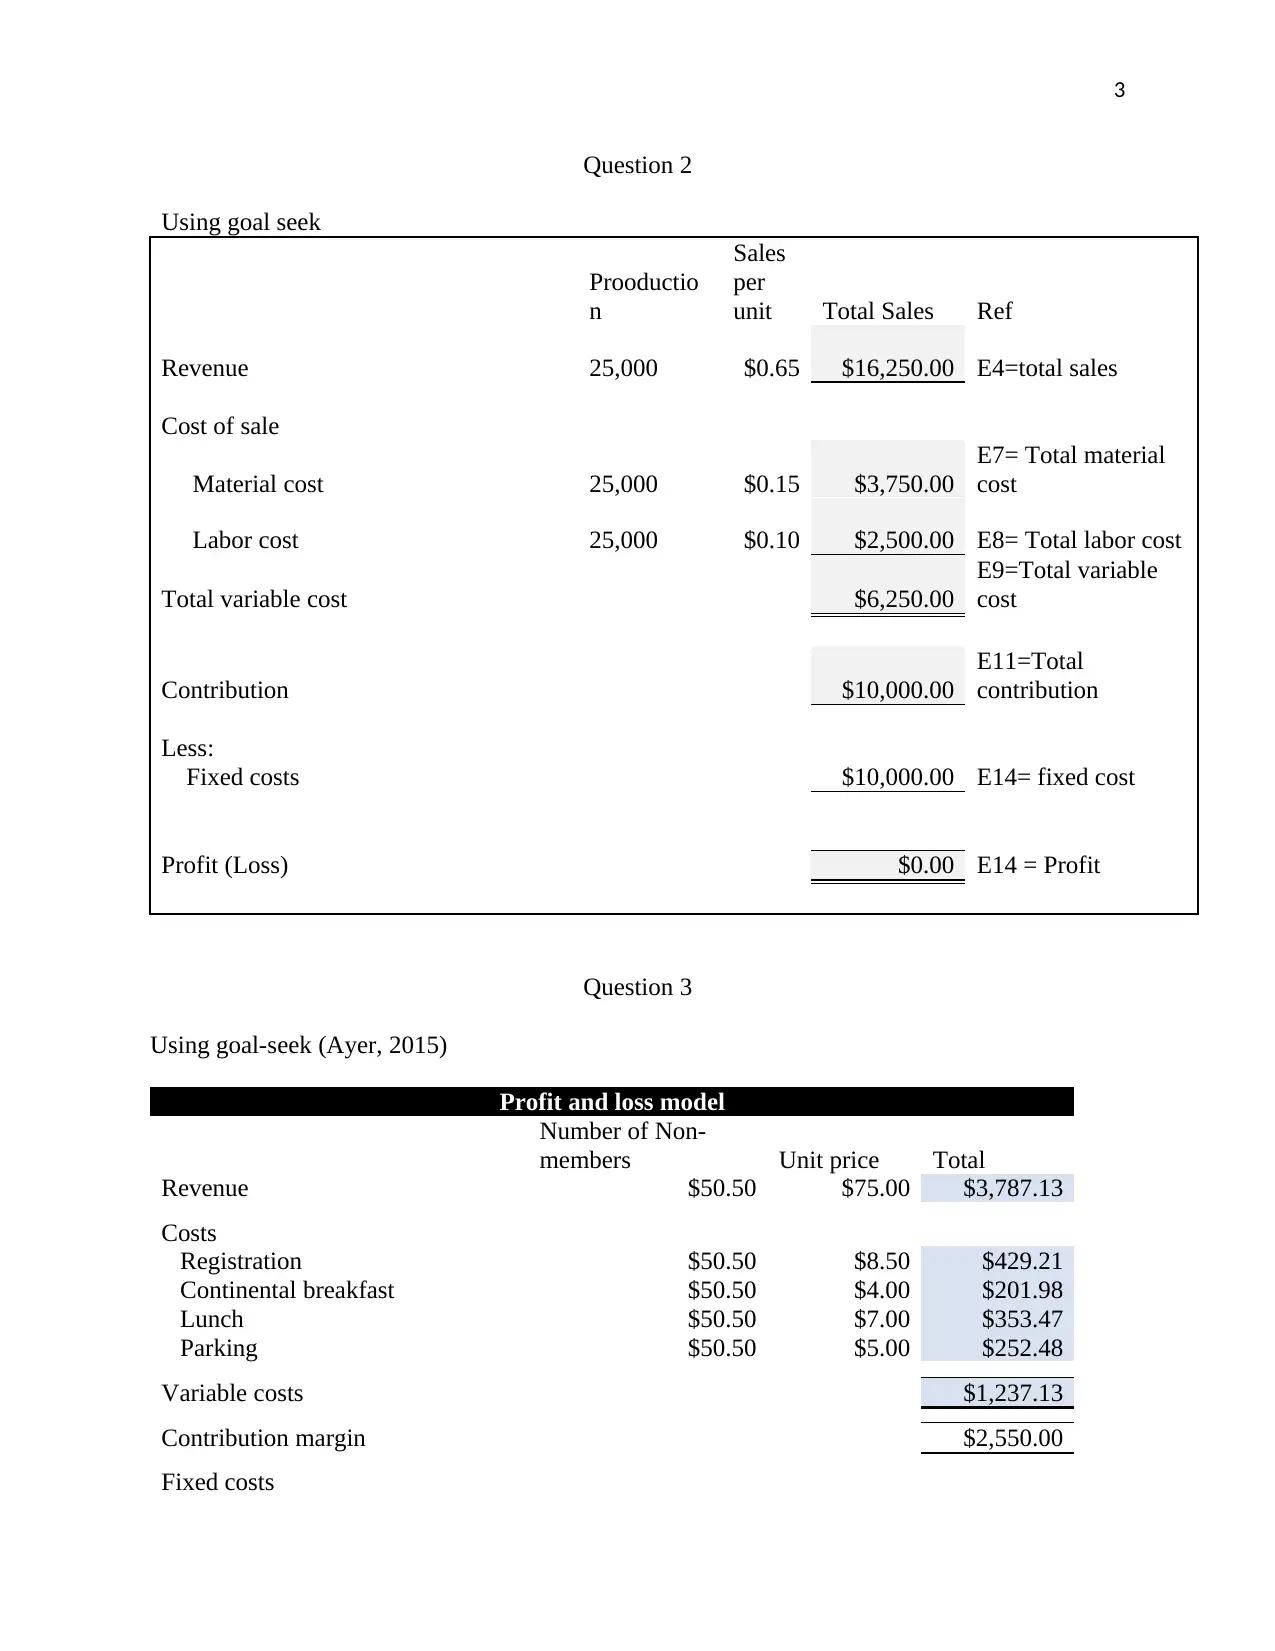
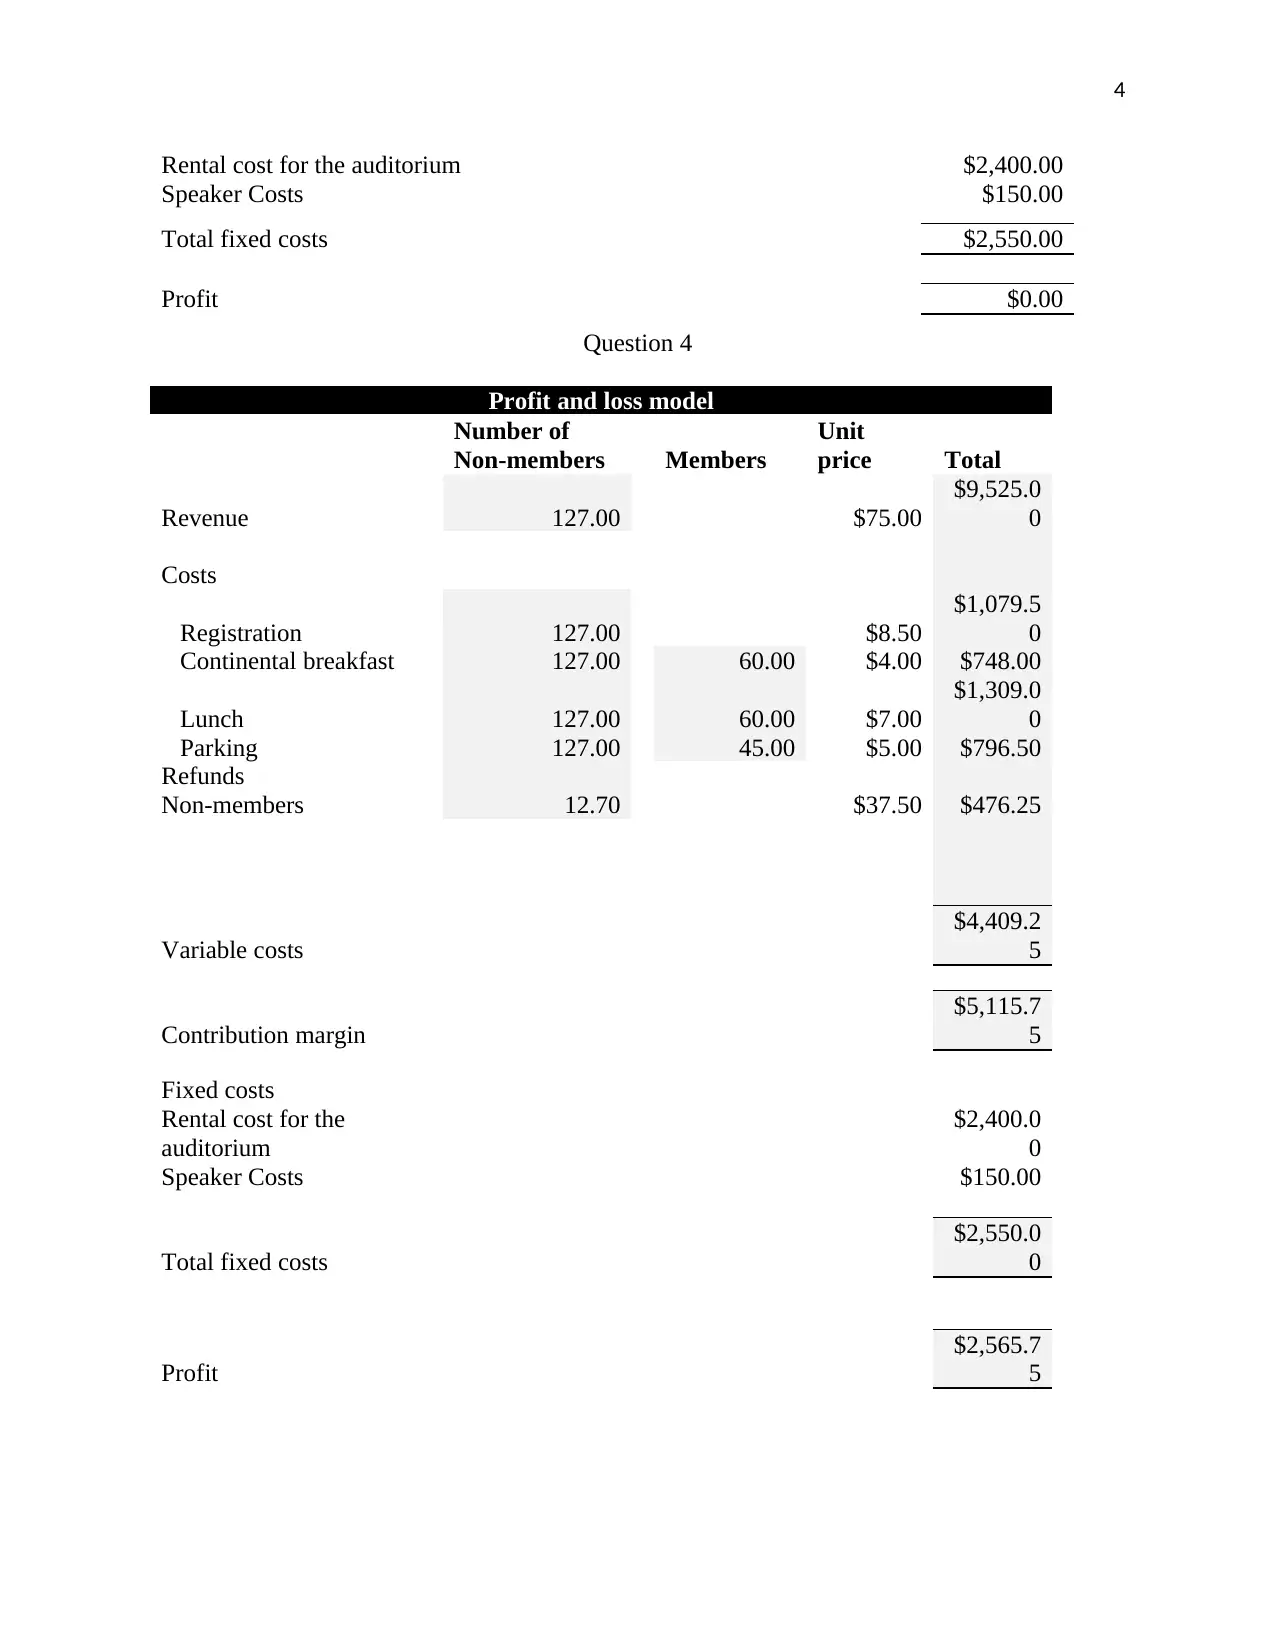
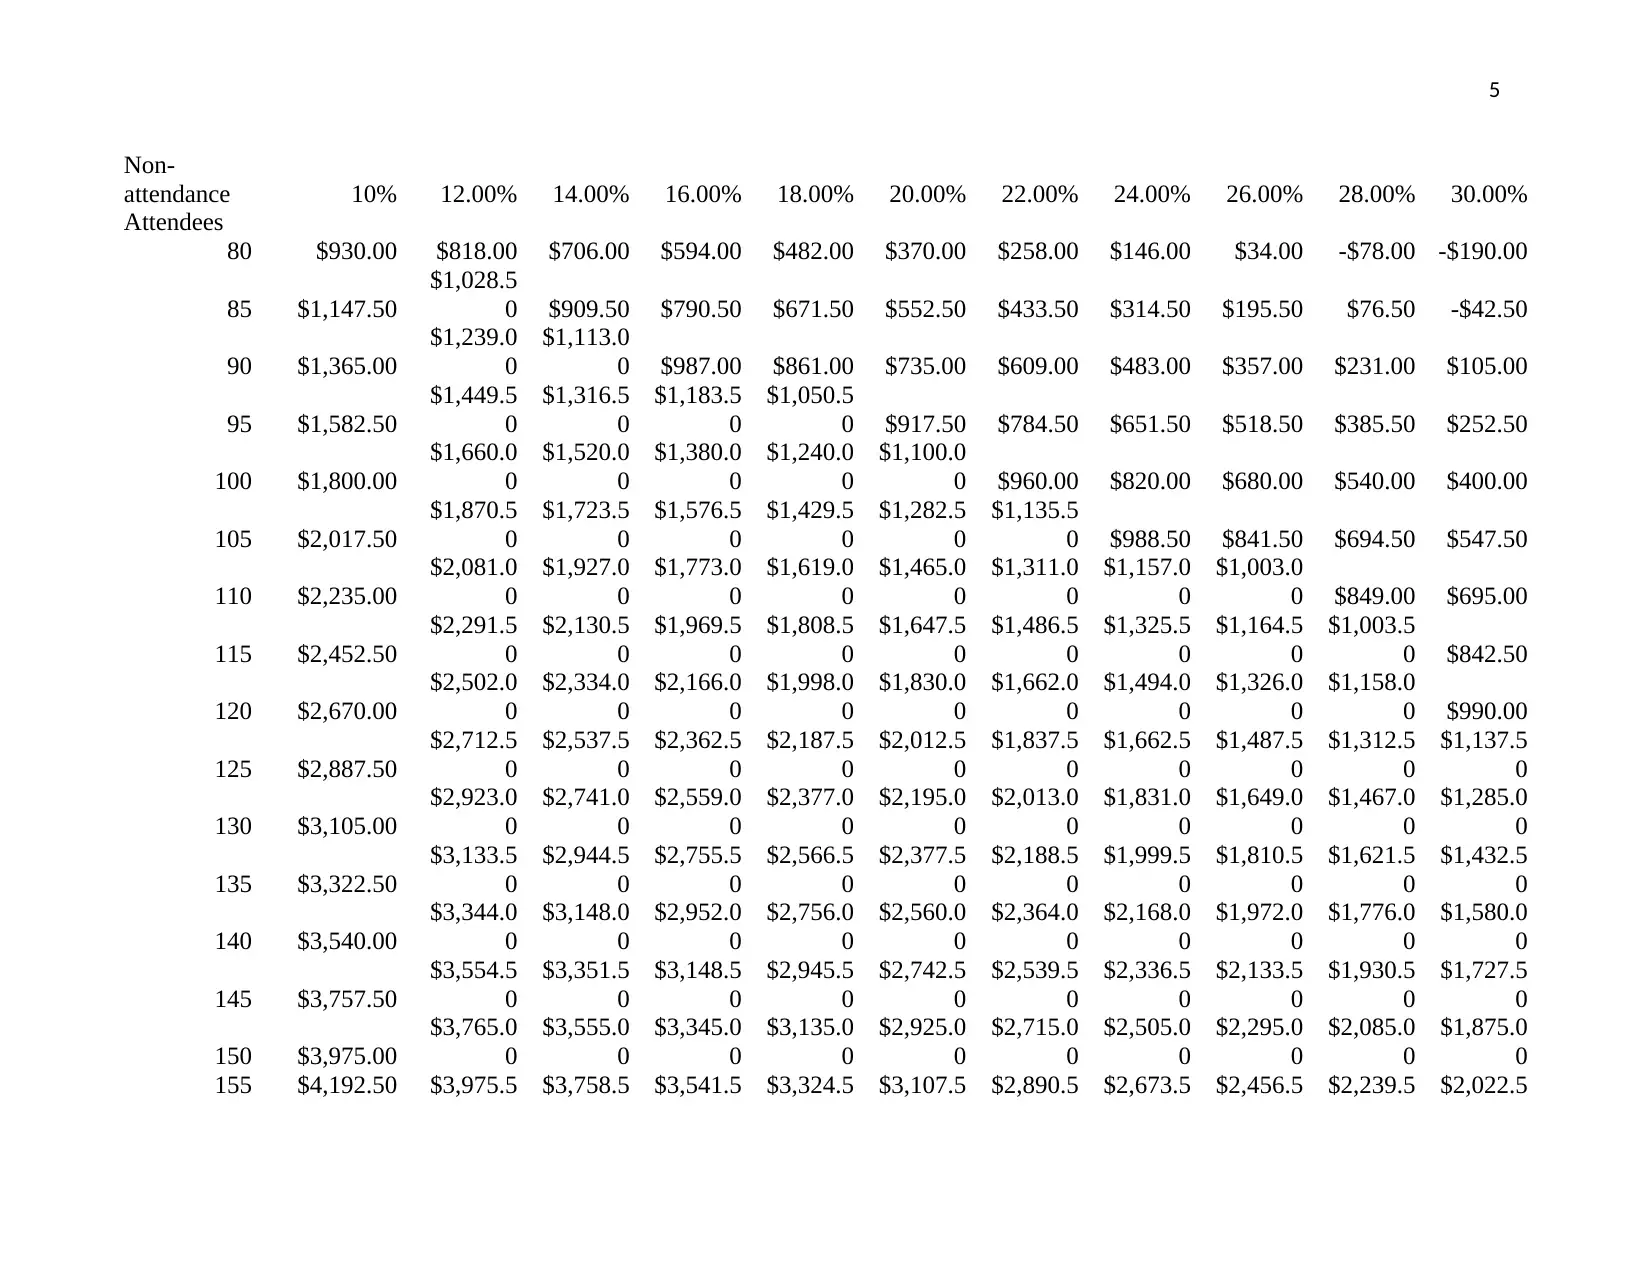
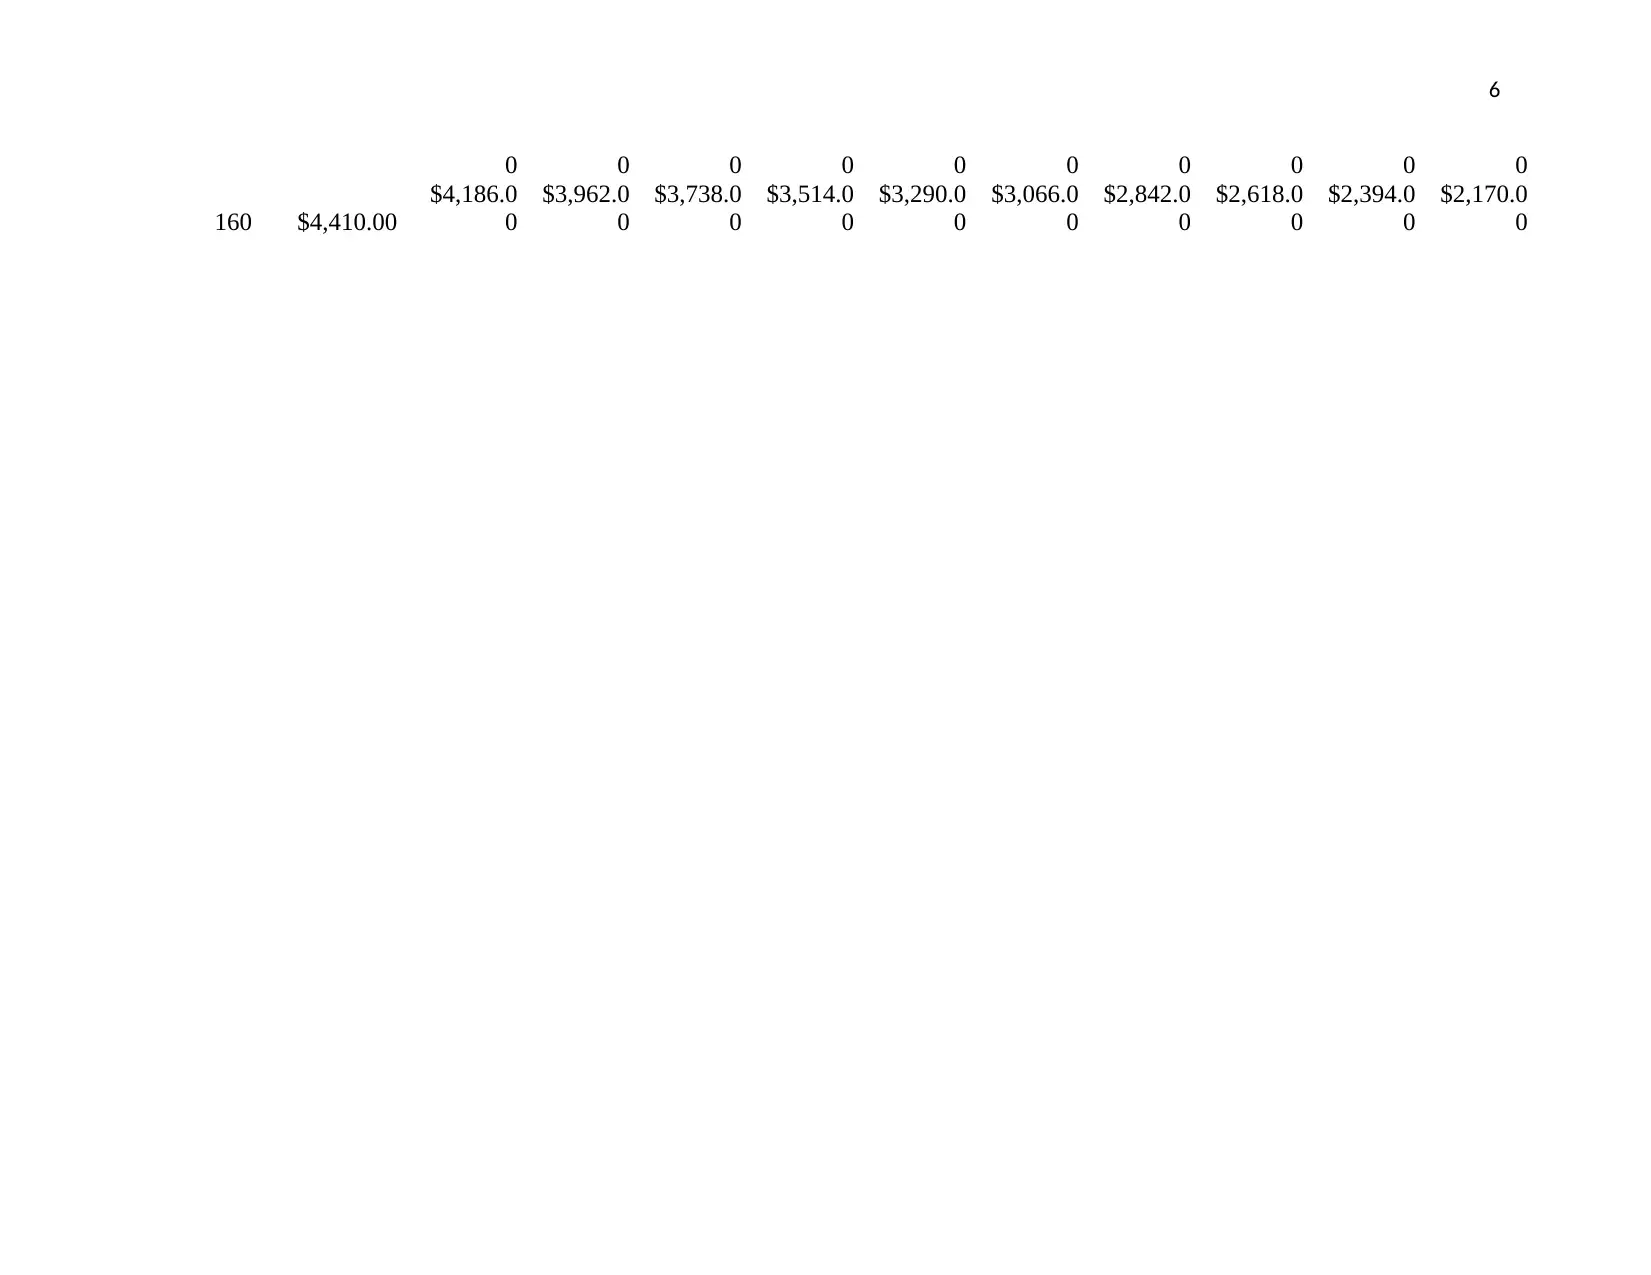
This assignment solution addresses profit calculation using spreadsheet modeling techniques, focusing on a case study involving Cox Electric. The solution begins with the fundamental formulas for calculating revenue, variable costs, contribution margin, and profit, including step-by-step instructions. The assignment then uses an Excel model to calculate profit for a given production volume of 12,000 units. Furthermore, the solution demonstrates the use of Goal Seek to determine production levels needed to achieve a break-even point and analyze the profit and loss model. The assignment also explores the impact of variable costs and fixed costs on profitability, along with the use of data tables to analyze profit across varying production volumes and attendance rates. The solution includes references to relevant academic sources.

1
Question 1
A
Step 1: Calculate Revenue
Step 2: Calculate variable costs
Step 3: Get the contribution margin
Step 4: less fixed cost from contribution margin
Profit
B
Profit = Revenue- Variable cost-
Fixed cost (Metwally, 2011)
c Profit calculation
Number
of units
Sales
per
unit Total Sales Ref
Revenue a b a*b E4=total sales
Cost of sale
Material cost a c a*c
E7= Total
material cost
Labor cost a d a*d
E8= Total labor
cost
Profit calculation
Revenue (a)=Units sold *unit price
Variable costs(b) = Units
sold*material cost units sold* labour
cost
Contribution margin (c) = a-b
fixed cost = d
Profit = c-d
Paraphrase This Document
Need a fresh take? Get an instant paraphrase of this document with our AI Paraphraser

2
Total variable cost
(a+c)+
(a*d)
E9=Total variable
cost
Contribution E4-E9
E11=Total
contribution
Less:
Fixed costs FC E14= fixed cost
Profit (loss) E11-E14 E14 = Profit
D Profit calculation
Number
of units
Sales
per
unit Total Sales Ref
Revenue 12,000 $0.65 $7,800.00 E4=total sales
Cost of sale
Material cost 12,000 $0.15 $1,800.00
E7= Total
material cost
Labor cost 12,000 $0.10 $1,200.00
E8= Total labor
cost
Total variable cost $3,000.00
E9=Total variable
cost
Contribution $4,800.00
E11=Total
contribution
Less:
Fixed costs $10,000.00 E14= fixed cost
Profit (Loss) ($5,200.00) E14 = Profit(loss)

3
Question 2
Using goal seek
Prooductio
n
Sales
per
unit Total Sales Ref
Revenue 25,000 $0.65 $16,250.00 E4=total sales
Cost of sale
Material cost 25,000 $0.15 $3,750.00
E7= Total material
cost
Labor cost 25,000 $0.10 $2,500.00 E8= Total labor cost
Total variable cost $6,250.00
E9=Total variable
cost
Contribution $10,000.00
E11=Total
contribution
Less:
Fixed costs $10,000.00 E14= fixed cost
Profit (Loss) $0.00 E14 = Profit
Question 3
Using goal-seek (Ayer, 2015)
Profit and loss model
Number of Non-
members Unit price Total
Revenue $50.50 $75.00 $3,787.13
Costs
Registration $50.50 $8.50 $429.21
Continental breakfast $50.50 $4.00 $201.98
Lunch $50.50 $7.00 $353.47
Parking $50.50 $5.00 $252.48
Variable costs $1,237.13
Contribution margin $2,550.00
Fixed costs
⊘ This is a preview!⊘
Do you want full access?
Subscribe today to unlock all pages.

Trusted by 1+ million students worldwide

4
Rental cost for the auditorium $2,400.00
Speaker Costs $150.00
Total fixed costs $2,550.00
Profit $0.00
Question 4
Profit and loss model
Number of
Non-members Members
Unit
price Total
Revenue 127.00 $75.00
$9,525.0
0
Costs
Registration 127.00 $8.50
$1,079.5
0
Continental breakfast 127.00 60.00 $4.00 $748.00
Lunch 127.00 60.00 $7.00
$1,309.0
0
Parking 127.00 45.00 $5.00 $796.50
Refunds
Non-members 12.70 $37.50 $476.25
Variable costs
$4,409.2
5
Contribution margin
$5,115.7
5
Fixed costs
Rental cost for the
auditorium
$2,400.0
0
Speaker Costs $150.00
Total fixed costs
$2,550.0
0
Profit
$2,565.7
5
Paraphrase This Document
Need a fresh take? Get an instant paraphrase of this document with our AI Paraphraser

5
Non-
attendance 10% 12.00% 14.00% 16.00% 18.00% 20.00% 22.00% 24.00% 26.00% 28.00% 30.00%
Attendees
80 $930.00 $818.00 $706.00 $594.00 $482.00 $370.00 $258.00 $146.00 $34.00 -$78.00 -$190.00
85 $1,147.50
$1,028.5
0 $909.50 $790.50 $671.50 $552.50 $433.50 $314.50 $195.50 $76.50 -$42.50
90 $1,365.00
$1,239.0
0
$1,113.0
0 $987.00 $861.00 $735.00 $609.00 $483.00 $357.00 $231.00 $105.00
95 $1,582.50
$1,449.5
0
$1,316.5
0
$1,183.5
0
$1,050.5
0 $917.50 $784.50 $651.50 $518.50 $385.50 $252.50
100 $1,800.00
$1,660.0
0
$1,520.0
0
$1,380.0
0
$1,240.0
0
$1,100.0
0 $960.00 $820.00 $680.00 $540.00 $400.00
105 $2,017.50
$1,870.5
0
$1,723.5
0
$1,576.5
0
$1,429.5
0
$1,282.5
0
$1,135.5
0 $988.50 $841.50 $694.50 $547.50
110 $2,235.00
$2,081.0
0
$1,927.0
0
$1,773.0
0
$1,619.0
0
$1,465.0
0
$1,311.0
0
$1,157.0
0
$1,003.0
0 $849.00 $695.00
115 $2,452.50
$2,291.5
0
$2,130.5
0
$1,969.5
0
$1,808.5
0
$1,647.5
0
$1,486.5
0
$1,325.5
0
$1,164.5
0
$1,003.5
0 $842.50
120 $2,670.00
$2,502.0
0
$2,334.0
0
$2,166.0
0
$1,998.0
0
$1,830.0
0
$1,662.0
0
$1,494.0
0
$1,326.0
0
$1,158.0
0 $990.00
125 $2,887.50
$2,712.5
0
$2,537.5
0
$2,362.5
0
$2,187.5
0
$2,012.5
0
$1,837.5
0
$1,662.5
0
$1,487.5
0
$1,312.5
0
$1,137.5
0
130 $3,105.00
$2,923.0
0
$2,741.0
0
$2,559.0
0
$2,377.0
0
$2,195.0
0
$2,013.0
0
$1,831.0
0
$1,649.0
0
$1,467.0
0
$1,285.0
0
135 $3,322.50
$3,133.5
0
$2,944.5
0
$2,755.5
0
$2,566.5
0
$2,377.5
0
$2,188.5
0
$1,999.5
0
$1,810.5
0
$1,621.5
0
$1,432.5
0
140 $3,540.00
$3,344.0
0
$3,148.0
0
$2,952.0
0
$2,756.0
0
$2,560.0
0
$2,364.0
0
$2,168.0
0
$1,972.0
0
$1,776.0
0
$1,580.0
0
145 $3,757.50
$3,554.5
0
$3,351.5
0
$3,148.5
0
$2,945.5
0
$2,742.5
0
$2,539.5
0
$2,336.5
0
$2,133.5
0
$1,930.5
0
$1,727.5
0
150 $3,975.00
$3,765.0
0
$3,555.0
0
$3,345.0
0
$3,135.0
0
$2,925.0
0
$2,715.0
0
$2,505.0
0
$2,295.0
0
$2,085.0
0
$1,875.0
0
155 $4,192.50 $3,975.5 $3,758.5 $3,541.5 $3,324.5 $3,107.5 $2,890.5 $2,673.5 $2,456.5 $2,239.5 $2,022.5

6
0 0 0 0 0 0 0 0 0 0
160 $4,410.00
$4,186.0
0
$3,962.0
0
$3,738.0
0
$3,514.0
0
$3,290.0
0
$3,066.0
0
$2,842.0
0
$2,618.0
0
$2,394.0
0
$2,170.0
0
0 0 0 0 0 0 0 0 0 0
160 $4,410.00
$4,186.0
0
$3,962.0
0
$3,738.0
0
$3,514.0
0
$3,290.0
0
$3,066.0
0
$2,842.0
0
$2,618.0
0
$2,394.0
0
$2,170.0
0
⊘ This is a preview!⊘
Do you want full access?
Subscribe today to unlock all pages.

Trusted by 1+ million students worldwide

7
References
Ayer, G. (2015). Excel in Excel®!*. Energy Engineering, 112(2), 14-25. doi:
10.1080/01998595.2015.11090950
Metwally, K. (2011). Understanding Internal Markets Through Franchise Contribution Margin
Analysis. SSRN Electronic Journal. doi: 10.2139/ssrn.1770942
References
Ayer, G. (2015). Excel in Excel®!*. Energy Engineering, 112(2), 14-25. doi:
10.1080/01998595.2015.11090950
Metwally, K. (2011). Understanding Internal Markets Through Franchise Contribution Margin
Analysis. SSRN Electronic Journal. doi: 10.2139/ssrn.1770942
1 out of 7
Related Documents
Your All-in-One AI-Powered Toolkit for Academic Success.
 +13062052269
info@desklib.com
Available 24*7 on WhatsApp / Email
Unlock your academic potential
Copyright © 2020–2026 A2Z Services. All Rights Reserved. Developed and managed by ZUCOL.


