SPSS Homework: Statistical Analysis and Interpretation of Data

Verified

Added on  2020/10/05

|19
|3008
|467
Homework Assignment
AI Summary
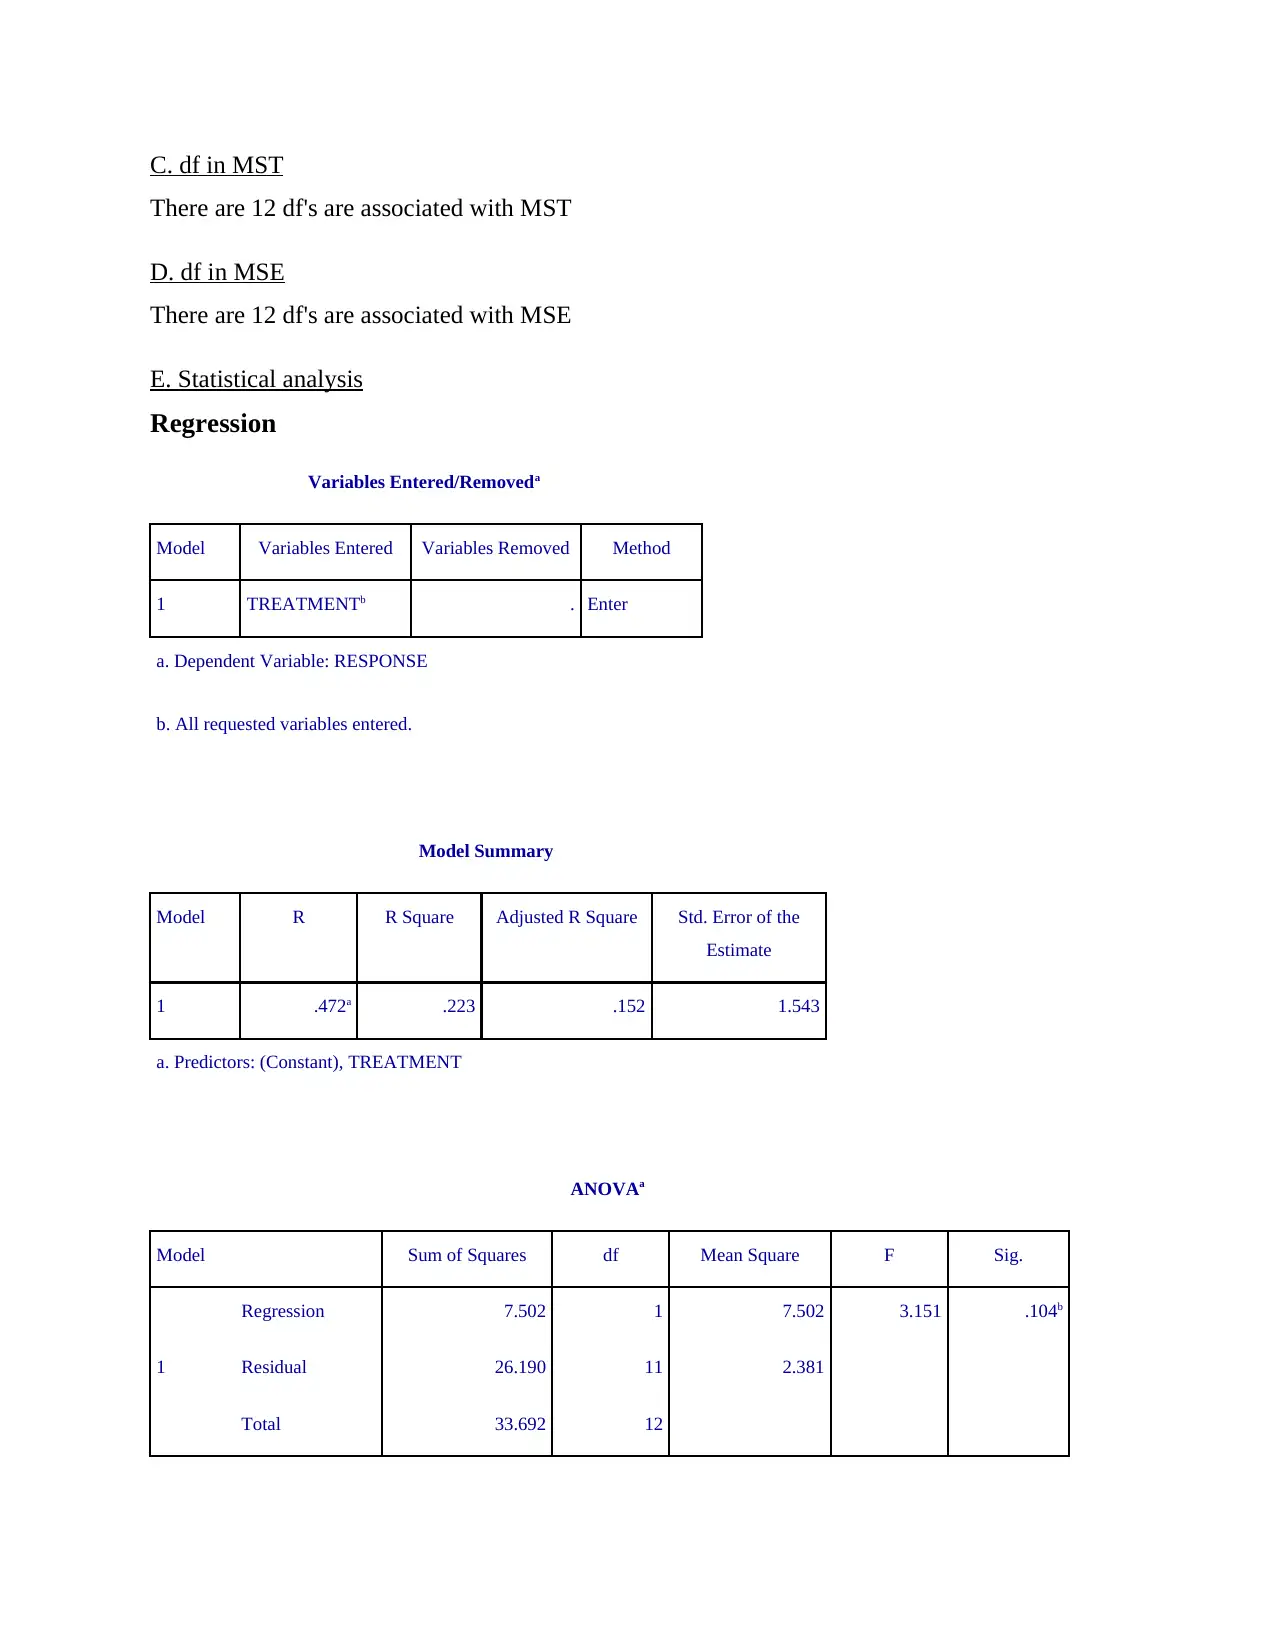
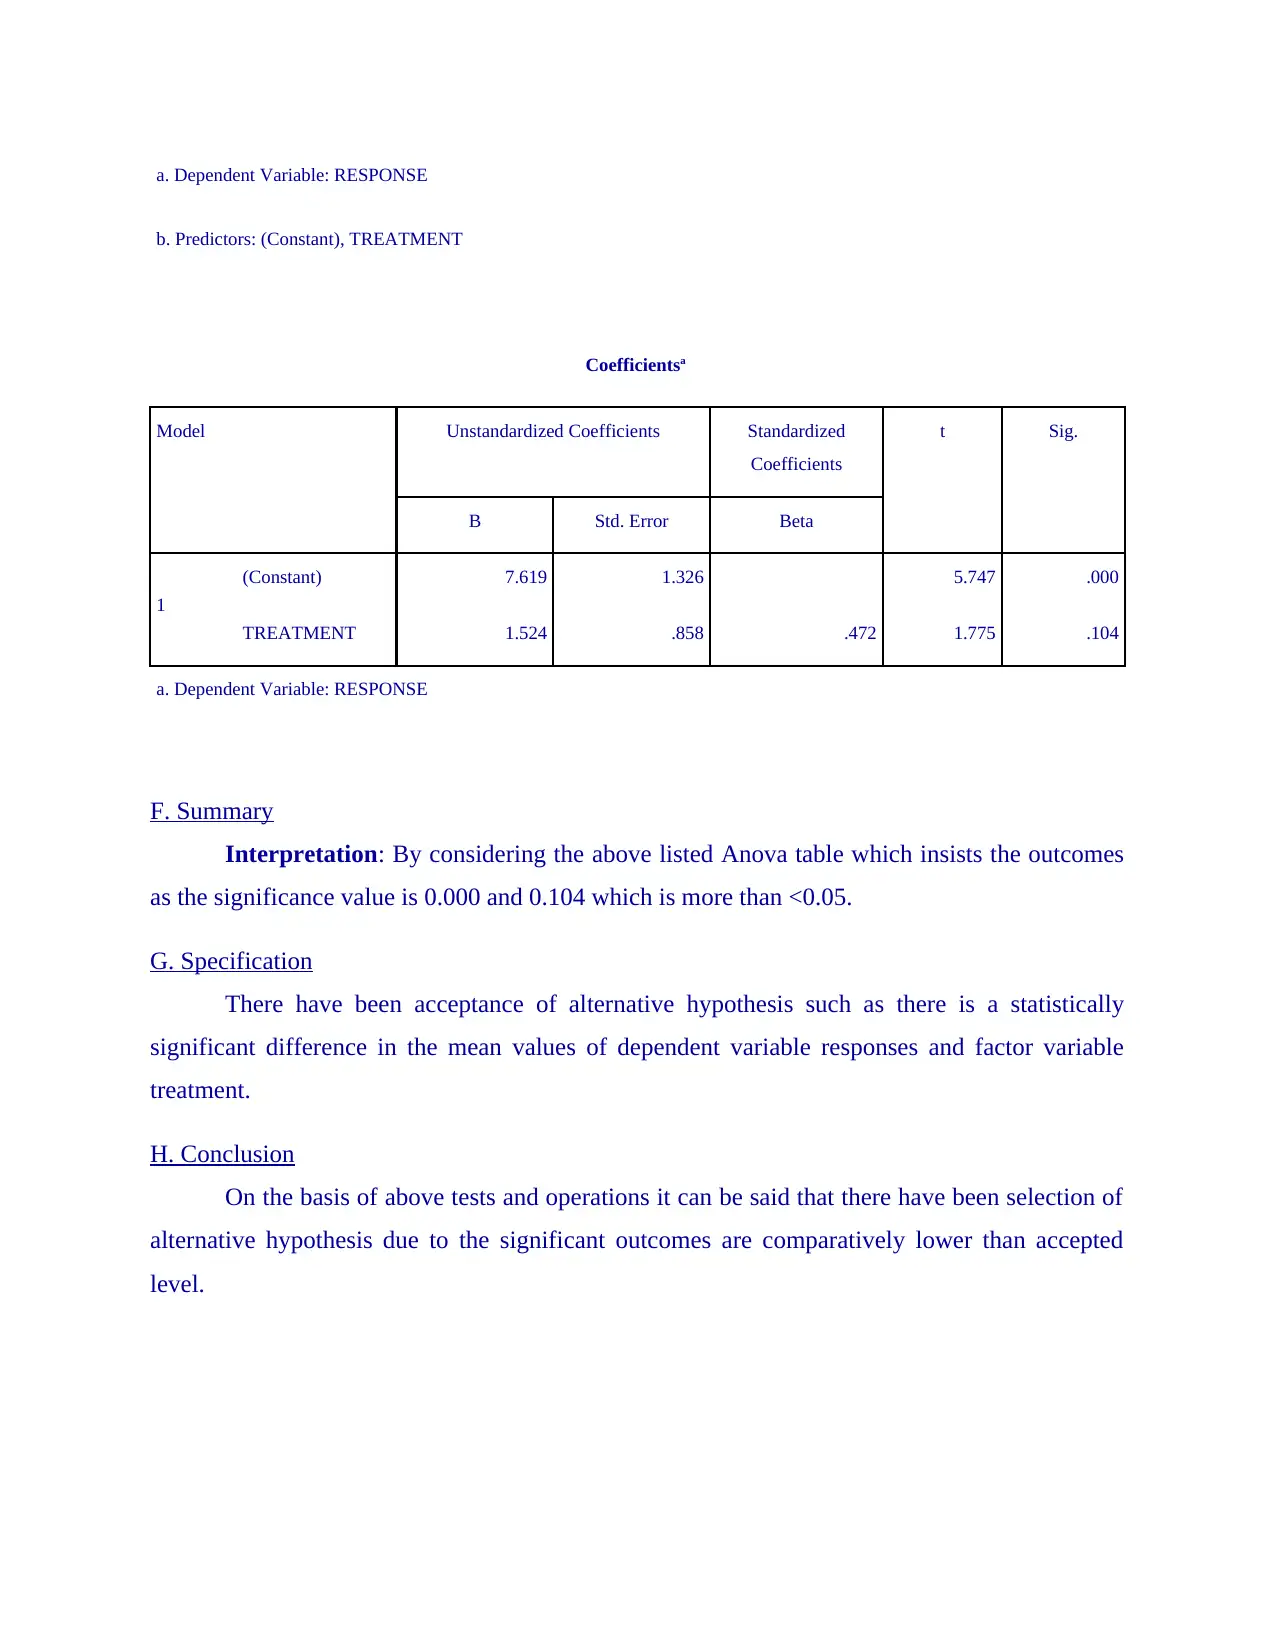
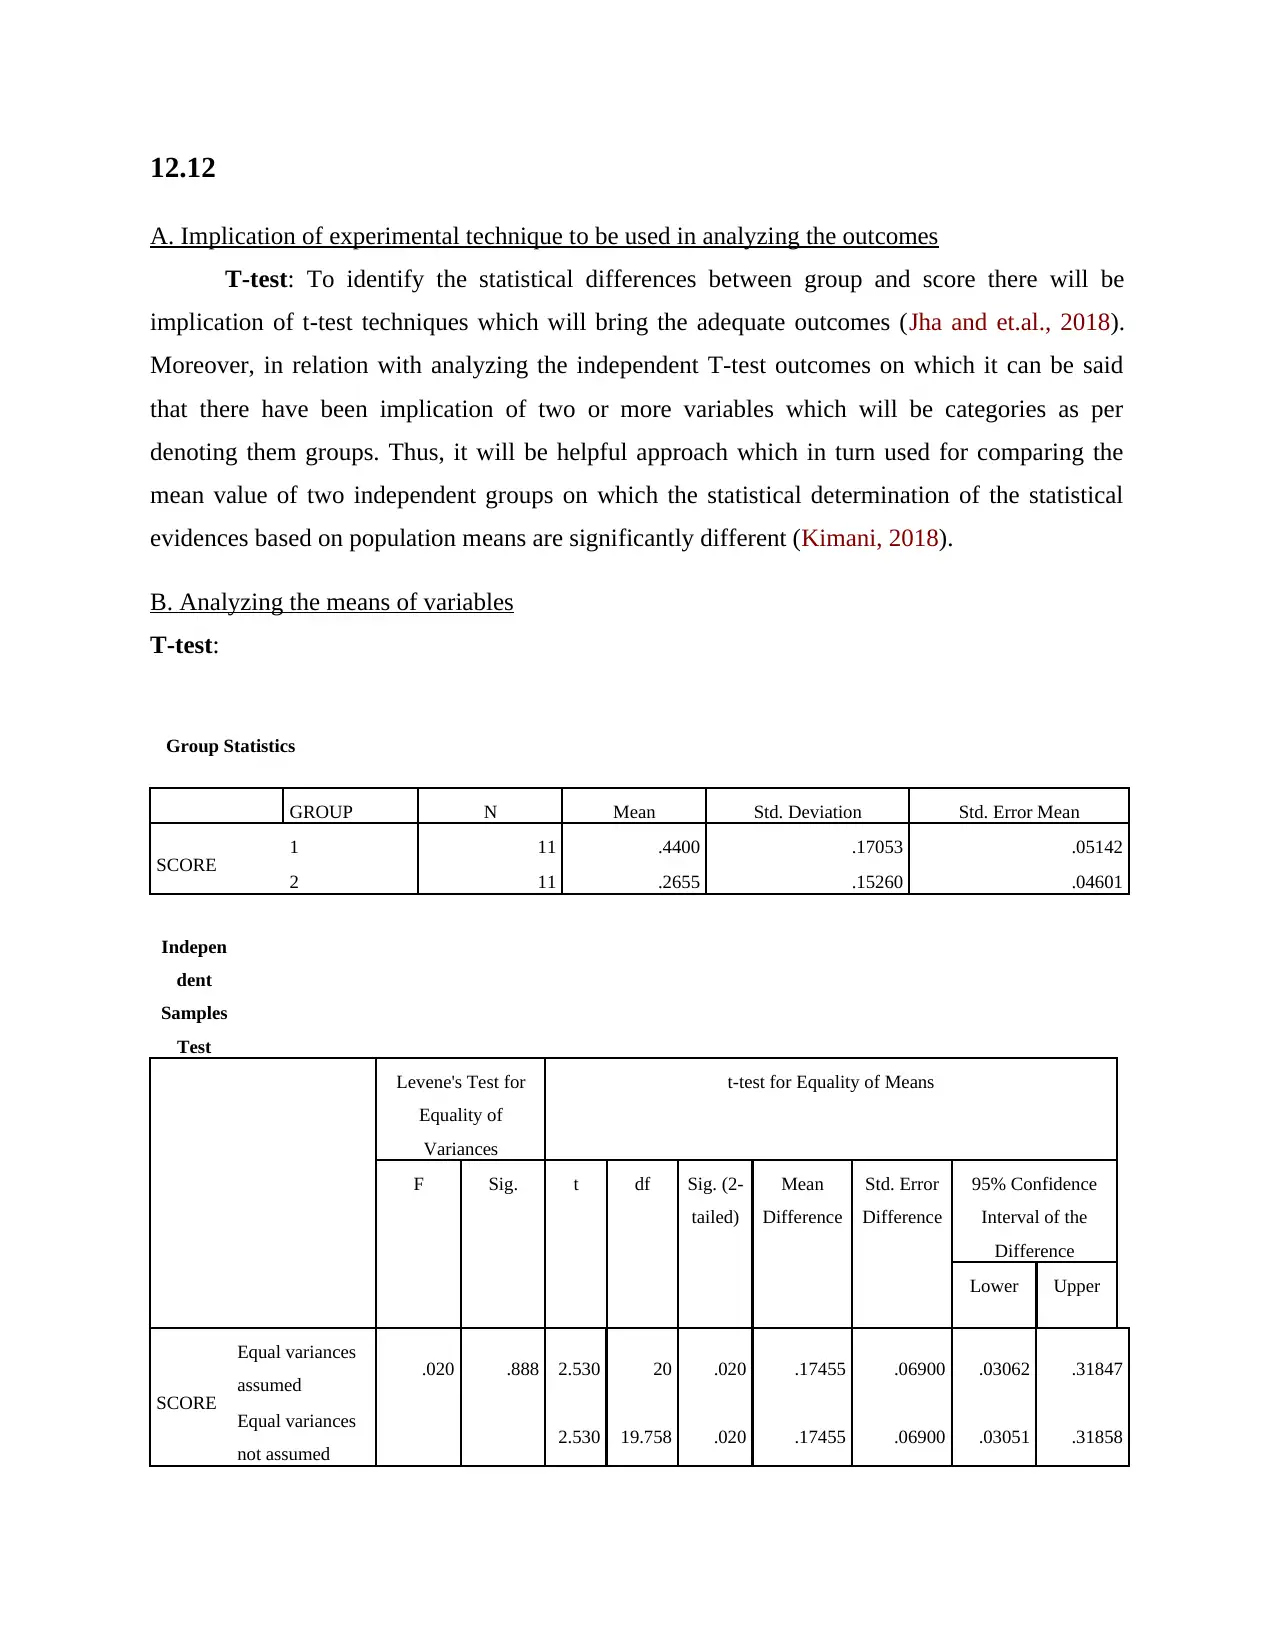
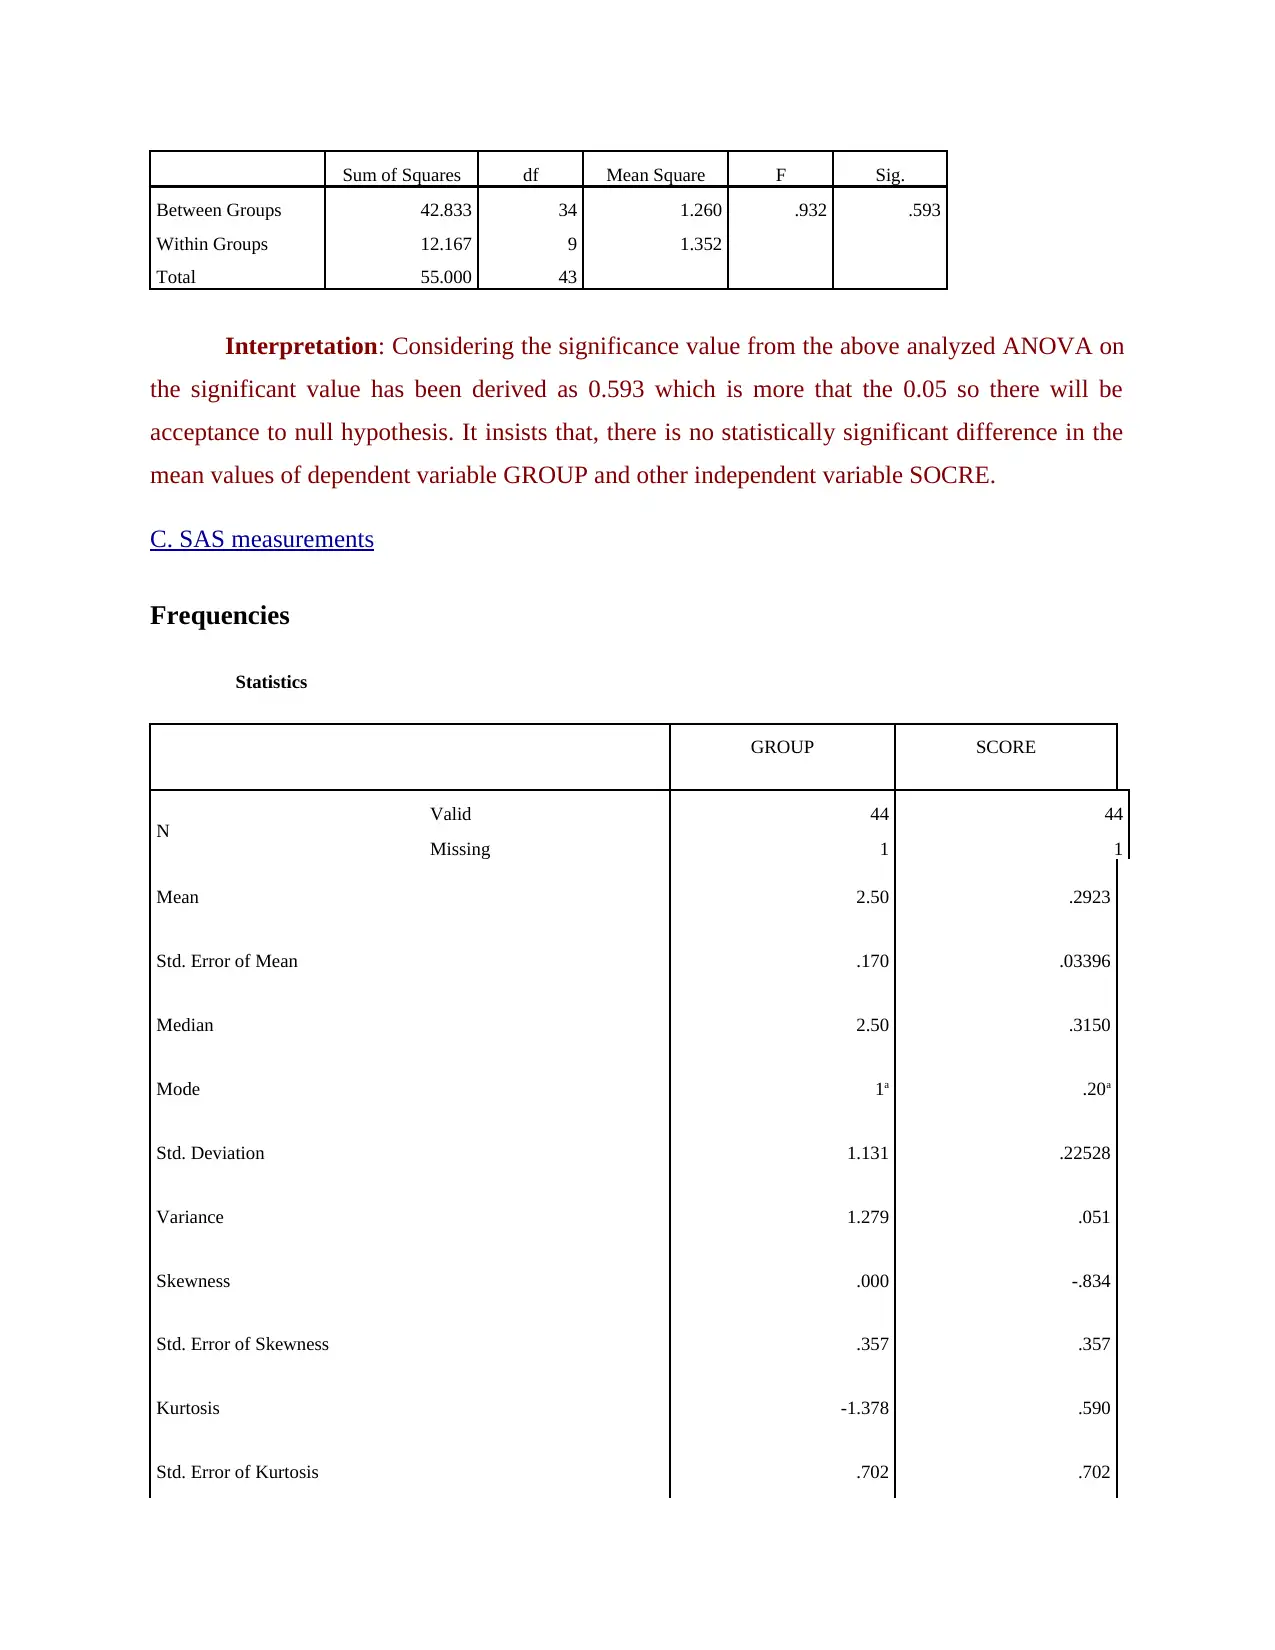
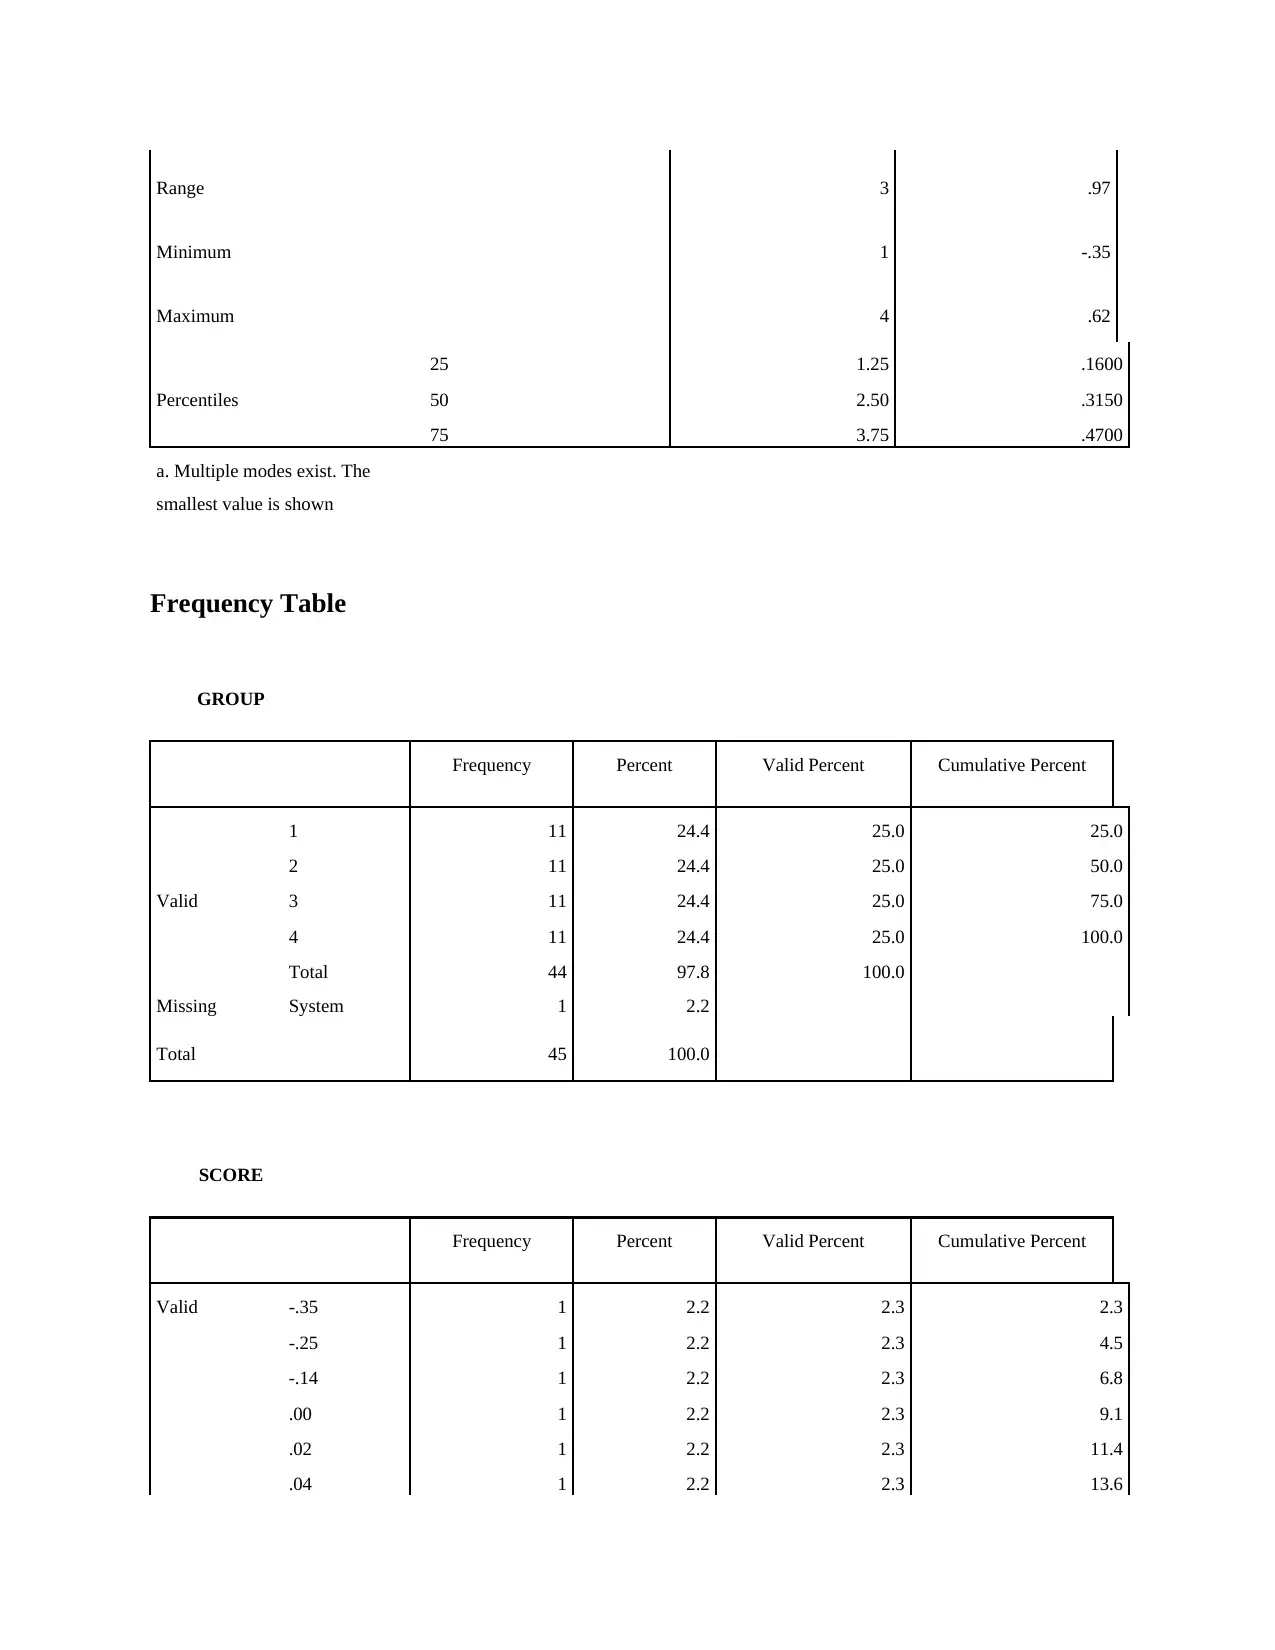
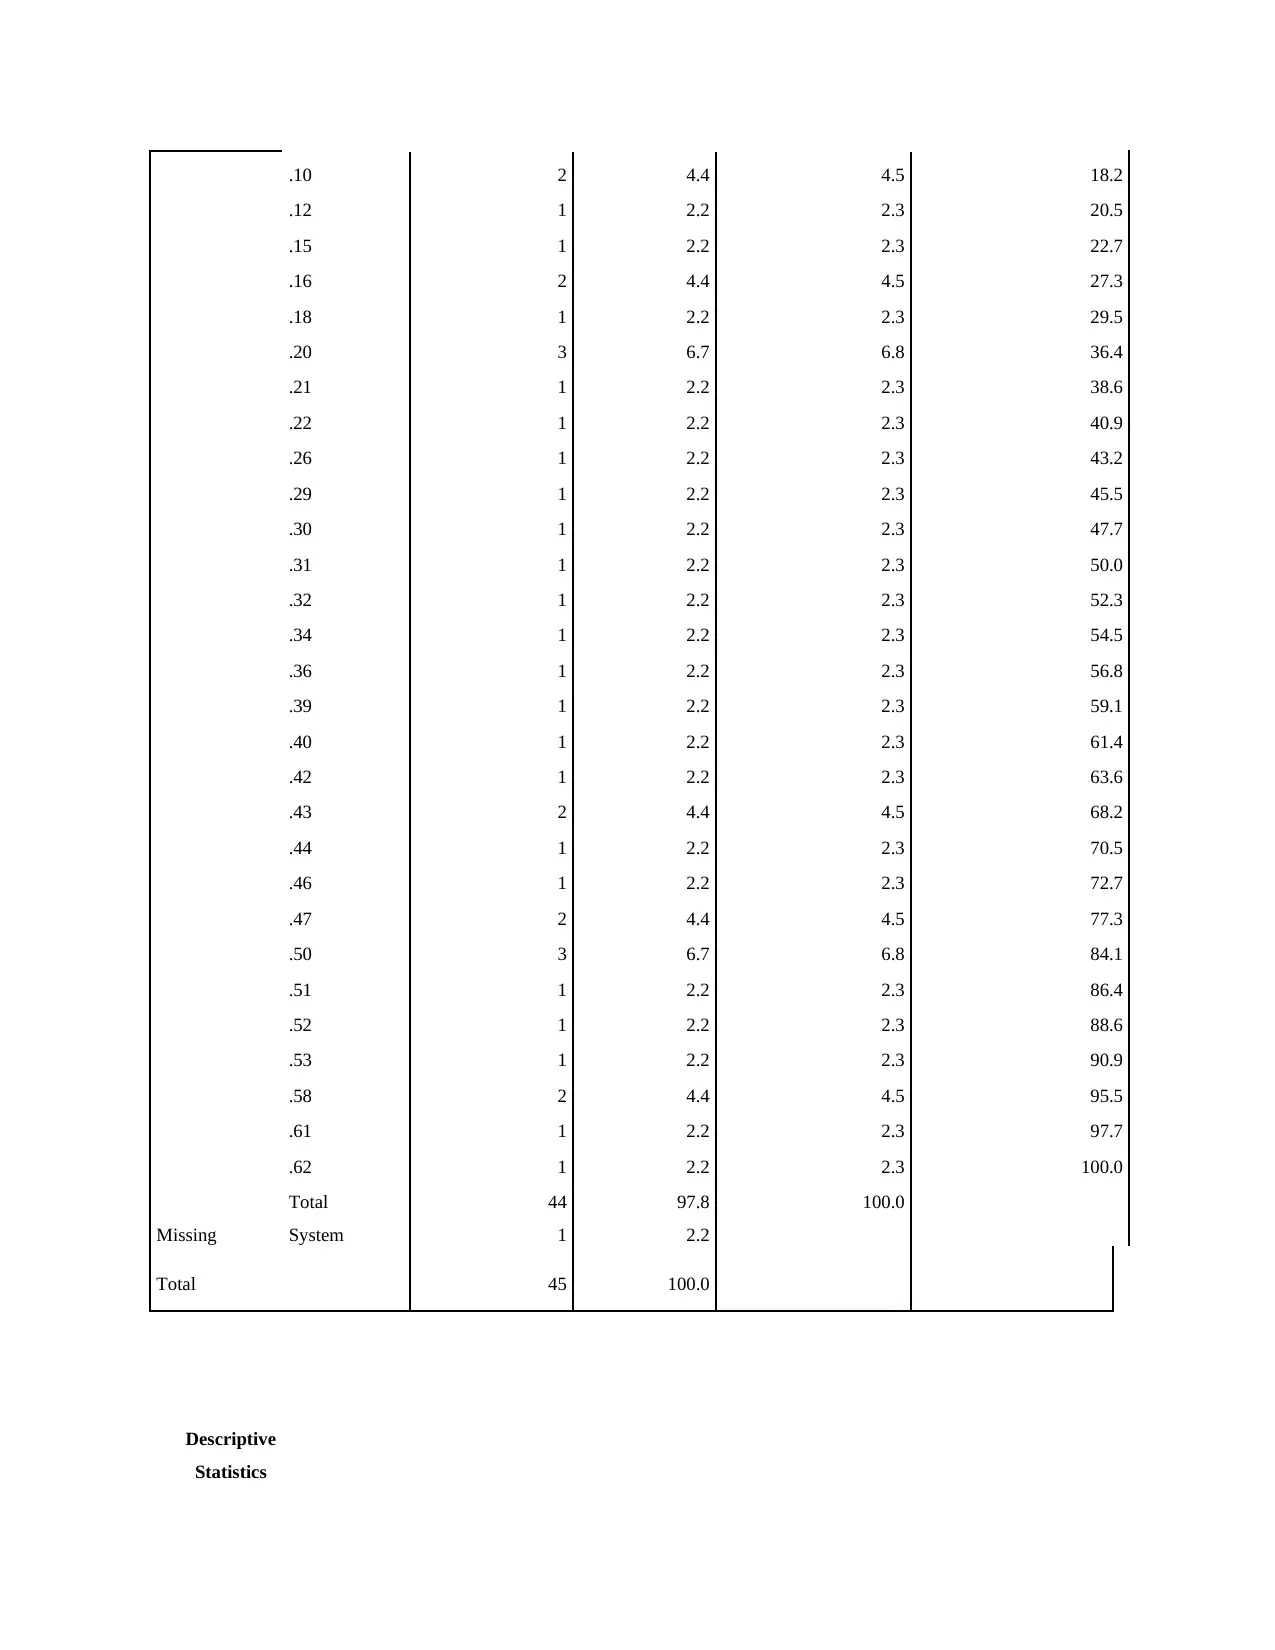
This homework assignment presents a comprehensive analysis of statistical data using SPSS. The assignment includes a table of contents, an honesty statement, and detailed solutions to various statistical problems. The student applies ANOVA, t-tests, and regression techniques to analyze different datasets. The assignment involves interpreting SPSS outputs, including ANOVA tables, model summaries, descriptive statistics, and correlation matrices. Each problem includes a description, the specific questions addressed, and the relevant SPSS outputs, along with the student's interpretations and conclusions. The analyses cover hypothesis testing, the significance of variables, and the implications of the findings. The assignment demonstrates the application of statistical methods to draw meaningful conclusions from data, with detailed explanations and interpretations of the results. The student provides a summary of the findings and their implications based on the statistical evidence. The assignment follows APA formatting guidelines, including a title page, page numbers, and a table of contents.
Document Page
SPSS
tabler-icon-diamond-filled.svg

Paraphrase This Document

Need a fresh take? Get an instant paraphrase of this document with our AI Paraphraser
Document Page
TABLE OF CONTENTS
12.2...................................................................................................................................................4
A ANOVA table..........................................................................................................................4
B. Number of treatments are involved in experiment..................................................................4
C. Implicating the sufficient evidence to indicates a difference among the treatment a= .10.....4
12. 4..................................................................................................................................................4
A. Applicating MST.....................................................................................................................5
b. Measuring MSE.......................................................................................................................5
C. df in MST................................................................................................................................5
D. df in MSE................................................................................................................................6
E. Statistical analysis...................................................................................................................6
F. Summary..................................................................................................................................7
G. Specification............................................................................................................................7
H. Conclusion..............................................................................................................................7
12.12.................................................................................................................................................7
A. Implication of experimental technique to be used in analyzing the outcomes.......................7
B. Analyzing the means of variables...........................................................................................8
C Assumptions.............................................................................................................................8
12.14.................................................................................................................................................9
A. Identification of the treatment to be followed.........................................................................9
B Conducting the analysis over variance on data and interpretation of outcomes......................9
12.22.................................................................................................................................................9
A comparison of hypothesis.........................................................................................................9
B. Representing ANOVA table....................................................................................................9
Document Page
C. SAS measurements................................................................................................................10
12.24...............................................................................................................................................12
12.26...............................................................................................................................................13
Regression .................................................................................................................................13
A Constructing and ANOVA summary table............................................................................13
B. Punching power means..........................................................................................................14
C. Removing an unwanted source of variable...........................................................................14
12.36...............................................................................................................................................15
A. Identification of varaious factors and treatments..................................................................16
B. Conducting research through ANOVA table........................................................................16
Regression..................................................................................................................................16
C. Evidences for interaction between Housing system and Weight class.................................17
REFERENCES..............................................................................................................................19
Document Page
12.2
A ANOVA table
Null hypothesis (H0): There is no statistically significant difference in the mean values of
Treatment and Errors
Alternative hypothesis (H1): There is a statistically significant difference in the mean values of
Treatment and Errors
SOURCE df ss MS F P
Treatments 4 24.7 6.18 4.91 0
Error 30 37.7 1.26
Total 34 62.4
B. Number of treatments are involved in experiment
There are 4 treatments which have been used for examination.
C. Implicating the sufficient evidence to indicates a difference among the treatment a= .10
On the basis of above report it can be said that there are various issues and operational
management of operations which will be helpful and assistive in terms of making suitable control
over operations. However, considering the descriptive analysis on which the outs derived a
significant value as >0.05. On which it can be said that there is a statistically significant
difference in the mean values Treatment and Errors. Therefore, the p value is 0.003 as per
considering a=0.10
12. 4
Hypothesis
tabler-icon-diamond-filled.svg

Paraphrase This Document

Need a fresh take? Get an instant paraphrase of this document with our AI Paraphraser
Document Page
Null hypothesis (H0): There is no statistically significant difference in the mean values of
dependent variable responses and factor variable treatment.
Alternative hypothesis (H1): There is a statistically significant difference in the mean values of
dependent variable responses and factor variable treatment.
A. Applicating MST
SST= Sum square of treatment
=Total sum of square – Correction for mean
= 26.190- 7.502
=18.688
SSE= Sum square of error
=SST-SS
=18.88-26.190
=-7.502
MST= Mean Square for treatments
=SST
P-1
=18.688
0.05-1
= -19.67
b. Measuring MSE
MSE= Mean square for error
=SSE
n-p
-7.502 = -1.079
7-0.05
Document Page
C. df in MST
There are 12 df's are associated with MST
D. df in MSE
There are 12 df's are associated with MSE
E. Statistical analysis
Regression
Variables Entered/Removeda
Model Variables Entered Variables Removed Method
1 TREATMENTb . Enter
a. Dependent Variable: RESPONSE
b. All requested variables entered.
Model Summary
Model R R Square Adjusted R Square Std. Error of the
Estimate
1 .472a .223 .152 1.543
a. Predictors: (Constant), TREATMENT
ANOVAa
Model Sum of Squares df Mean Square F Sig.
1
Regression 7.502 1 7.502 3.151 .104b
Residual 26.190 11 2.381
Total 33.692 12
Document Page
a. Dependent Variable: RESPONSE
b. Predictors: (Constant), TREATMENT
Coefficientsa
Model Unstandardized Coefficients Standardized
Coefficients
t Sig.
B Std. Error Beta
1
(Constant) 7.619 1.326 5.747 .000
TREATMENT 1.524 .858 .472 1.775 .104
a. Dependent Variable: RESPONSE
F. Summary
Interpretation: By considering the above listed Anova table which insists the outcomes
as the significance value is 0.000 and 0.104 which is more than <0.05.
G. Specification
There have been acceptance of alternative hypothesis such as there is a statistically
significant difference in the mean values of dependent variable responses and factor variable
treatment.
H. Conclusion
On the basis of above tests and operations it can be said that there have been selection of
alternative hypothesis due to the significant outcomes are comparatively lower than accepted
level.
tabler-icon-diamond-filled.svg

Paraphrase This Document

Need a fresh take? Get an instant paraphrase of this document with our AI Paraphraser
Document Page
12.12
A. Implication of experimental technique to be used in analyzing the outcomes
T-test: To identify the statistical differences between group and score there will be
implication of t-test techniques which will bring the adequate outcomes (Jha and et.al., 2018).
Moreover, in relation with analyzing the independent T-test outcomes on which it can be said
that there have been implication of two or more variables which will be categories as per
denoting them groups. Thus, it will be helpful approach which in turn used for comparing the
mean value of two independent groups on which the statistical determination of the statistical
evidences based on population means are significantly different (Kimani, 2018).
B. Analyzing the means of variables
T-test:
Group Statistics
GROUP N Mean Std. Deviation Std. Error Mean
SCORE 1 11 .4400 .17053 .05142
2 11 .2655 .15260 .04601
Indepen
dent
Samples
Test
Levene's Test for
Equality of
Variances
t-test for Equality of Means
F Sig. t df Sig. (2-
tailed)
Mean
Difference
Std. Error
Difference
95% Confidence
Interval of the
Difference
Lower Upper
SCORE
Equal variances
assumed .020 .888 2.530 20 .020 .17455 .06900 .03062 .31847
Equal variances
not assumed 2.530 19.758 .020 .17455 .06900 .03051 .31858
Document Page
C Assumptions
Interpretation: By considering the above listed table it can be said that there have been
consideration over the score and group. The significant value is less than 0.05 on which it can be
said that the alternative hypothesis will be selected as there will be a significant statistical
relationship between group and score.
12.14
A. Identification of the treatment to be followed.
In relation with ascertaining the outcomes there have been use of various outcomes. In
relation with analyzing the outcomes as considering population there is needed to have adequate
determination of the facts (Annotated output, 2018). Thus, considering descriptive analysis, one
way ANOVAs and various techniques which will be helpful in determining outcomes (Kimani,
Waititu and Iravo, 2017).
B Conducting the analysis over variance on data and interpretation of outcomes
12.22
A comparison of hypothesis
One way ANOVA
Null hypothesis (H0): There is no statistically significant difference in the mean values of
dependent variable GROUP and other independent variable SOCRE.
Alternative hypothesis (H1): There is a statistically significant difference in the mean values of
variable GROUP and other independent variable SOCRE.
B. Representing ANOVA table
ANOVA
GROUP
Document Page
Sum of Squares df Mean Square F Sig.
Between Groups 42.833 34 1.260 .932 .593
Within Groups 12.167 9 1.352
Total 55.000 43
Interpretation: Considering the significance value from the above analyzed ANOVA on
the significant value has been derived as 0.593 which is more that the 0.05 so there will be
acceptance to null hypothesis. It insists that, there is no statistically significant difference in the
mean values of dependent variable GROUP and other independent variable SOCRE.
C. SAS measurements
Frequencies
Statistics
GROUP SCORE
N Valid 44 44
Missing 1 1
Mean 2.50 .2923
Std. Error of Mean .170 .03396
Median 2.50 .3150
Mode 1a .20a
Std. Deviation 1.131 .22528
Variance 1.279 .051
Skewness .000 -.834
Std. Error of Skewness .357 .357
Kurtosis -1.378 .590
Std. Error of Kurtosis .702 .702
tabler-icon-diamond-filled.svg

Paraphrase This Document

Need a fresh take? Get an instant paraphrase of this document with our AI Paraphraser
Document Page
Range 3 .97
Minimum 1 -.35
Maximum 4 .62
Percentiles
25 1.25 .1600
50 2.50 .3150
75 3.75 .4700
a. Multiple modes exist. The
smallest value is shown
Frequency Table
GROUP
Frequency Percent Valid Percent Cumulative Percent
Valid
1 11 24.4 25.0 25.0
2 11 24.4 25.0 50.0
3 11 24.4 25.0 75.0
4 11 24.4 25.0 100.0
Total 44 97.8 100.0
Missing System 1 2.2
Total 45 100.0
SCORE
Frequency Percent Valid Percent Cumulative Percent
Valid -.35 1 2.2 2.3 2.3
-.25 1 2.2 2.3 4.5
-.14 1 2.2 2.3 6.8
.00 1 2.2 2.3 9.1
.02 1 2.2 2.3 11.4
.04 1 2.2 2.3 13.6
Document Page
.10 2 4.4 4.5 18.2
.12 1 2.2 2.3 20.5
.15 1 2.2 2.3 22.7
.16 2 4.4 4.5 27.3
.18 1 2.2 2.3 29.5
.20 3 6.7 6.8 36.4
.21 1 2.2 2.3 38.6
.22 1 2.2 2.3 40.9
.26 1 2.2 2.3 43.2
.29 1 2.2 2.3 45.5
.30 1 2.2 2.3 47.7
.31 1 2.2 2.3 50.0
.32 1 2.2 2.3 52.3
.34 1 2.2 2.3 54.5
.36 1 2.2 2.3 56.8
.39 1 2.2 2.3 59.1
.40 1 2.2 2.3 61.4
.42 1 2.2 2.3 63.6
.43 2 4.4 4.5 68.2
.44 1 2.2 2.3 70.5
.46 1 2.2 2.3 72.7
.47 2 4.4 4.5 77.3
.50 3 6.7 6.8 84.1
.51 1 2.2 2.3 86.4
.52 1 2.2 2.3 88.6
.53 1 2.2 2.3 90.9
.58 2 4.4 4.5 95.5
.61 1 2.2 2.3 97.7
.62 1 2.2 2.3 100.0
Total 44 97.8 100.0
Missing System 1 2.2
Total 45 100.0
Descriptive
Statistics
chevron_up_icon
1 out of 19
circle_padding
hide_on_mobile
zoom_out_icon
[object Object]