Analyzing Dislikeability & Group Effects on Score via SPSS UNIANOVA

Verified

Added on  2023/06/14

|10
|1356
|110
Report
AI Summary
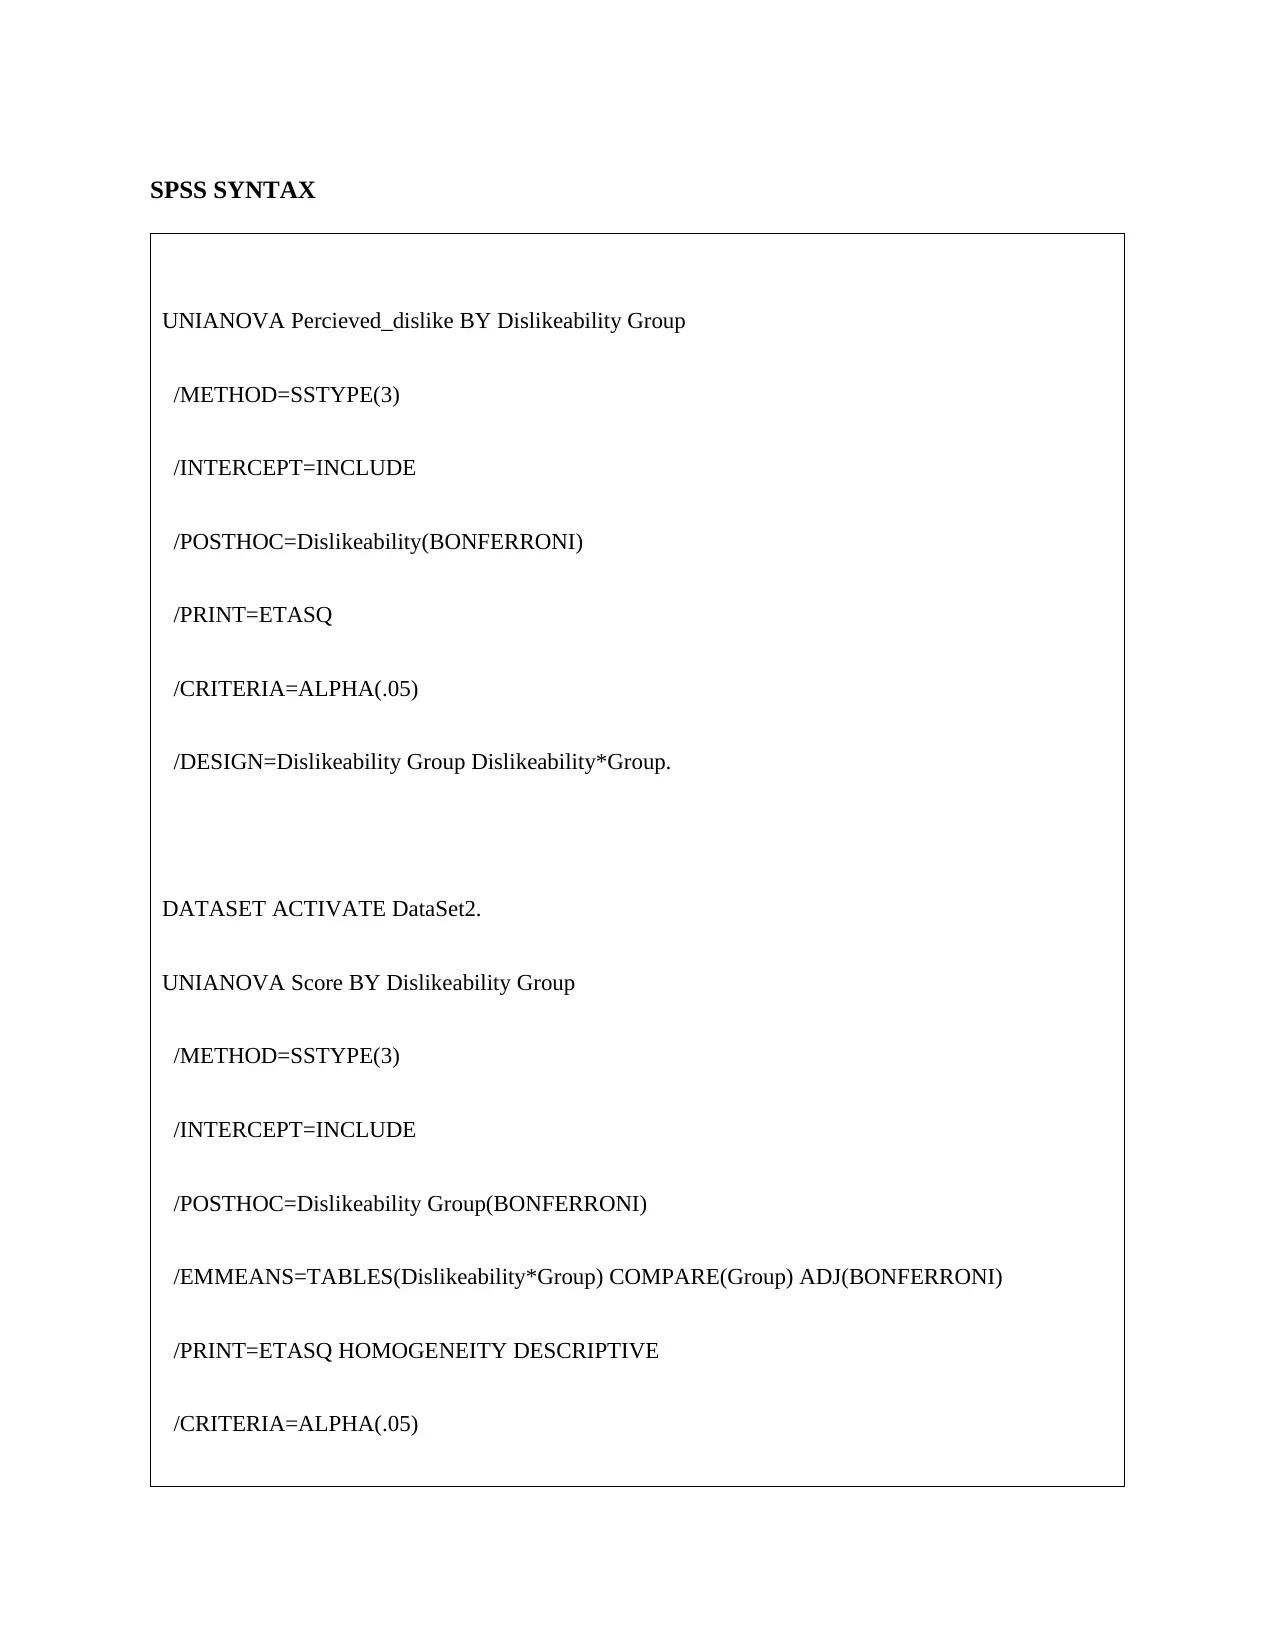
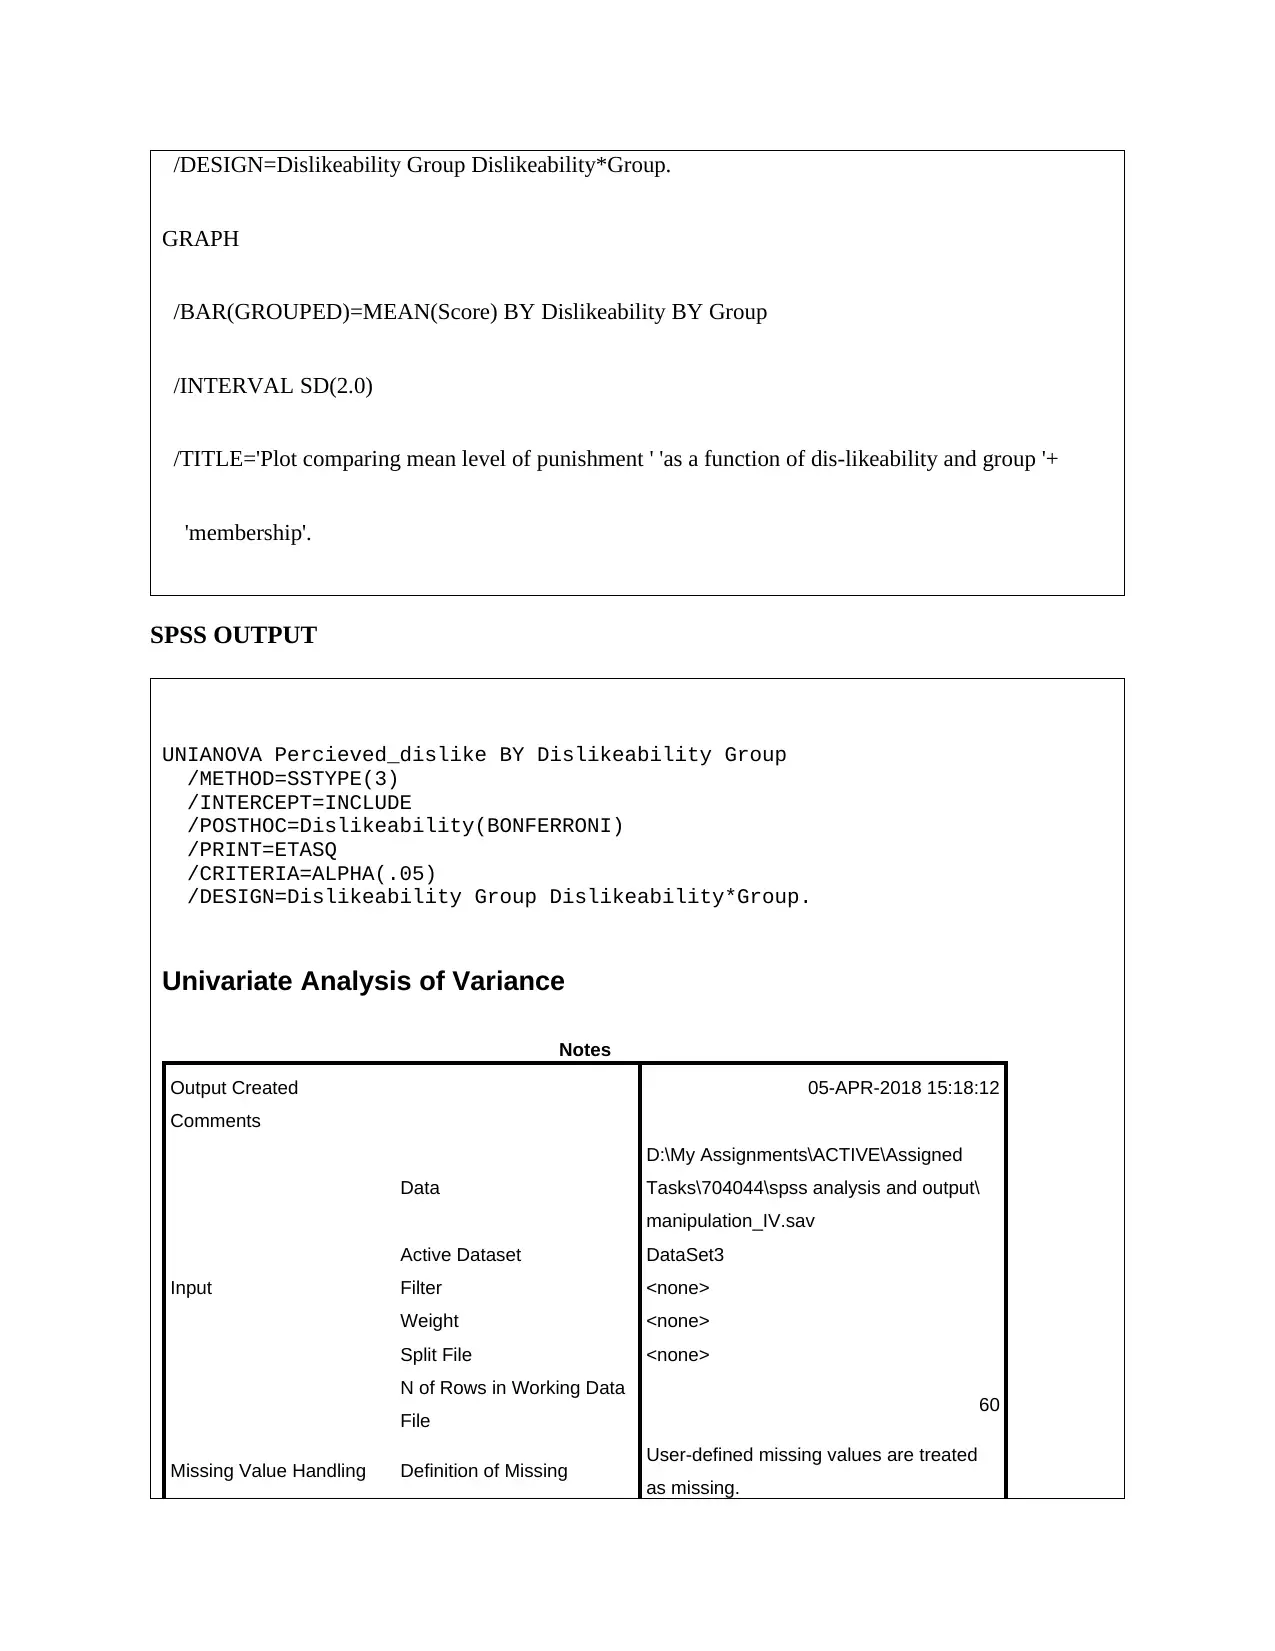
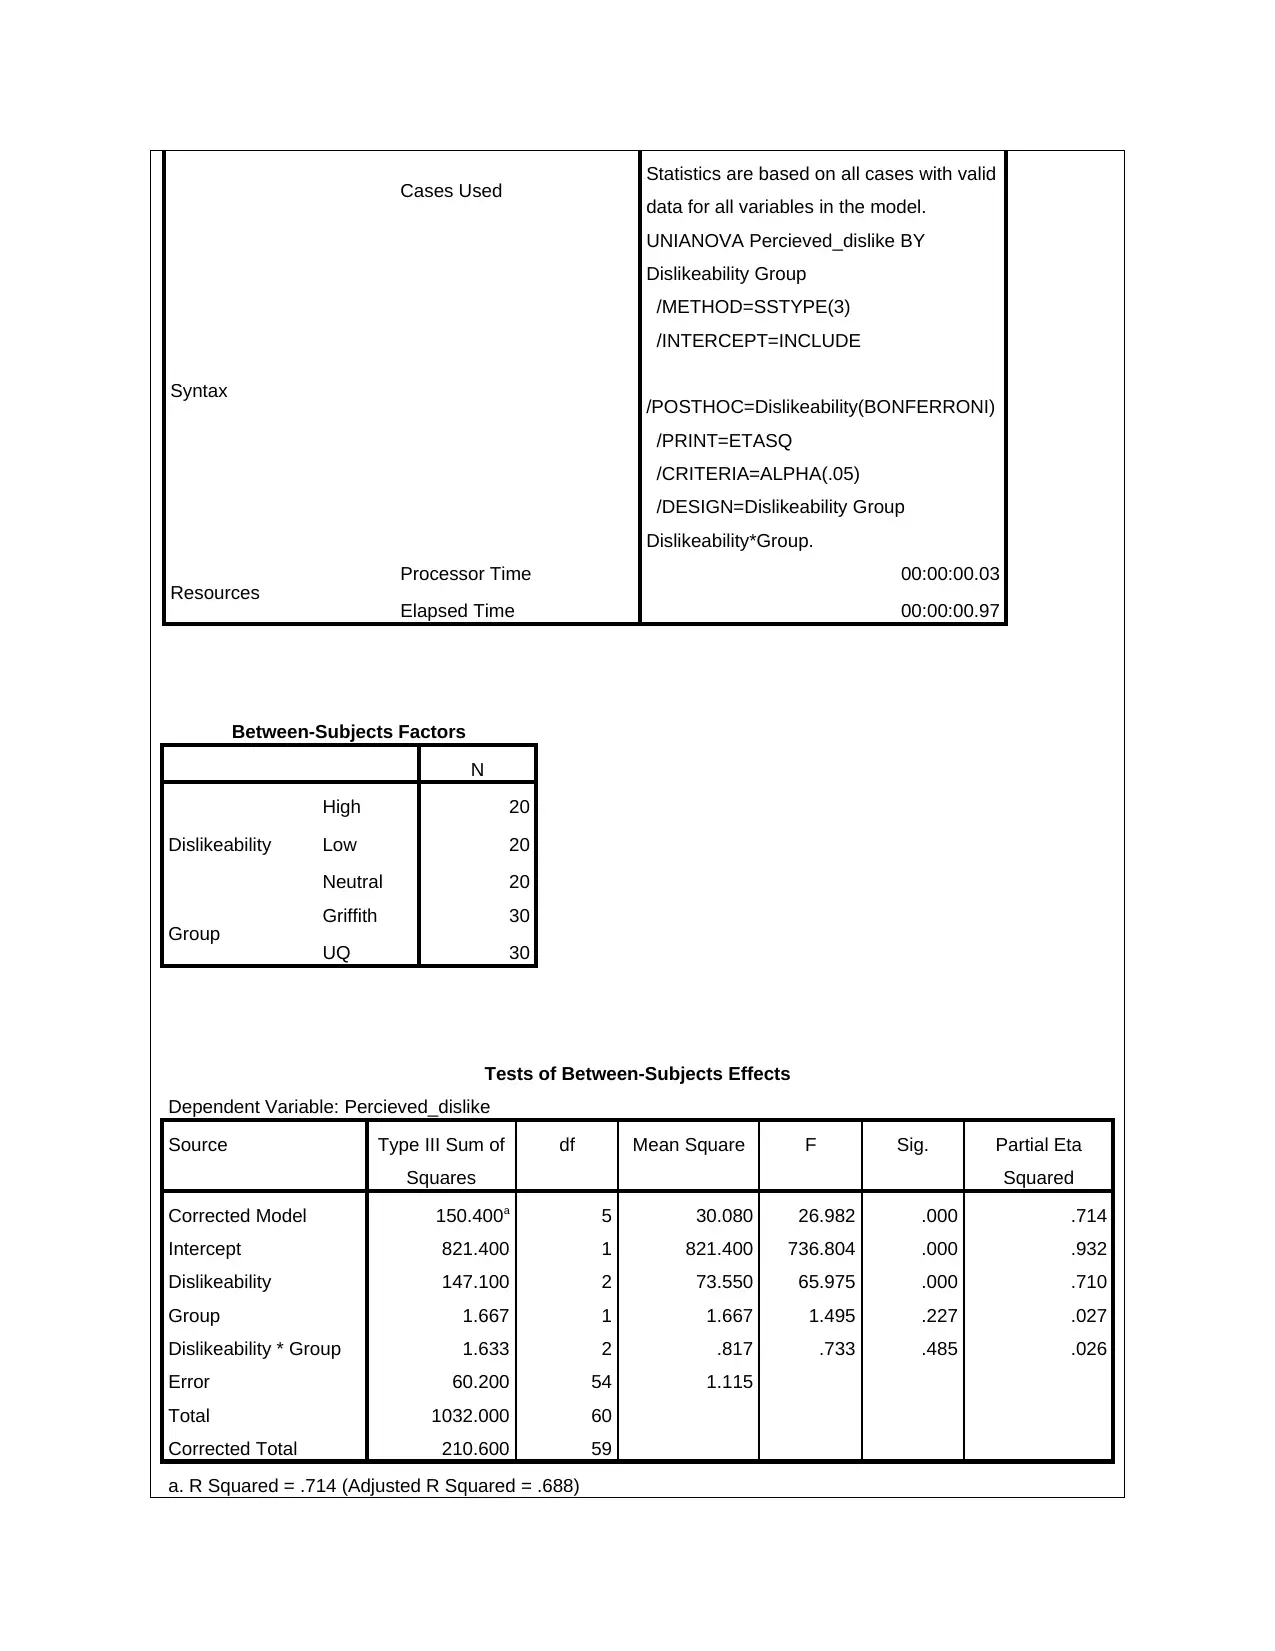
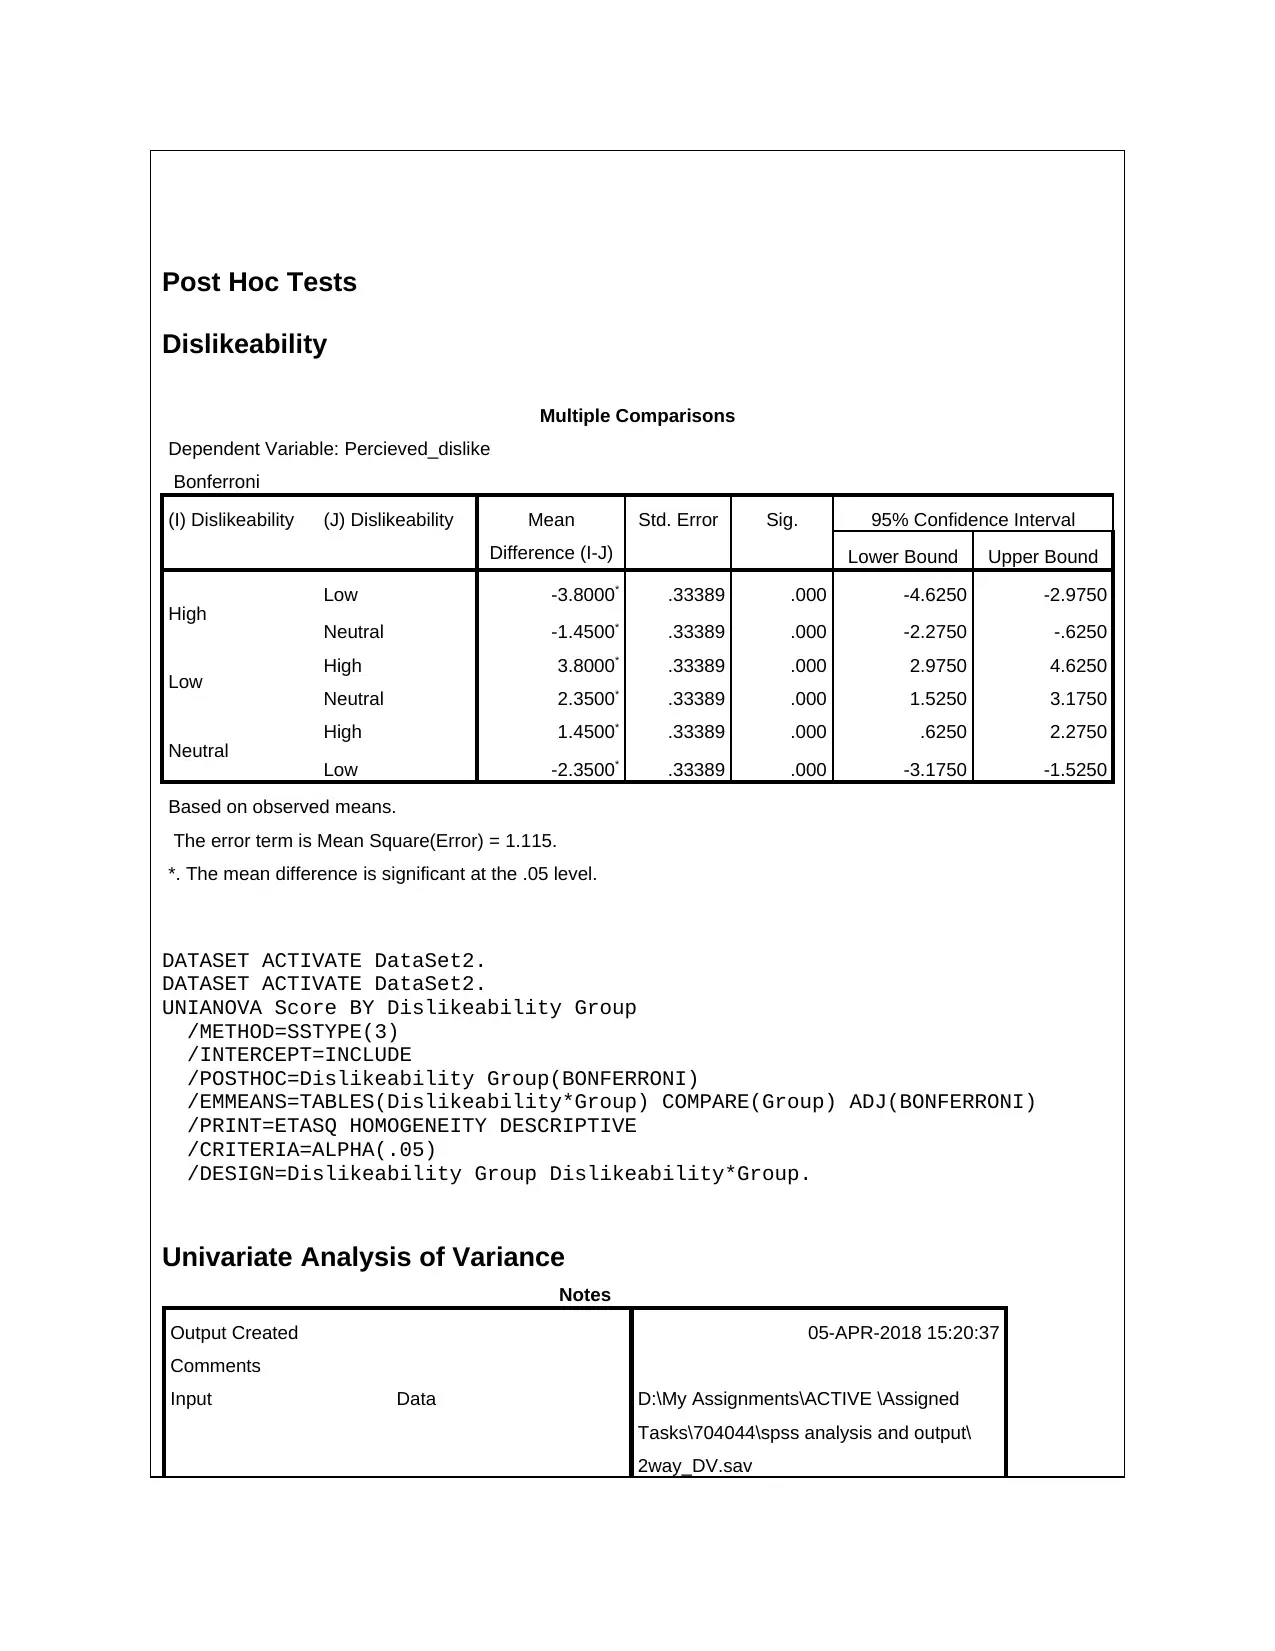
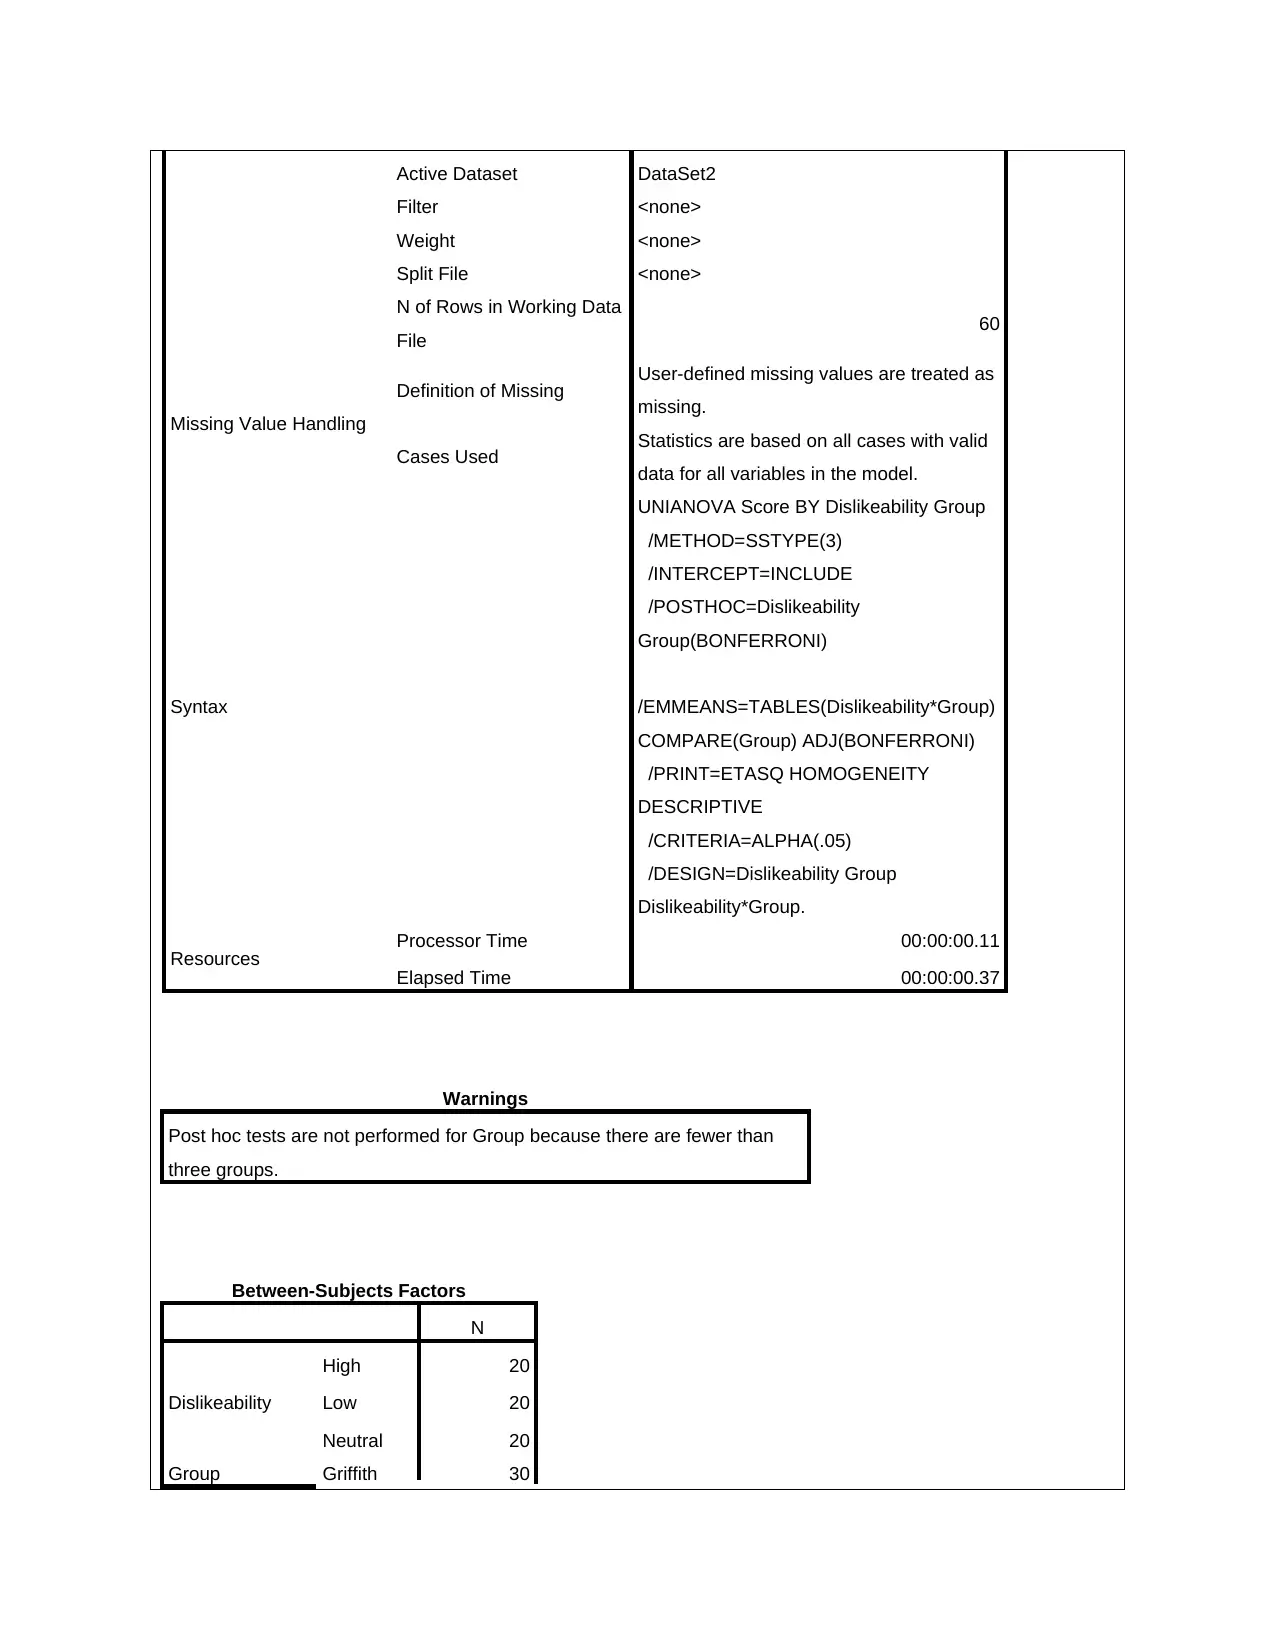
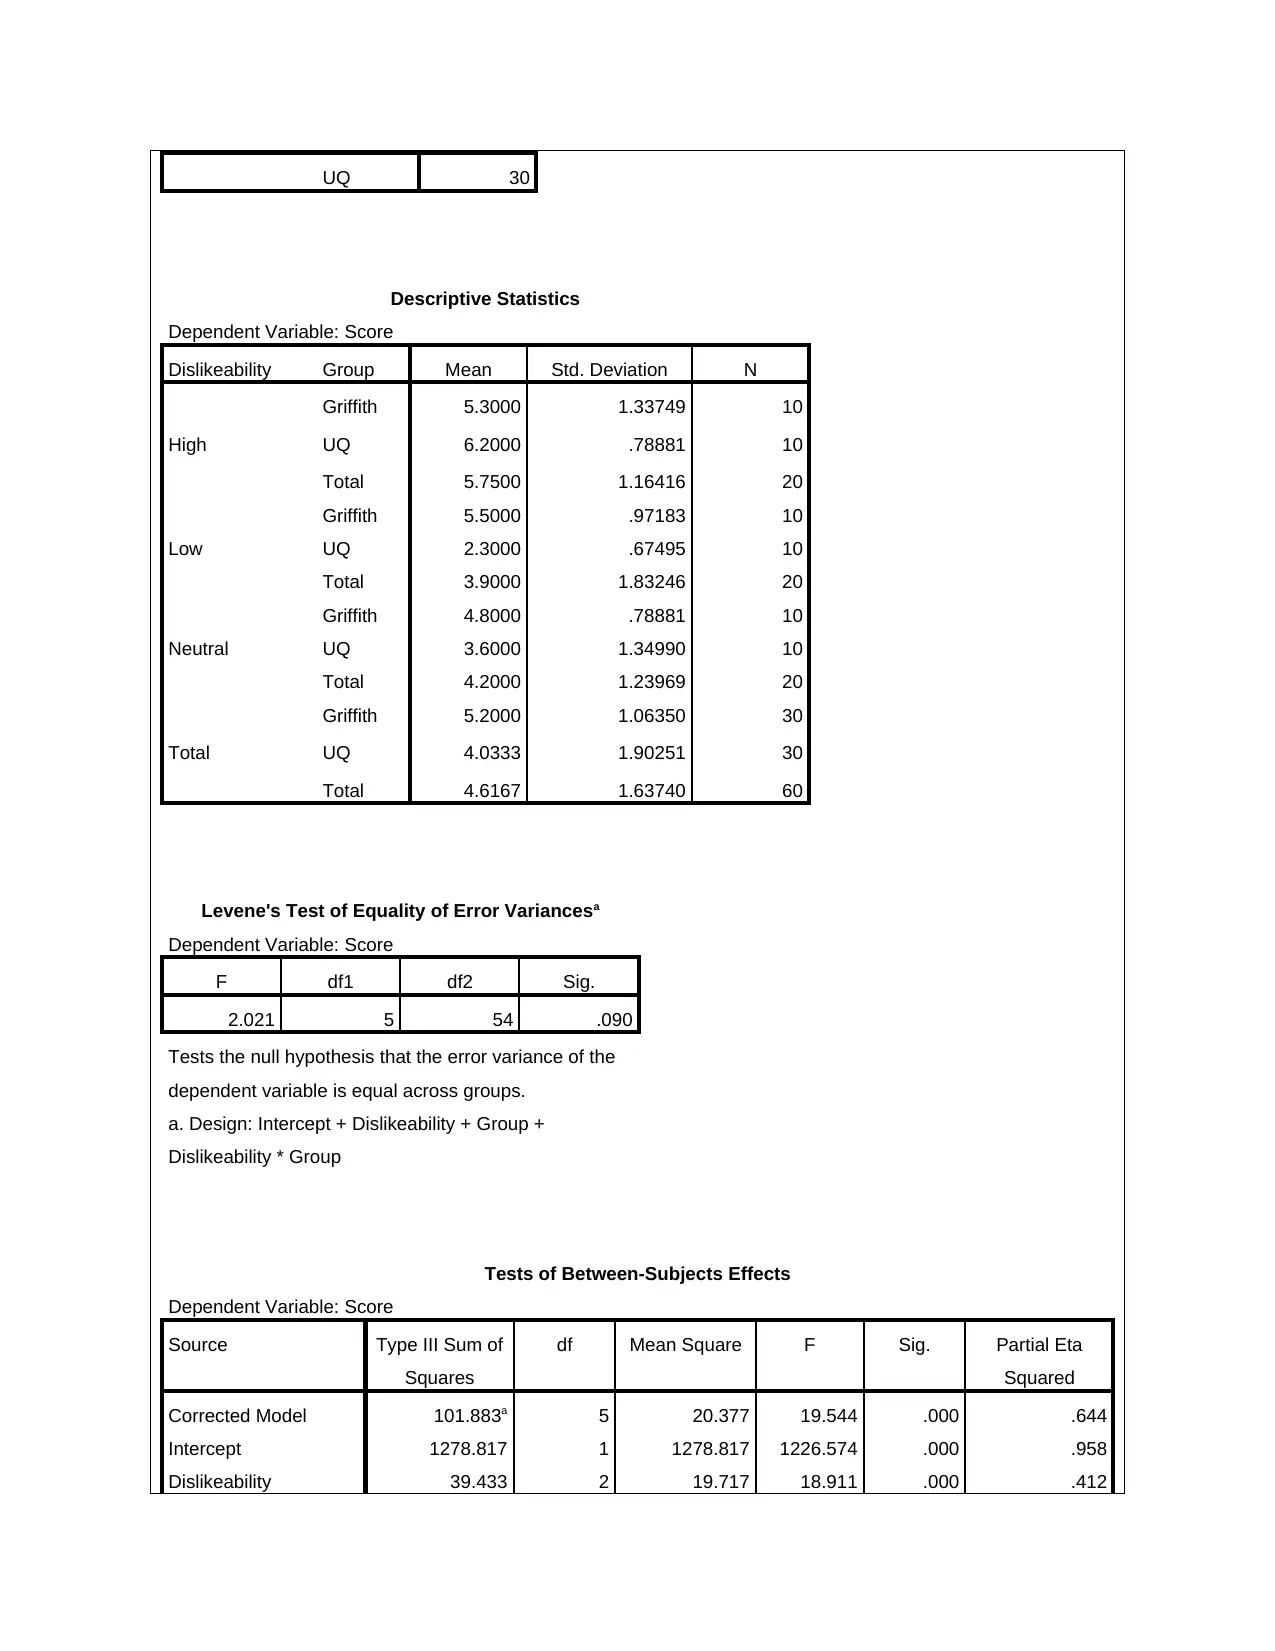
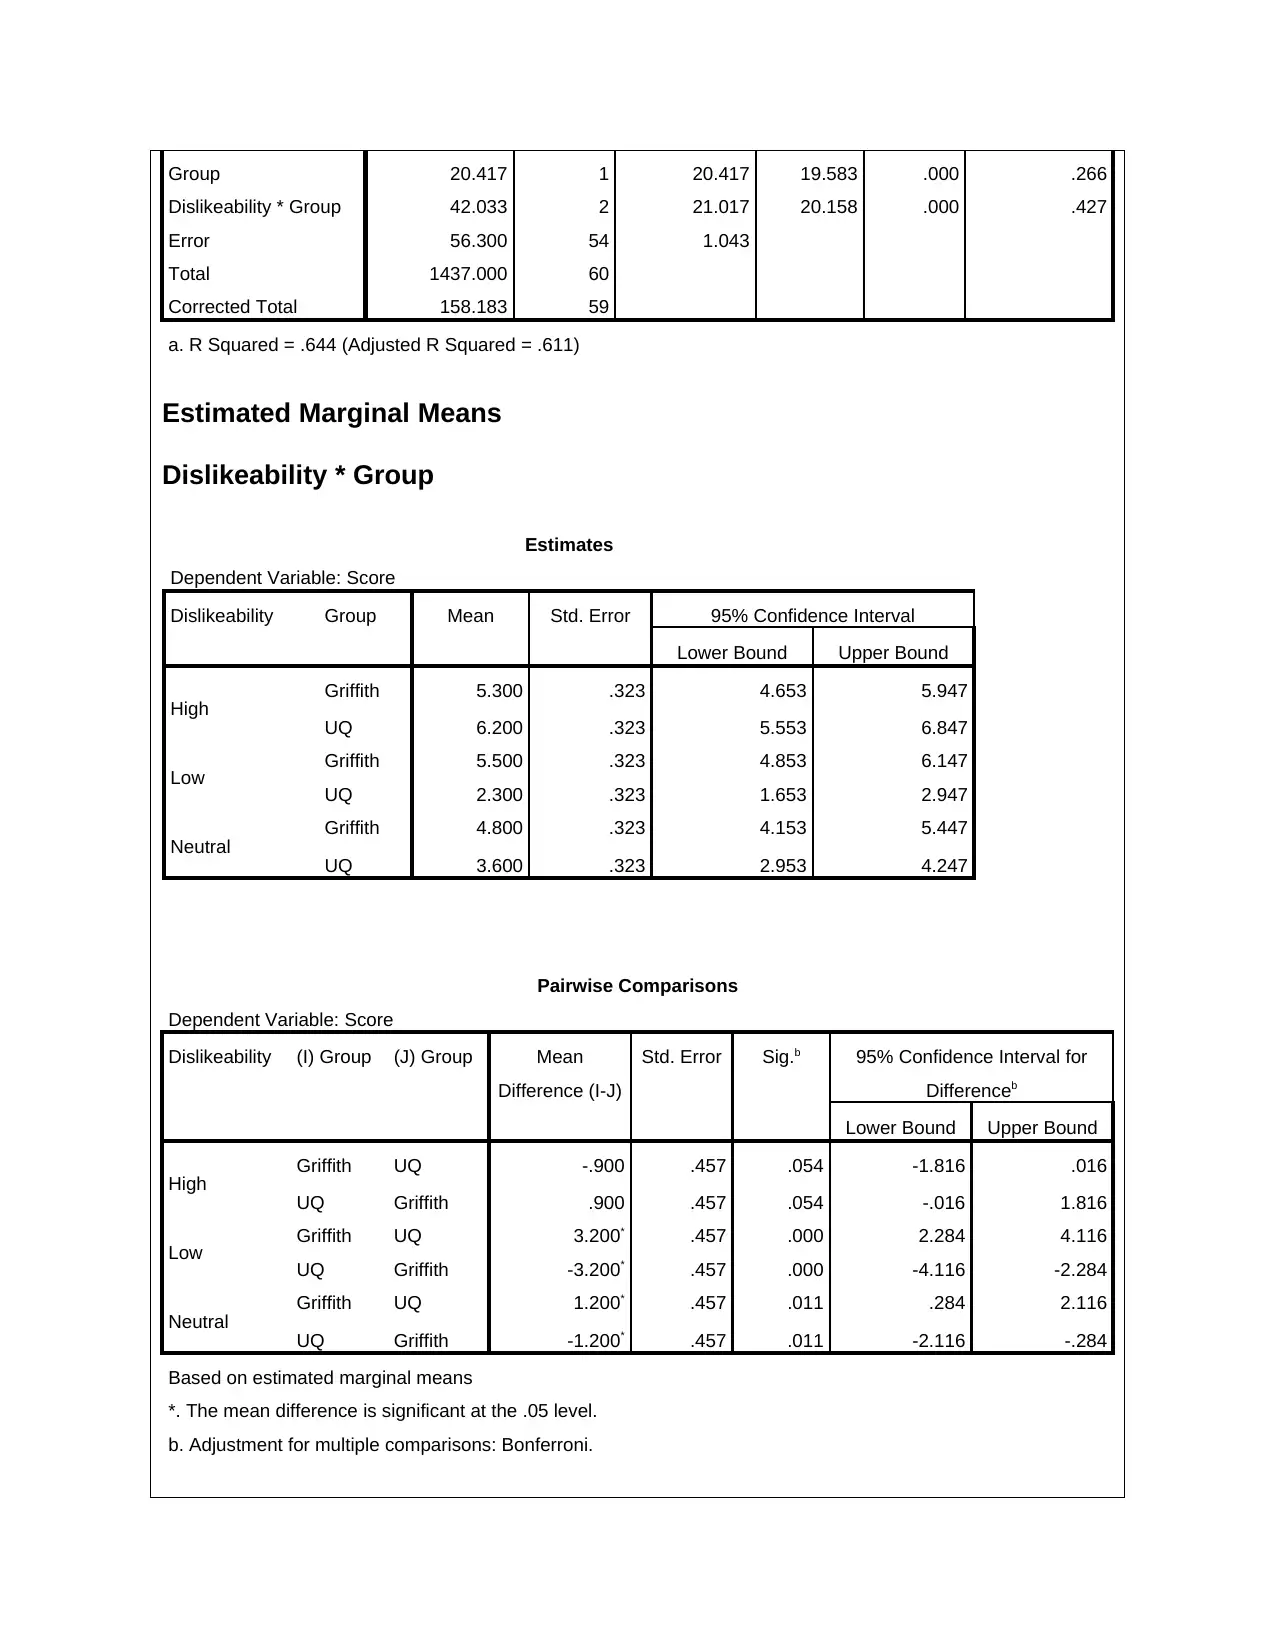
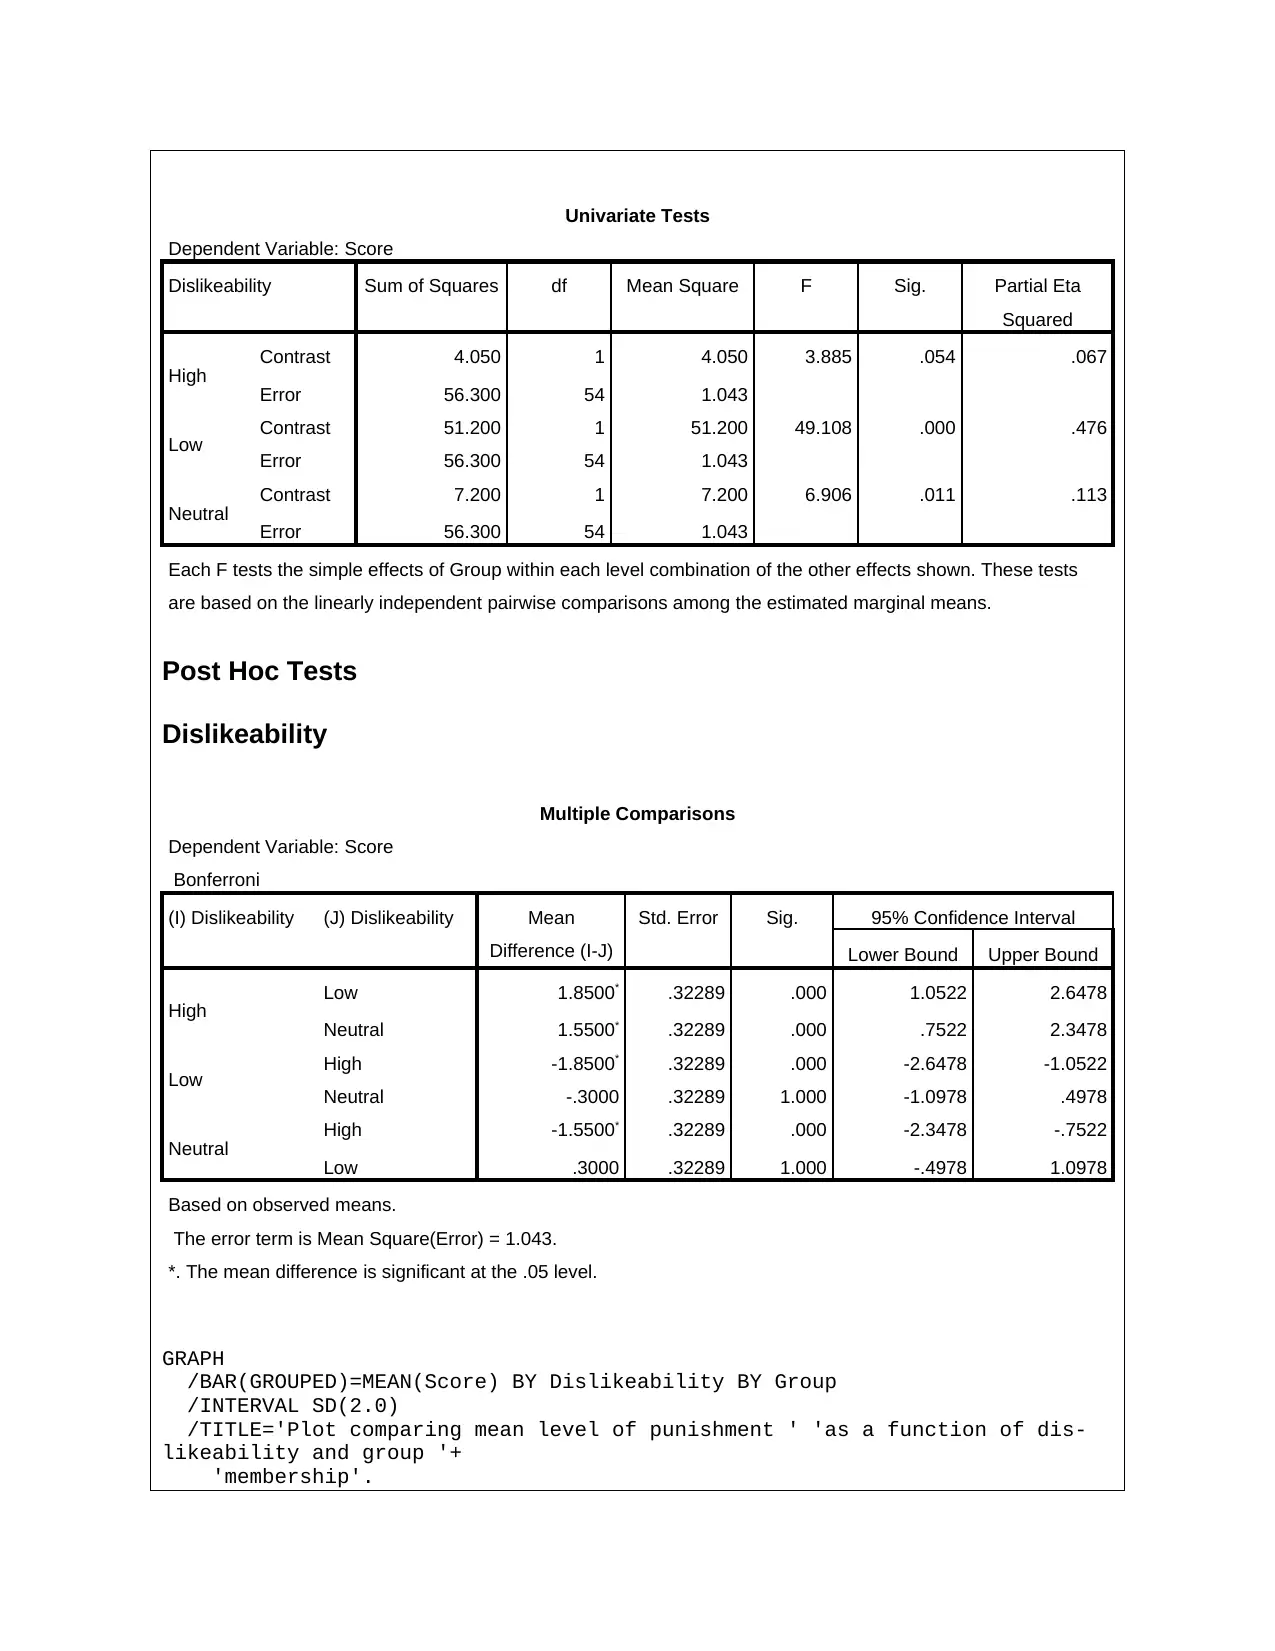
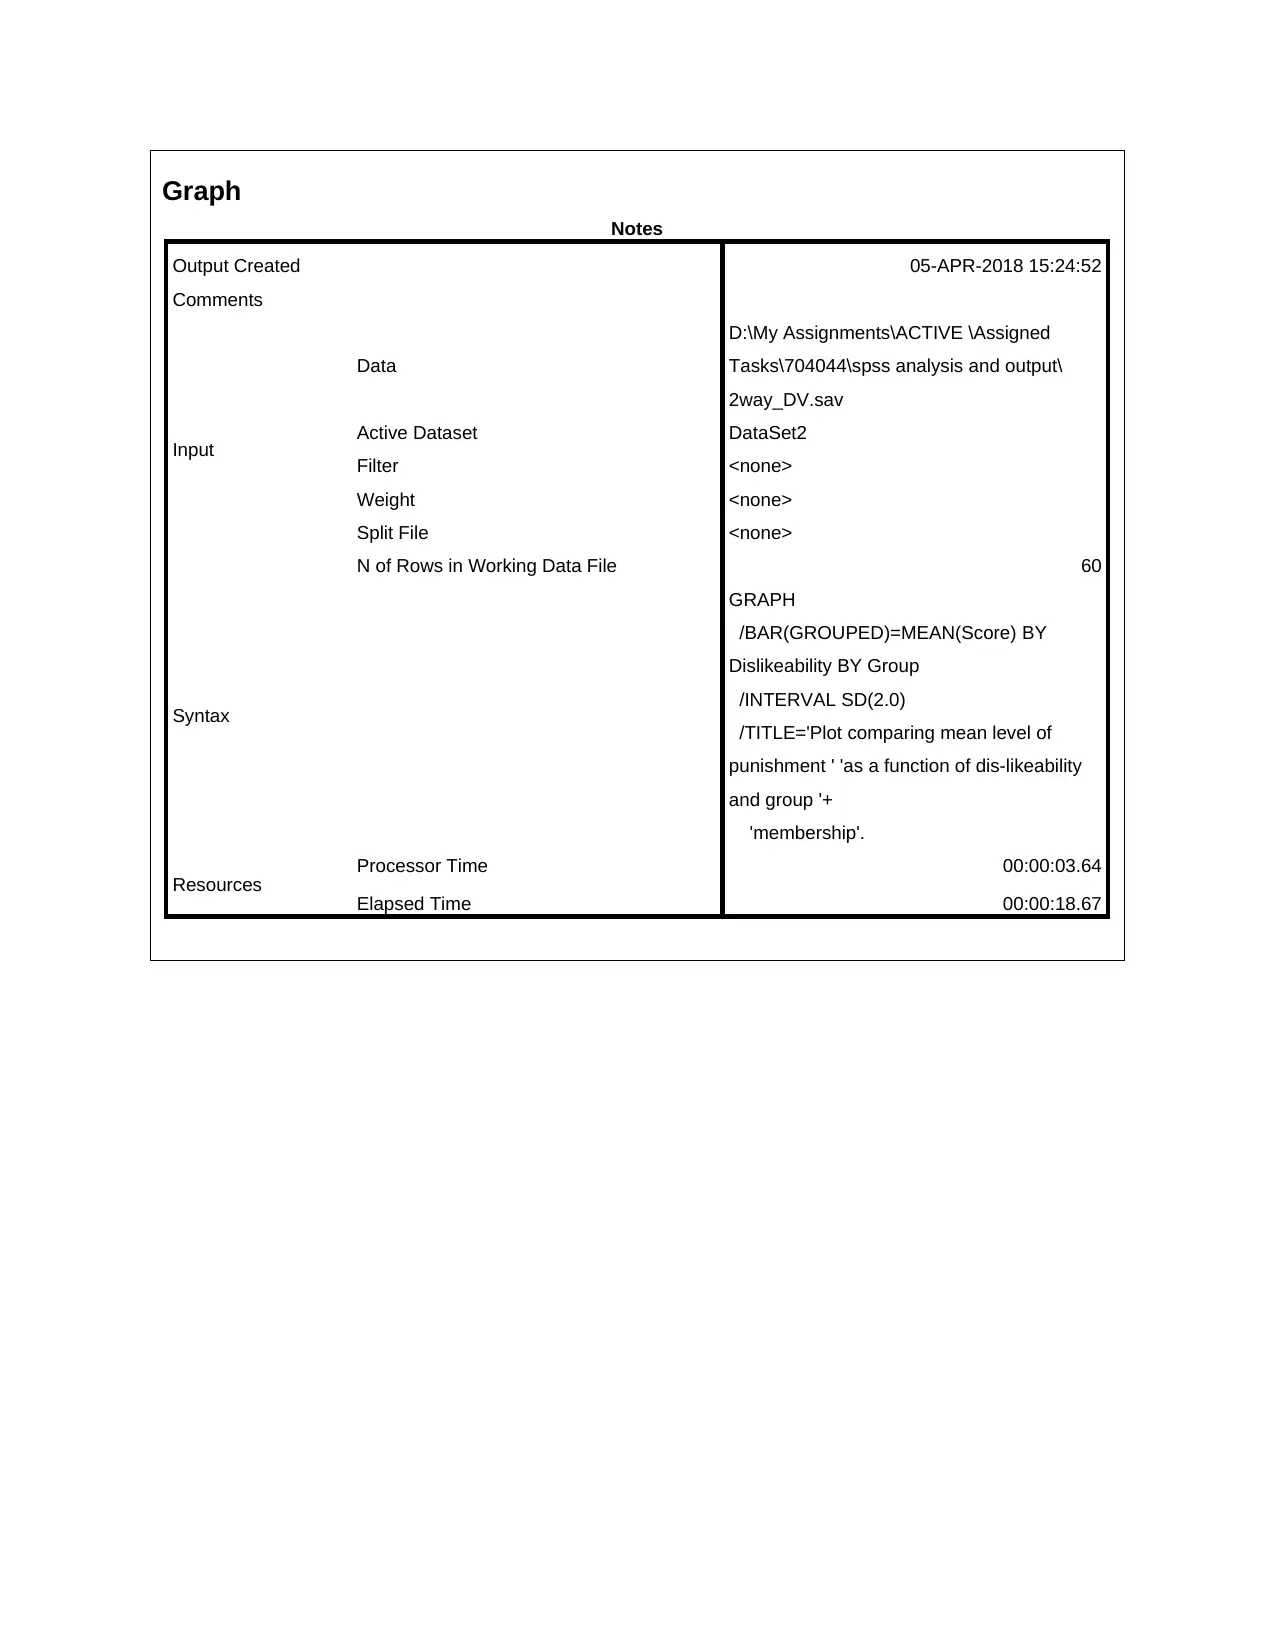
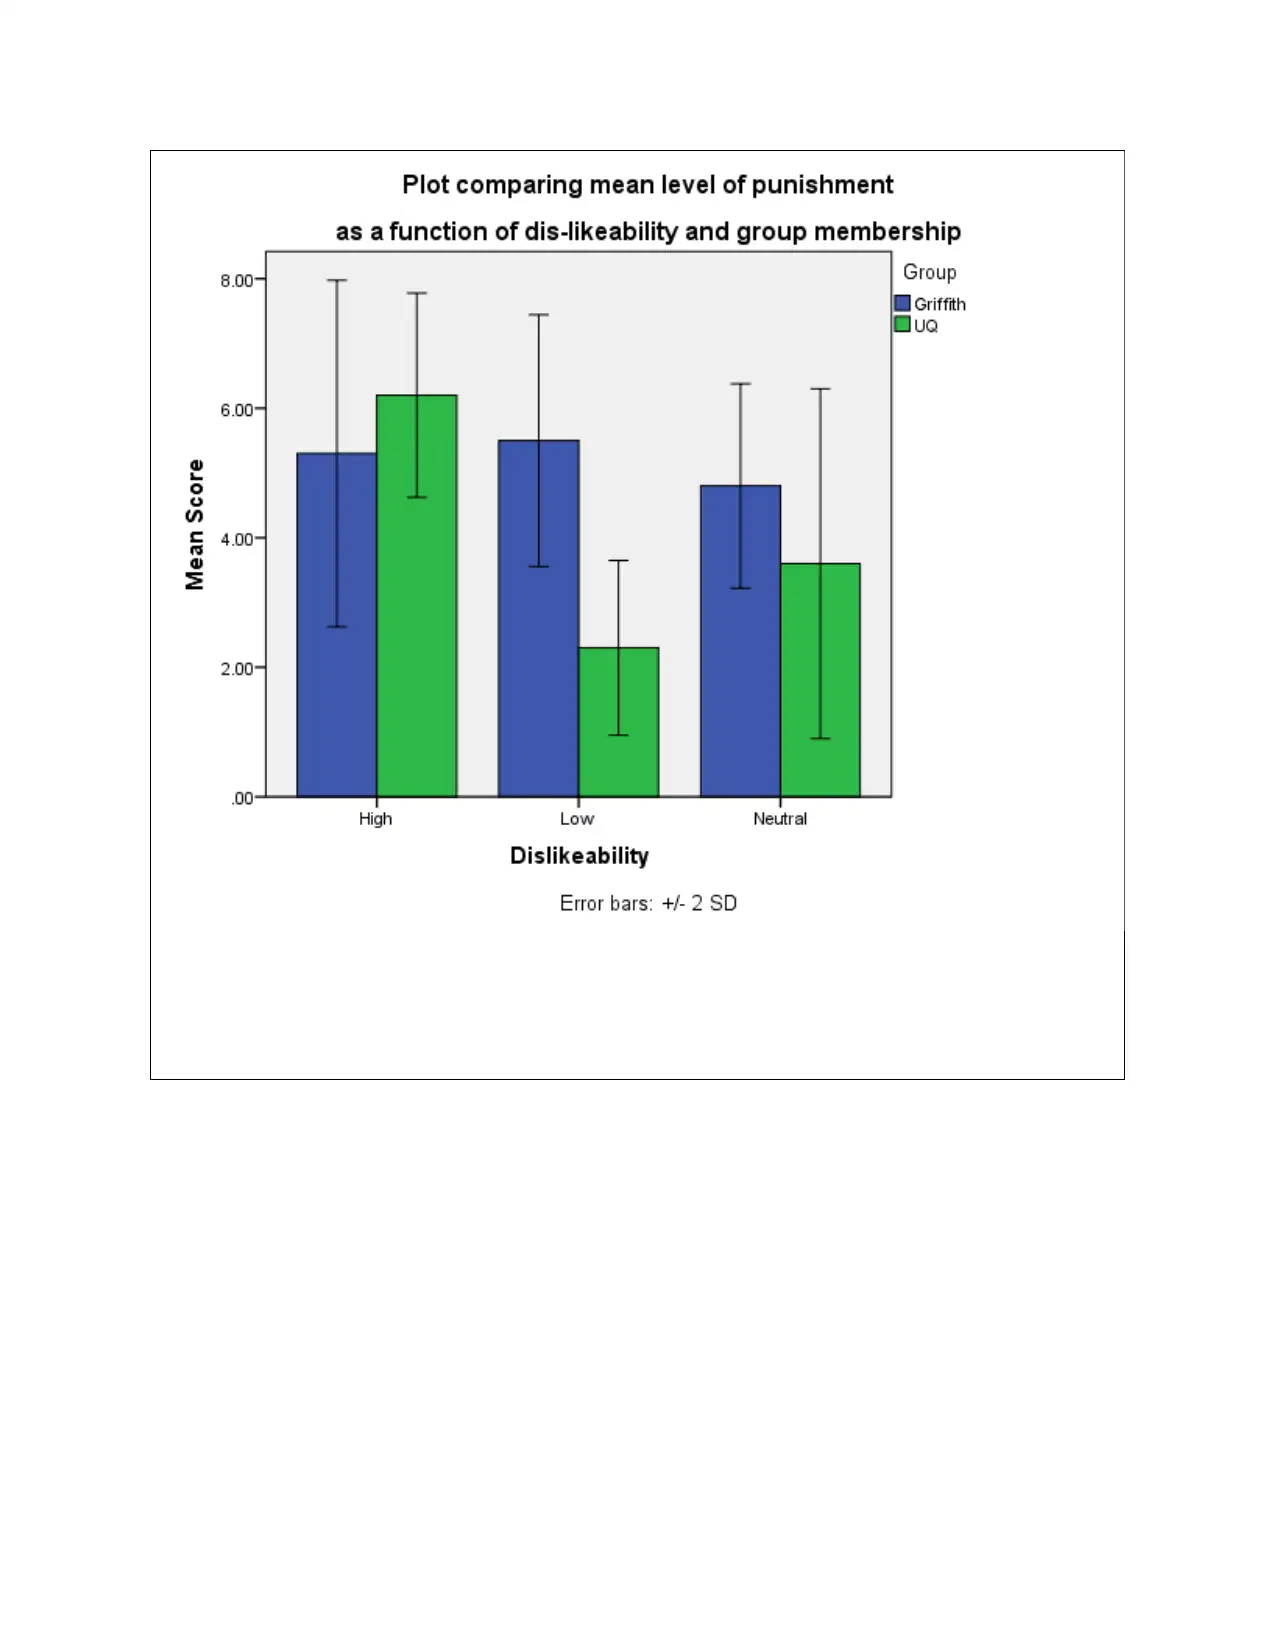
This document presents an SPSS UNIANOVA analysis examining the effects of dislikeability and group membership on perceived dislike and score. The analysis includes tests of between-subjects effects, post hoc tests (Bonferroni), descriptive statistics, Levene's test for equality of variances, and estimated marginal means. The perceived dislike was analyzed based on dislikeability and group, revealing significant effects of dislikeability. Further analysis explores the impact of dislikeability and group on a score variable, with significant interaction effects observed. Post-hoc tests and pairwise comparisons provide detailed insights into group differences across dislikeability levels. A bar graph visually represents the mean level of punishment as a function of dislikeability and group membership. This solved assignment is available on Desklib, where students can find a wealth of study resources including past papers and assignments.
Document Page
SPSS SYNTAX
UNIANOVA Percieved_dislike BY Dislikeability Group
/METHOD=SSTYPE(3)
/INTERCEPT=INCLUDE
/POSTHOC=Dislikeability(BONFERRONI)
/PRINT=ETASQ
/CRITERIA=ALPHA(.05)
/DESIGN=Dislikeability Group Dislikeability*Group.
DATASET ACTIVATE DataSet2.
UNIANOVA Score BY Dislikeability Group
/METHOD=SSTYPE(3)
/INTERCEPT=INCLUDE
/POSTHOC=Dislikeability Group(BONFERRONI)
/EMMEANS=TABLES(Dislikeability*Group) COMPARE(Group) ADJ(BONFERRONI)
/PRINT=ETASQ HOMOGENEITY DESCRIPTIVE
/CRITERIA=ALPHA(.05)
tabler-icon-diamond-filled.svg

Paraphrase This Document

Need a fresh take? Get an instant paraphrase of this document with our AI Paraphraser
Document Page
/DESIGN=Dislikeability Group Dislikeability*Group.
GRAPH
/BAR(GROUPED)=MEAN(Score) BY Dislikeability BY Group
/INTERVAL SD(2.0)
/TITLE='Plot comparing mean level of punishment ' 'as a function of dis-likeability and group '+
'membership'.
SPSS OUTPUT
UNIANOVA Percieved_dislike BY Dislikeability Group
/METHOD=SSTYPE(3)
/INTERCEPT=INCLUDE
/POSTHOC=Dislikeability(BONFERRONI)
/PRINT=ETASQ
/CRITERIA=ALPHA(.05)
/DESIGN=Dislikeability Group Dislikeability*Group.
Univariate Analysis of Variance
Notes
Output Created 05-APR-2018 15:18:12
Comments
Input
Data
D:\My Assignments\ACTIVE\Assigned
Tasks\704044\spss analysis and output\
manipulation_IV.sav
Active Dataset DataSet3
Filter <none>
Weight <none>
Split File <none>
N of Rows in Working Data
File 60
Missing Value Handling Definition of Missing User-defined missing values are treated
as missing.
Document Page
Cases Used Statistics are based on all cases with valid
data for all variables in the model.
Syntax
UNIANOVA Percieved_dislike BY
Dislikeability Group
/METHOD=SSTYPE(3)
/INTERCEPT=INCLUDE
/POSTHOC=Dislikeability(BONFERRONI)
/PRINT=ETASQ
/CRITERIA=ALPHA(.05)
/DESIGN=Dislikeability Group
Dislikeability*Group.
Resources Processor Time 00:00:00.03
Elapsed Time 00:00:00.97
Between-Subjects Factors
N
Dislikeability
High 20
Low 20
Neutral 20
Group Griffith 30
UQ 30
Tests of Between-Subjects Effects
Dependent Variable: Percieved_dislike
Source Type III Sum of
Squares
df Mean Square F Sig. Partial Eta
Squared
Corrected Model 150.400a 5 30.080 26.982 .000 .714
Intercept 821.400 1 821.400 736.804 .000 .932
Dislikeability 147.100 2 73.550 65.975 .000 .710
Group 1.667 1 1.667 1.495 .227 .027
Dislikeability * Group 1.633 2 .817 .733 .485 .026
Error 60.200 54 1.115
Total 1032.000 60
Corrected Total 210.600 59
a. R Squared = .714 (Adjusted R Squared = .688)
Document Page
Post Hoc Tests
Dislikeability
Multiple Comparisons
Dependent Variable: Percieved_dislike
Bonferroni
(I) Dislikeability (J) Dislikeability Mean
Difference (I-J)
Std. Error Sig. 95% Confidence Interval
Lower Bound Upper Bound
High Low -3.8000* .33389 .000 -4.6250 -2.9750
Neutral -1.4500* .33389 .000 -2.2750 -.6250
Low High 3.8000* .33389 .000 2.9750 4.6250
Neutral 2.3500* .33389 .000 1.5250 3.1750
Neutral High 1.4500* .33389 .000 .6250 2.2750
Low -2.3500* .33389 .000 -3.1750 -1.5250
Based on observed means.
The error term is Mean Square(Error) = 1.115.
*. The mean difference is significant at the .05 level.
DATASET ACTIVATE DataSet2.
UNIANOVA Score BY Dislikeability Group
/METHOD=SSTYPE(3)
/INTERCEPT=INCLUDE
/POSTHOC=Dislikeability Group(BONFERRONI)
/EMMEANS=TABLES(Dislikeability*Group) COMPARE(Group) ADJ(BONFERRONI)
/PRINT=ETASQ HOMOGENEITY DESCRIPTIVE
/CRITERIA=ALPHA(.05)
/DESIGN=Dislikeability Group Dislikeability*Group.
Univariate Analysis of Variance
Notes
Output Created 05-APR-2018 15:20:37
Comments
Input Data D:\My Assignments\ACTIVE \Assigned
Tasks\704044\spss analysis and output\
2way_DV.sav
tabler-icon-diamond-filled.svg

Paraphrase This Document

Need a fresh take? Get an instant paraphrase of this document with our AI Paraphraser
Document Page
Active Dataset DataSet2
Filter <none>
Weight <none>
Split File <none>
N of Rows in Working Data
File 60
Missing Value Handling
Definition of Missing User-defined missing values are treated as
missing.
Cases Used Statistics are based on all cases with valid
data for all variables in the model.
Syntax
UNIANOVA Score BY Dislikeability Group
/METHOD=SSTYPE(3)
/INTERCEPT=INCLUDE
/POSTHOC=Dislikeability
Group(BONFERRONI)
/EMMEANS=TABLES(Dislikeability*Group)
COMPARE(Group) ADJ(BONFERRONI)
/PRINT=ETASQ HOMOGENEITY
DESCRIPTIVE
/CRITERIA=ALPHA(.05)
/DESIGN=Dislikeability Group
Dislikeability*Group.
Resources Processor Time 00:00:00.11
Elapsed Time 00:00:00.37
Warnings
Post hoc tests are not performed for Group because there are fewer than
three groups.
Between-Subjects Factors
N
Dislikeability
High 20
Low 20
Neutral 20
Group Griffith 30
Document Page
UQ 30
Descriptive Statistics
Dependent Variable: Score
Dislikeability Group Mean Std. Deviation N
High
Griffith 5.3000 1.33749 10
UQ 6.2000 .78881 10
Total 5.7500 1.16416 20
Low
Griffith 5.5000 .97183 10
UQ 2.3000 .67495 10
Total 3.9000 1.83246 20
Neutral
Griffith 4.8000 .78881 10
UQ 3.6000 1.34990 10
Total 4.2000 1.23969 20
Total
Griffith 5.2000 1.06350 30
UQ 4.0333 1.90251 30
Total 4.6167 1.63740 60
Levene's Test of Equality of Error Variancesa
Dependent Variable: Score
F df1 df2 Sig.
2.021 5 54 .090
Tests the null hypothesis that the error variance of the
dependent variable is equal across groups.
a. Design: Intercept + Dislikeability + Group +
Dislikeability * Group
Tests of Between-Subjects Effects
Dependent Variable: Score
Source Type III Sum of
Squares
df Mean Square F Sig. Partial Eta
Squared
Corrected Model 101.883a 5 20.377 19.544 .000 .644
Intercept 1278.817 1 1278.817 1226.574 .000 .958
Dislikeability 39.433 2 19.717 18.911 .000 .412
Document Page
Group 20.417 1 20.417 19.583 .000 .266
Dislikeability * Group 42.033 2 21.017 20.158 .000 .427
Error 56.300 54 1.043
Total 1437.000 60
Corrected Total 158.183 59
a. R Squared = .644 (Adjusted R Squared = .611)
Estimated Marginal Means
Dislikeability * Group
Estimates
Dependent Variable: Score
Dislikeability Group Mean Std. Error 95% Confidence Interval
Lower Bound Upper Bound
High Griffith 5.300 .323 4.653 5.947
UQ 6.200 .323 5.553 6.847
Low Griffith 5.500 .323 4.853 6.147
UQ 2.300 .323 1.653 2.947
Neutral Griffith 4.800 .323 4.153 5.447
UQ 3.600 .323 2.953 4.247
Pairwise Comparisons
Dependent Variable: Score
Dislikeability (I) Group (J) Group Mean
Difference (I-J)
Std. Error Sig.b 95% Confidence Interval for
Differenceb
Lower Bound Upper Bound
High Griffith UQ -.900 .457 .054 -1.816 .016
UQ Griffith .900 .457 .054 -.016 1.816
Low Griffith UQ 3.200* .457 .000 2.284 4.116
UQ Griffith -3.200* .457 .000 -4.116 -2.284
Neutral Griffith UQ 1.200* .457 .011 .284 2.116
UQ Griffith -1.200* .457 .011 -2.116 -.284
Based on estimated marginal means
*. The mean difference is significant at the .05 level.
b. Adjustment for multiple comparisons: Bonferroni.
tabler-icon-diamond-filled.svg

Paraphrase This Document

Need a fresh take? Get an instant paraphrase of this document with our AI Paraphraser
Document Page
Univariate Tests
Dependent Variable: Score
Dislikeability Sum of Squares df Mean Square F Sig. Partial Eta
Squared
High Contrast 4.050 1 4.050 3.885 .054 .067
Error 56.300 54 1.043
Low Contrast 51.200 1 51.200 49.108 .000 .476
Error 56.300 54 1.043
Neutral Contrast 7.200 1 7.200 6.906 .011 .113
Error 56.300 54 1.043
Each F tests the simple effects of Group within each level combination of the other effects shown. These tests
are based on the linearly independent pairwise comparisons among the estimated marginal means.
Post Hoc Tests
Dislikeability
Multiple Comparisons
Dependent Variable: Score
Bonferroni
(I) Dislikeability (J) Dislikeability Mean
Difference (I-J)
Std. Error Sig. 95% Confidence Interval
Lower Bound Upper Bound
High Low 1.8500* .32289 .000 1.0522 2.6478
Neutral 1.5500* .32289 .000 .7522 2.3478
Low High -1.8500* .32289 .000 -2.6478 -1.0522
Neutral -.3000 .32289 1.000 -1.0978 .4978
Neutral High -1.5500* .32289 .000 -2.3478 -.7522
Low .3000 .32289 1.000 -.4978 1.0978
Based on observed means.
The error term is Mean Square(Error) = 1.043.
*. The mean difference is significant at the .05 level.
GRAPH
/BAR(GROUPED)=MEAN(Score) BY Dislikeability BY Group
/INTERVAL SD(2.0)
/TITLE='Plot comparing mean level of punishment ' 'as a function of dis-
likeability and group '+
'membership'.
Document Page
Graph
Notes
Output Created 05-APR-2018 15:24:52
Comments
Input
Data
D:\My Assignments\ACTIVE \Assigned
Tasks\704044\spss analysis and output\
2way_DV.sav
Active Dataset DataSet2
Filter <none>
Weight <none>
Split File <none>
N of Rows in Working Data File 60
Syntax
GRAPH
/BAR(GROUPED)=MEAN(Score) BY
Dislikeability BY Group
/INTERVAL SD(2.0)
/TITLE='Plot comparing mean level of
punishment ' 'as a function of dis-likeability
and group '+
'membership'.
Resources Processor Time 00:00:03.64
Elapsed Time 00:00:18.67
Document Page
chevron_up_icon
1 out of 10
circle_padding
hide_on_mobile
zoom_out_icon
[object Object]