SPSS Analysis of Survey Data on Workplace Diversity and Inclusion

Verified

Added on  2022/08/12

|6
|1153
|25
Project
AI Summary
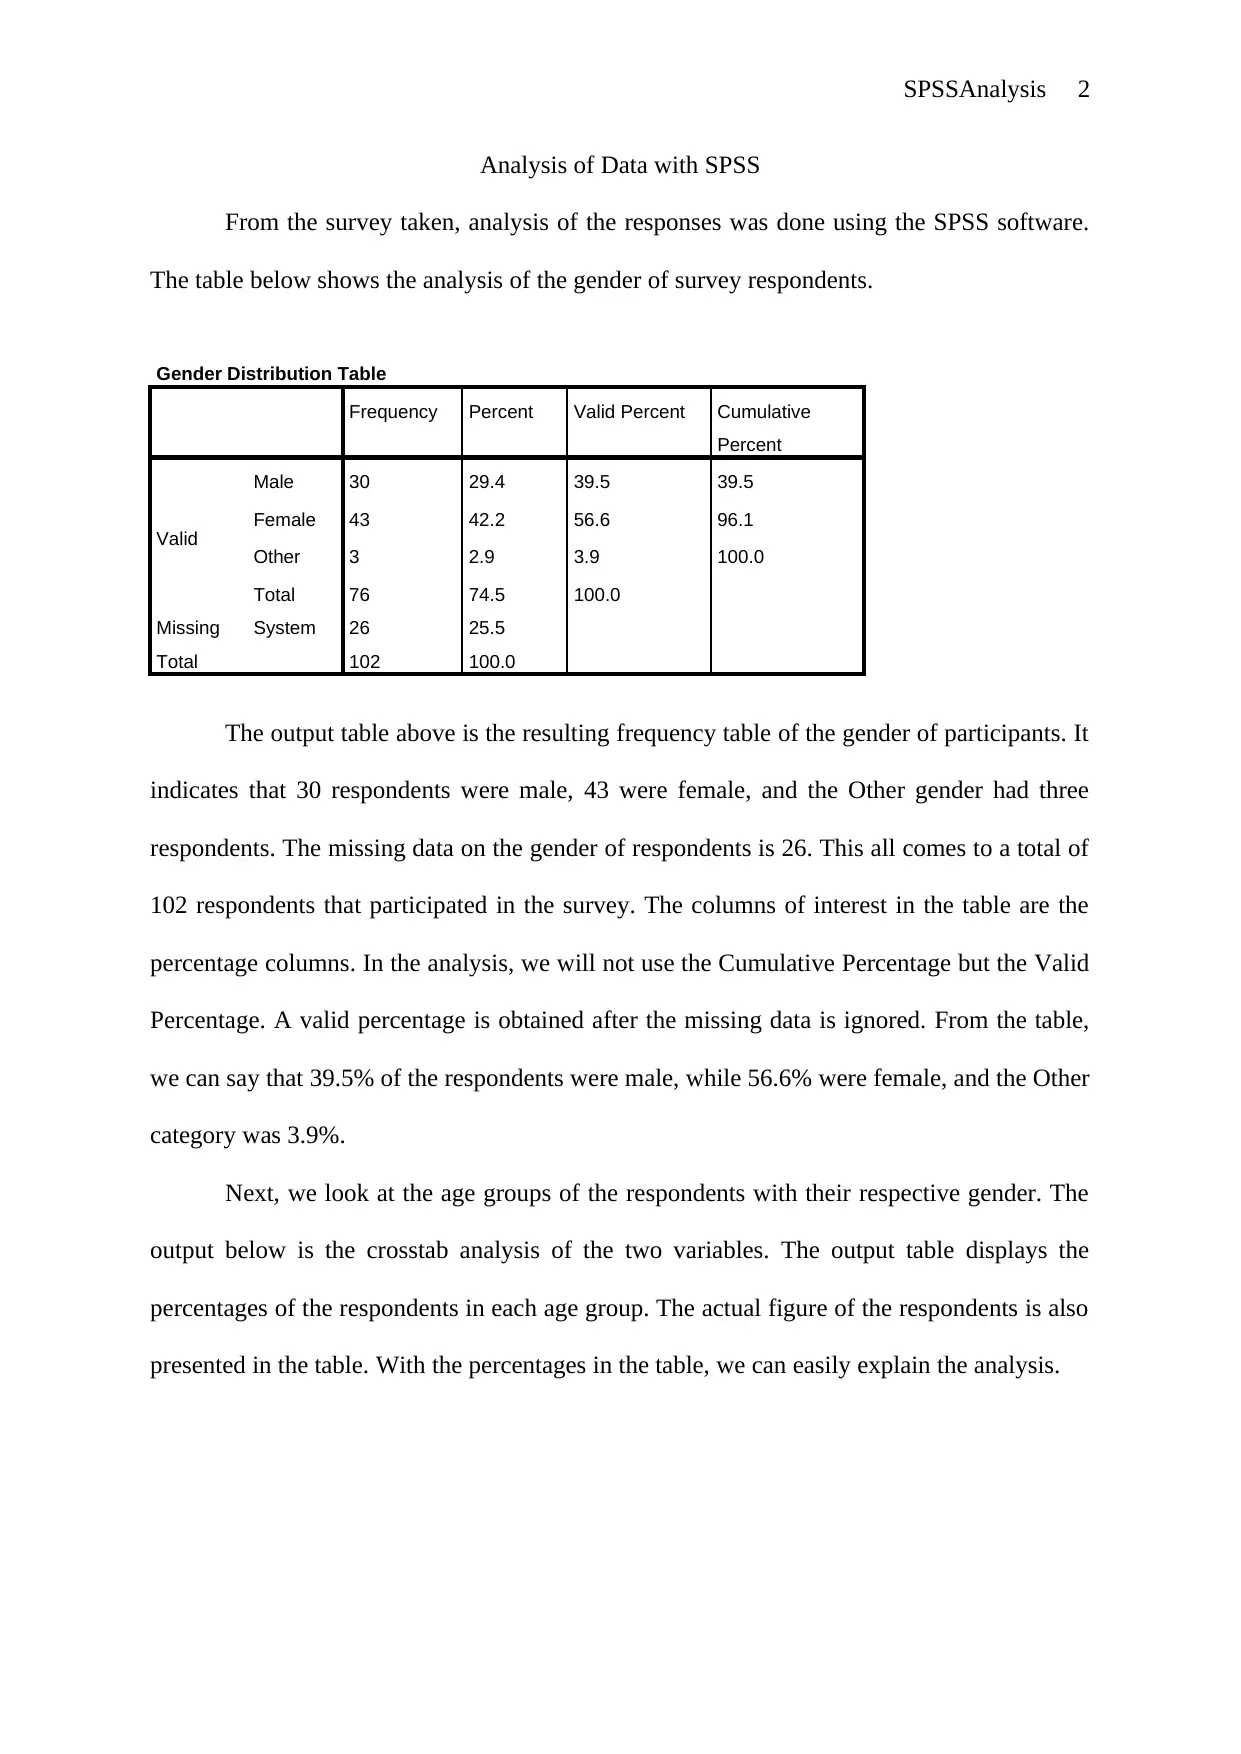
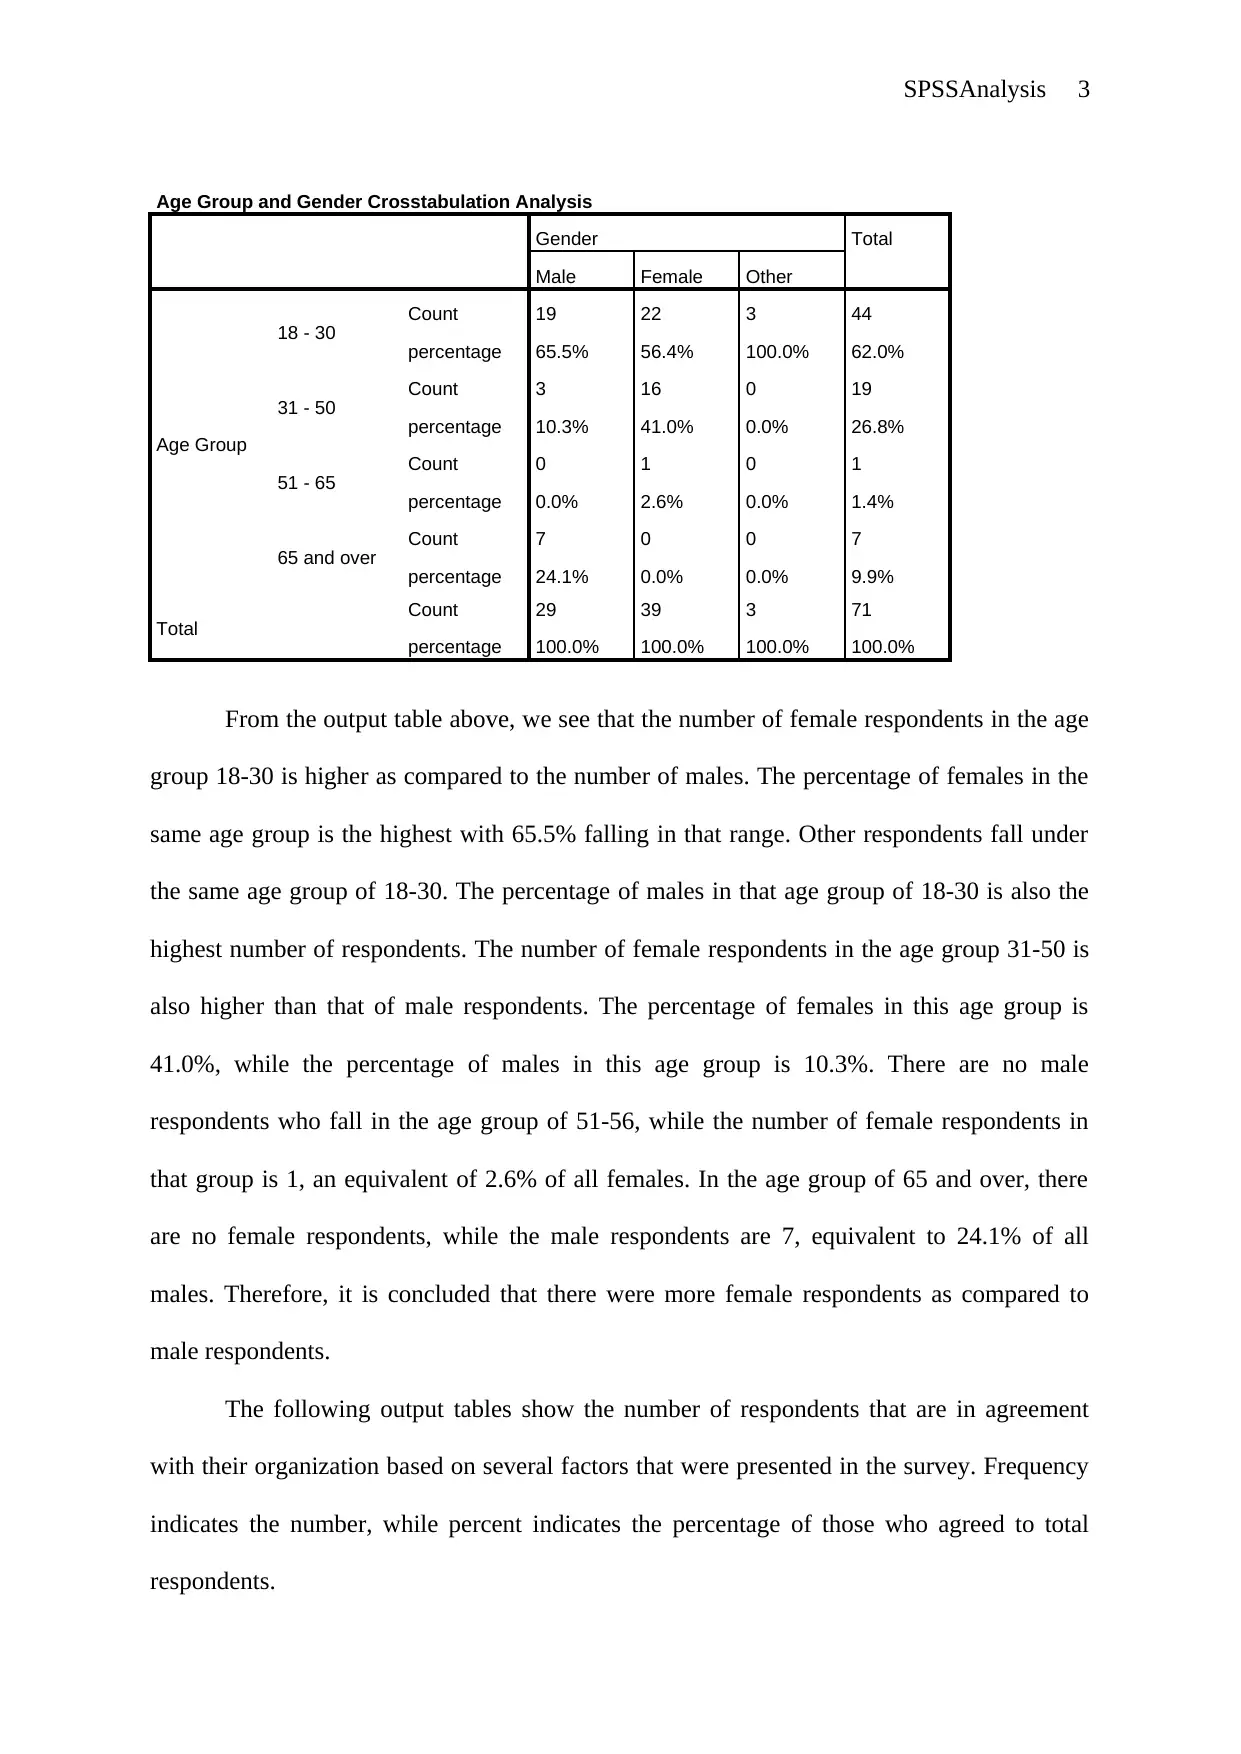
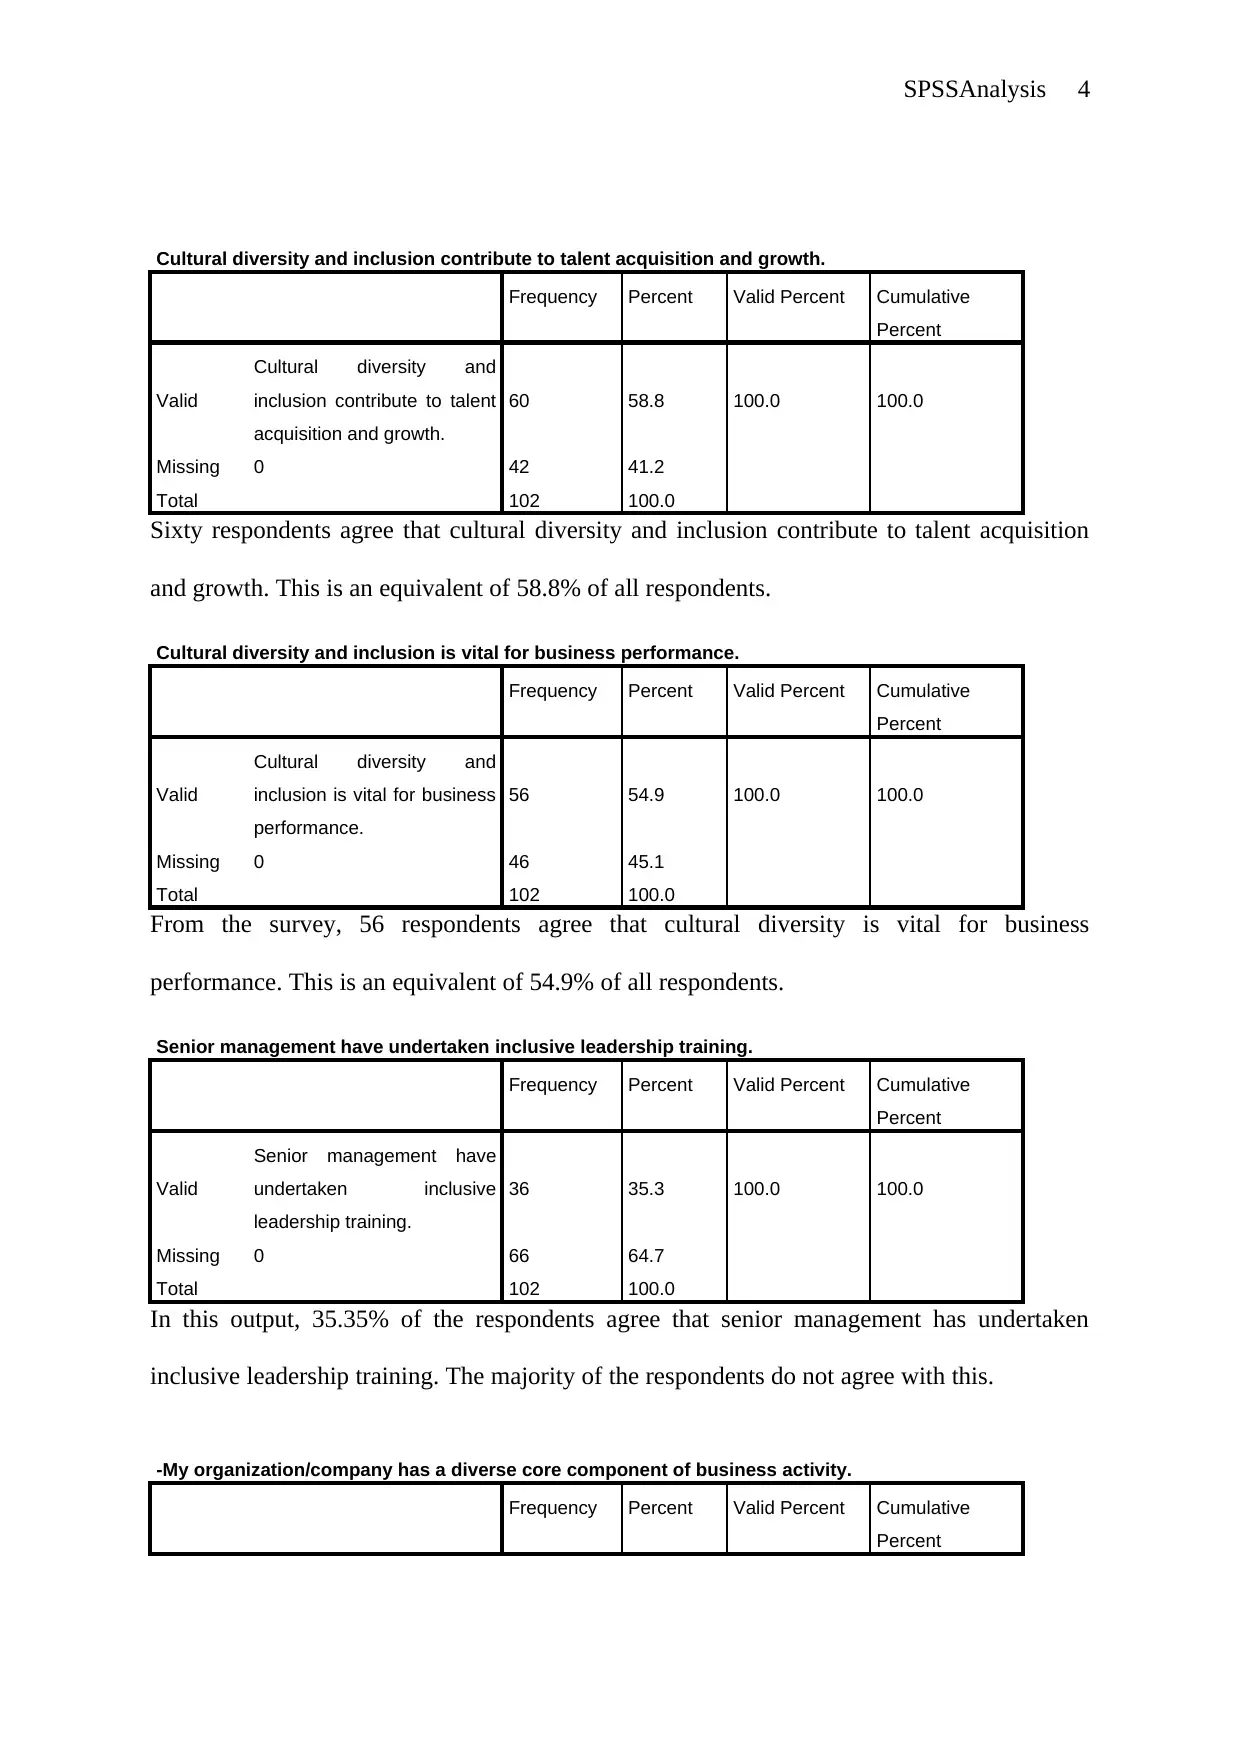
This project presents an analysis of survey data using SPSS software. The analysis focuses on the demographics of the respondents, including gender and age groups, and their views on cultural diversity and inclusion in the workplace. The study examines the distribution of gender among respondents, revealing the proportions of male, female, and other genders. Crosstab analysis is used to explore the relationship between age groups and gender, highlighting the distribution of respondents across different age categories. Furthermore, the project investigates the respondents' agreement with statements regarding cultural diversity's contribution to talent acquisition and business performance, leadership training, and organizational diversity. The analysis also explores the importance of cultural diversity in the workplace, revealing the varying perspectives of respondents. The findings indicate that a significant portion of respondents consider cultural diversity important for organizational development, underscoring its significance in the workplace.
Document Page
SPSSAnalysis 1
ANALYSIS OF THE DATA IN SPSS
by Student’s Name
Course
Professor
Institution
Date
tabler-icon-diamond-filled.svg

Paraphrase This Document

Need a fresh take? Get an instant paraphrase of this document with our AI Paraphraser
Document Page
SPSSAnalysis 2
Analysis of Data with SPSS
From the survey taken, analysis of the responses was done using the SPSS software.
The table below shows the analysis of the gender of survey respondents.
Gender Distribution Table
Frequency Percent Valid Percent Cumulative
Percent
Valid
Male 30 29.4 39.5 39.5
Female 43 42.2 56.6 96.1
Other 3 2.9 3.9 100.0
Total 76 74.5 100.0
Missing System 26 25.5
Total 102 100.0
The output table above is the resulting frequency table of the gender of participants. It
indicates that 30 respondents were male, 43 were female, and the Other gender had three
respondents. The missing data on the gender of respondents is 26. This all comes to a total of
102 respondents that participated in the survey. The columns of interest in the table are the
percentage columns. In the analysis, we will not use the Cumulative Percentage but the Valid
Percentage. A valid percentage is obtained after the missing data is ignored. From the table,
we can say that 39.5% of the respondents were male, while 56.6% were female, and the Other
category was 3.9%.
Next, we look at the age groups of the respondents with their respective gender. The
output below is the crosstab analysis of the two variables. The output table displays the
percentages of the respondents in each age group. The actual figure of the respondents is also
presented in the table. With the percentages in the table, we can easily explain the analysis.
Document Page
SPSSAnalysis 3
Age Group and Gender Crosstabulation Analysis
Gender Total
Male Female Other
Age Group
18 - 30 Count 19 22 3 44
percentage 65.5% 56.4% 100.0% 62.0%
31 - 50 Count 3 16 0 19
percentage 10.3% 41.0% 0.0% 26.8%
51 - 65 Count 0 1 0 1
percentage 0.0% 2.6% 0.0% 1.4%
65 and over Count 7 0 0 7
percentage 24.1% 0.0% 0.0% 9.9%
Total Count 29 39 3 71
percentage 100.0% 100.0% 100.0% 100.0%
From the output table above, we see that the number of female respondents in the age
group 18-30 is higher as compared to the number of males. The percentage of females in the
same age group is the highest with 65.5% falling in that range. Other respondents fall under
the same age group of 18-30. The percentage of males in that age group of 18-30 is also the
highest number of respondents. The number of female respondents in the age group 31-50 is
also higher than that of male respondents. The percentage of females in this age group is
41.0%, while the percentage of males in this age group is 10.3%. There are no male
respondents who fall in the age group of 51-56, while the number of female respondents in
that group is 1, an equivalent of 2.6% of all females. In the age group of 65 and over, there
are no female respondents, while the male respondents are 7, equivalent to 24.1% of all
males. Therefore, it is concluded that there were more female respondents as compared to
male respondents.
The following output tables show the number of respondents that are in agreement
with their organization based on several factors that were presented in the survey. Frequency
indicates the number, while percent indicates the percentage of those who agreed to total
respondents.
Document Page
SPSSAnalysis 4
Cultural diversity and inclusion contribute to talent acquisition and growth.
Frequency Percent Valid Percent Cumulative
Percent
Valid
Cultural diversity and
inclusion contribute to talent
acquisition and growth.
60 58.8 100.0 100.0
Missing 0 42 41.2
Total 102 100.0
Sixty respondents agree that cultural diversity and inclusion contribute to talent acquisition
and growth. This is an equivalent of 58.8% of all respondents.
Cultural diversity and inclusion is vital for business performance.
Frequency Percent Valid Percent Cumulative
Percent
Valid
Cultural diversity and
inclusion is vital for business
performance.
56 54.9 100.0 100.0
Missing 0 46 45.1
Total 102 100.0
From the survey, 56 respondents agree that cultural diversity is vital for business
performance. This is an equivalent of 54.9% of all respondents.
Senior management have undertaken inclusive leadership training.
Frequency Percent Valid Percent Cumulative
Percent
Valid
Senior management have
undertaken inclusive
leadership training.
36 35.3 100.0 100.0
Missing 0 66 64.7
Total 102 100.0
In this output, 35.35% of the respondents agree that senior management has undertaken
inclusive leadership training. The majority of the respondents do not agree with this.
-My organization/company has a diverse core component of business activity.
Frequency Percent Valid Percent Cumulative
Percent
tabler-icon-diamond-filled.svg

Paraphrase This Document

Need a fresh take? Get an instant paraphrase of this document with our AI Paraphraser
Document Page
SPSSAnalysis 5
Valid
My organization/company
has a diverse core
component of business
activity.
45 44.1 100.0 100.0
Missing 0 57 55.9
Total 102 100.0
In this analysis, it is seen that 44.1% of the respondents agree that their organization has a
diverse core component of the business.
Employers have undertaken unconscious bias training.
Frequency Percent Valid Percent Cumulative
Percent
Valid Employers have undertaken
unconscious bias training. 32 31.4 100.0 100.0
Missing 0 70 68.6
Total 102 100.0
In this analysis result, 32 respondents, that is, 31.4%, agree that their employers have
undertaken an unconscious bias training. This makes the majority disagree on the subject
matter.
Now we look at how important cultural diversity is to the respondents.
How important is cultural diversity in the workplace for you?
Frequency Percent Valid Percent Cumulative
Percent
Valid
Very Important 20 19.6 19.6 19.6
Important 38 37.3 37.3 56.9
Neurtal/Do Not Know 22 21.6 21.6 78.4
Less Important 15 14.7 14.7 93.1
Not Important At All 7 6.9 6.9 100.0
Total 102 100.0 100.0
From the output above, 20 respondents felt that cultural diversity was very important
in their workplace; this is an equivalent of 19.6%. Thirty-eight respondents felt that diversity
in the workplace was important; this is an equivalent of 37.6%. The two categories of
important and very important, make up to 56.9% of all respondents. The other respondents
who were on neutral, less important, and not important at all were 44, an equivalent of
Document Page
SPSSAnalysis 6
43.1%. Therefore, the number of respondents who said that cultural diversity at work was
important were the majority. Therefore, we can conclude that the need for cultural diversity
in organizations is critical for their development.
chevron_up_icon
1 out of 6
circle_padding
hide_on_mobile
zoom_out_icon
[object Object]