SPSS Part 3: Correlation Analysis of Balance, Drinks, and Years

Verified

Added on  2020/06/05

|13
|686
|120
Homework Assignment
AI Summary
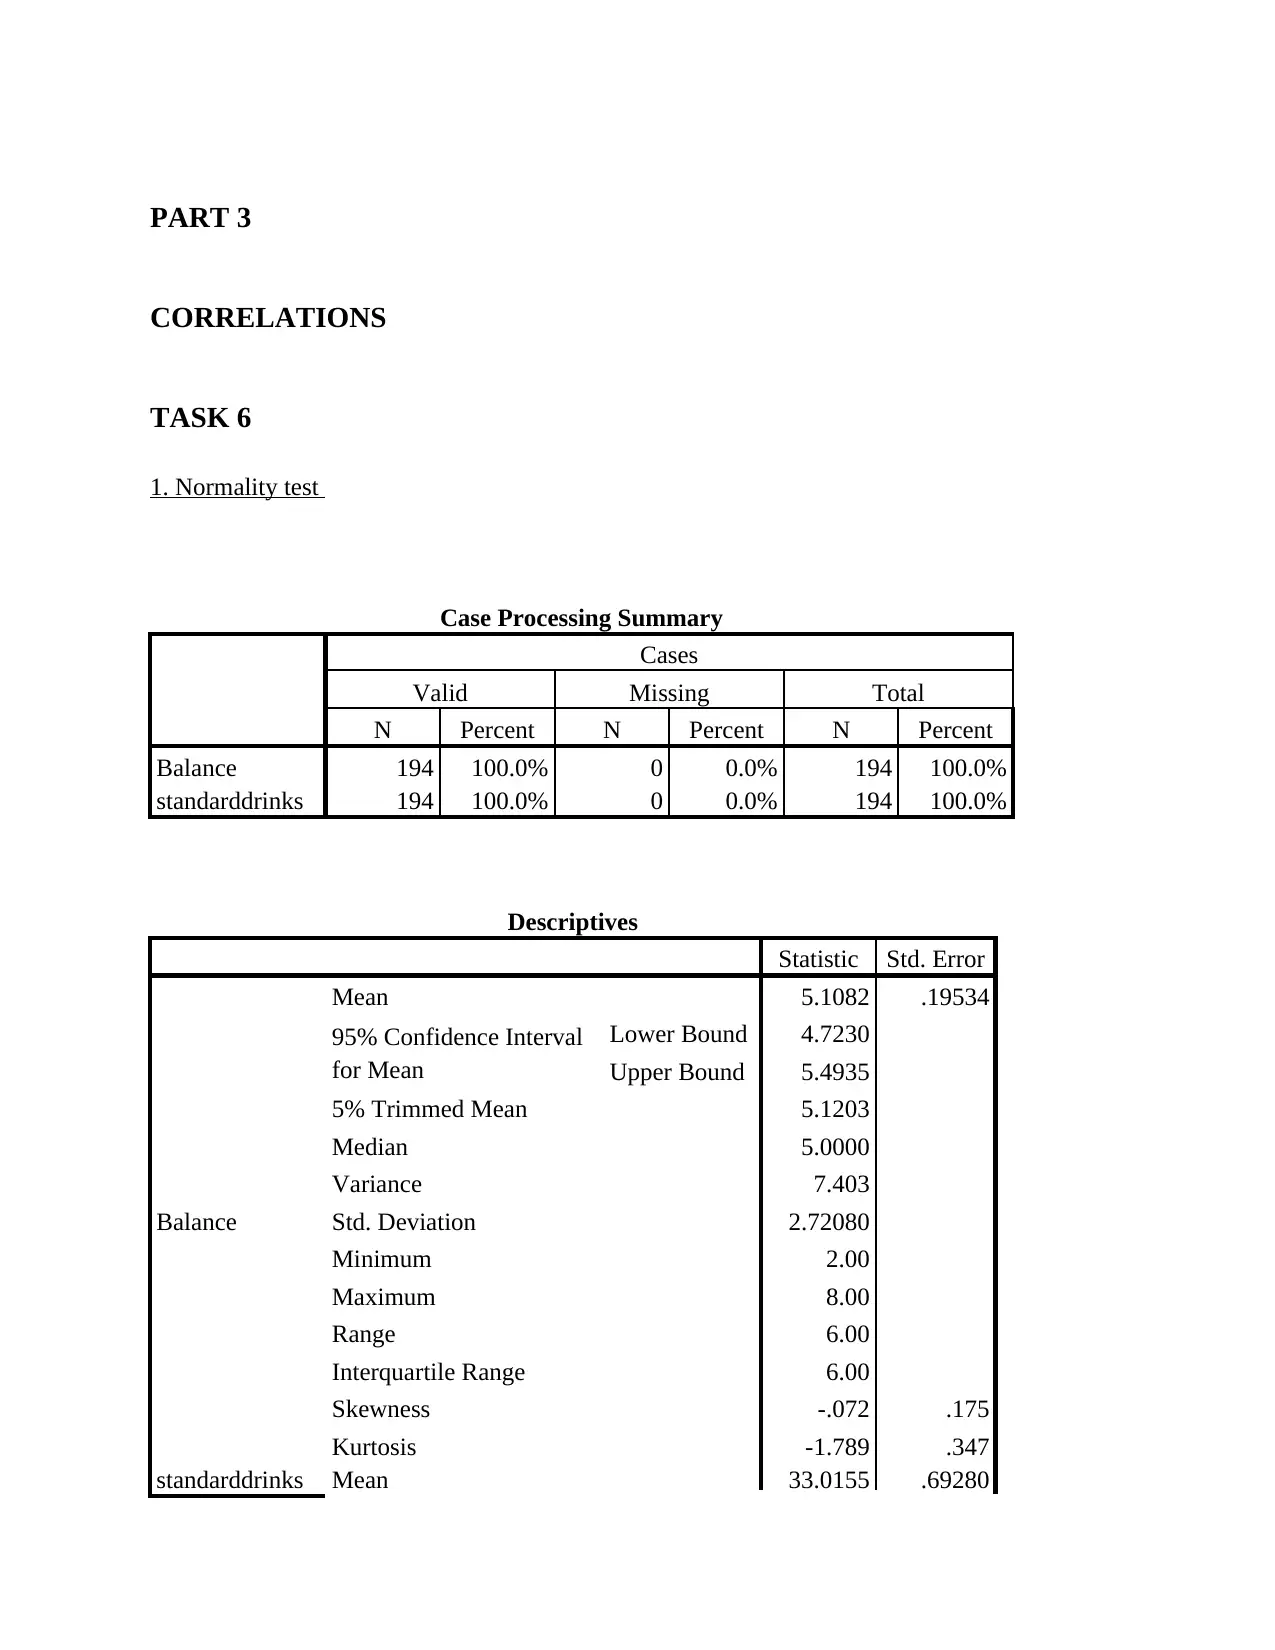
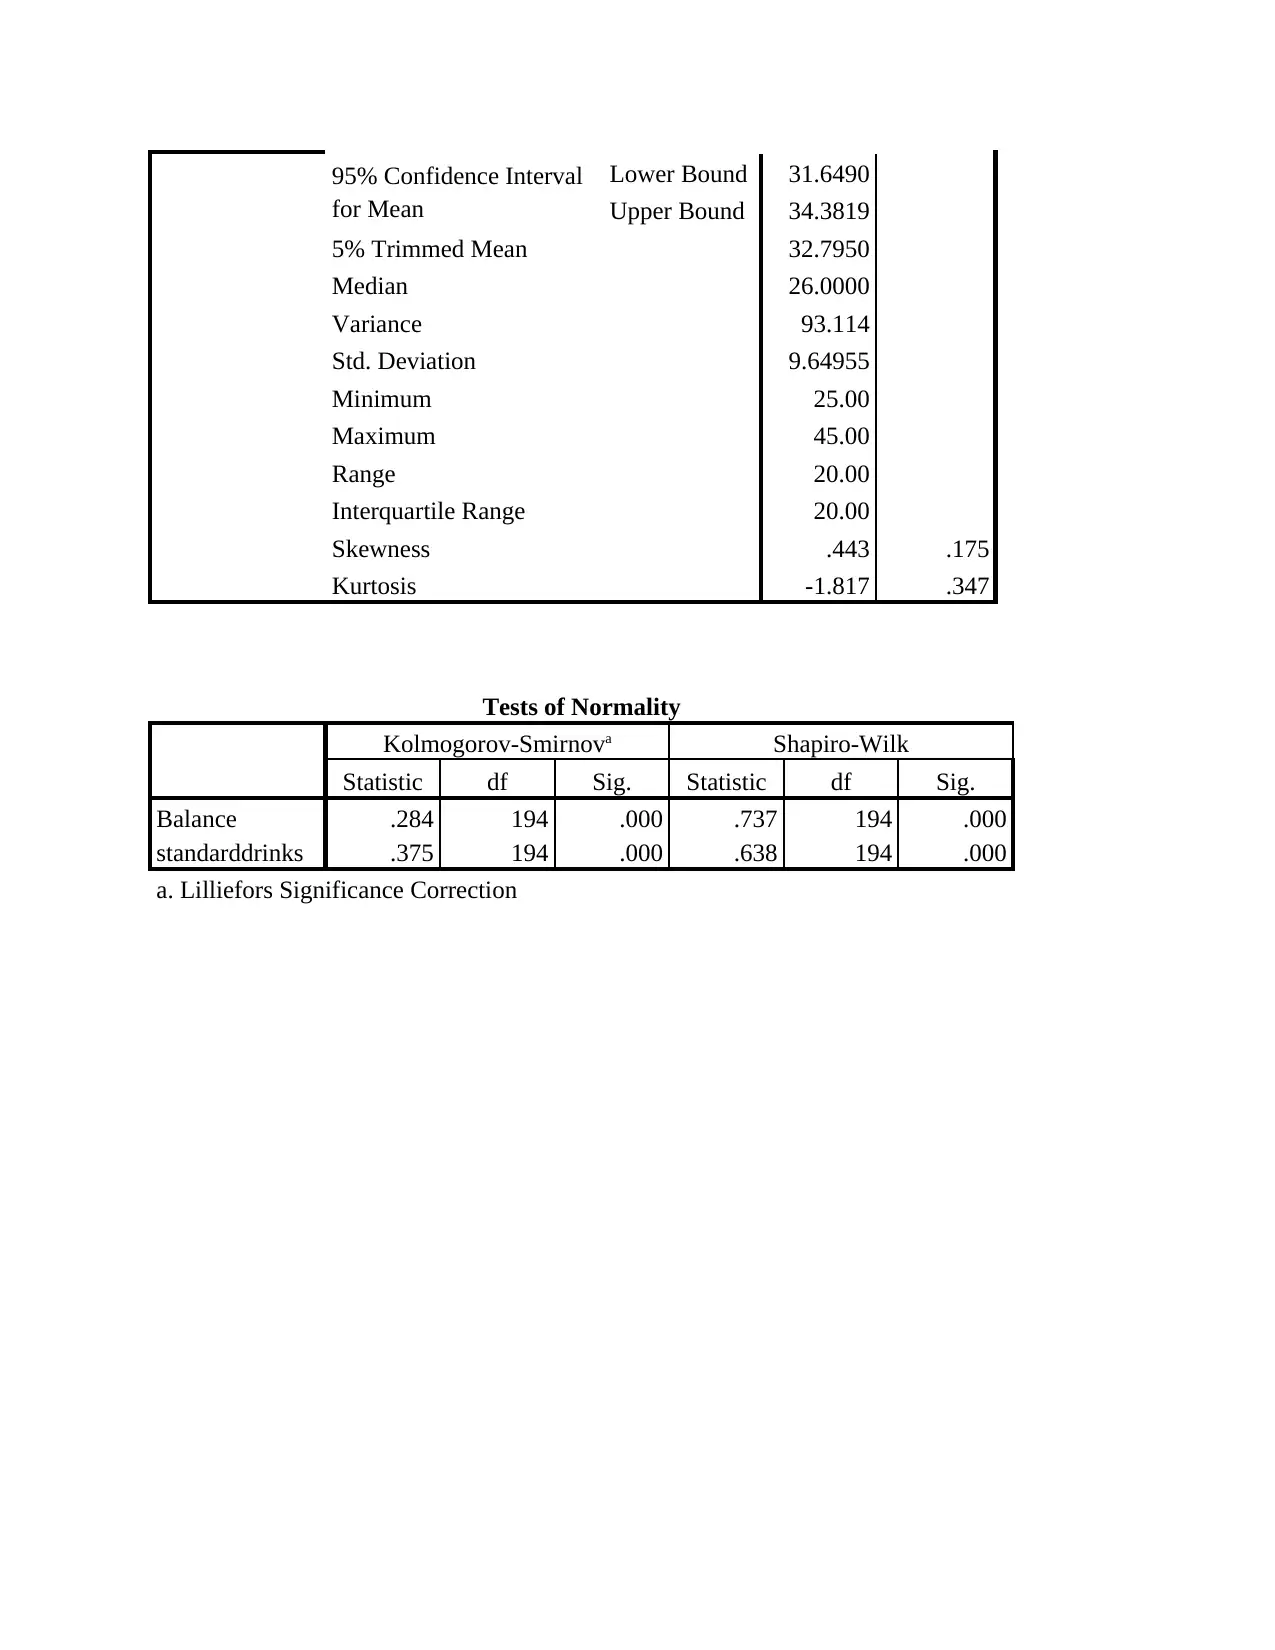
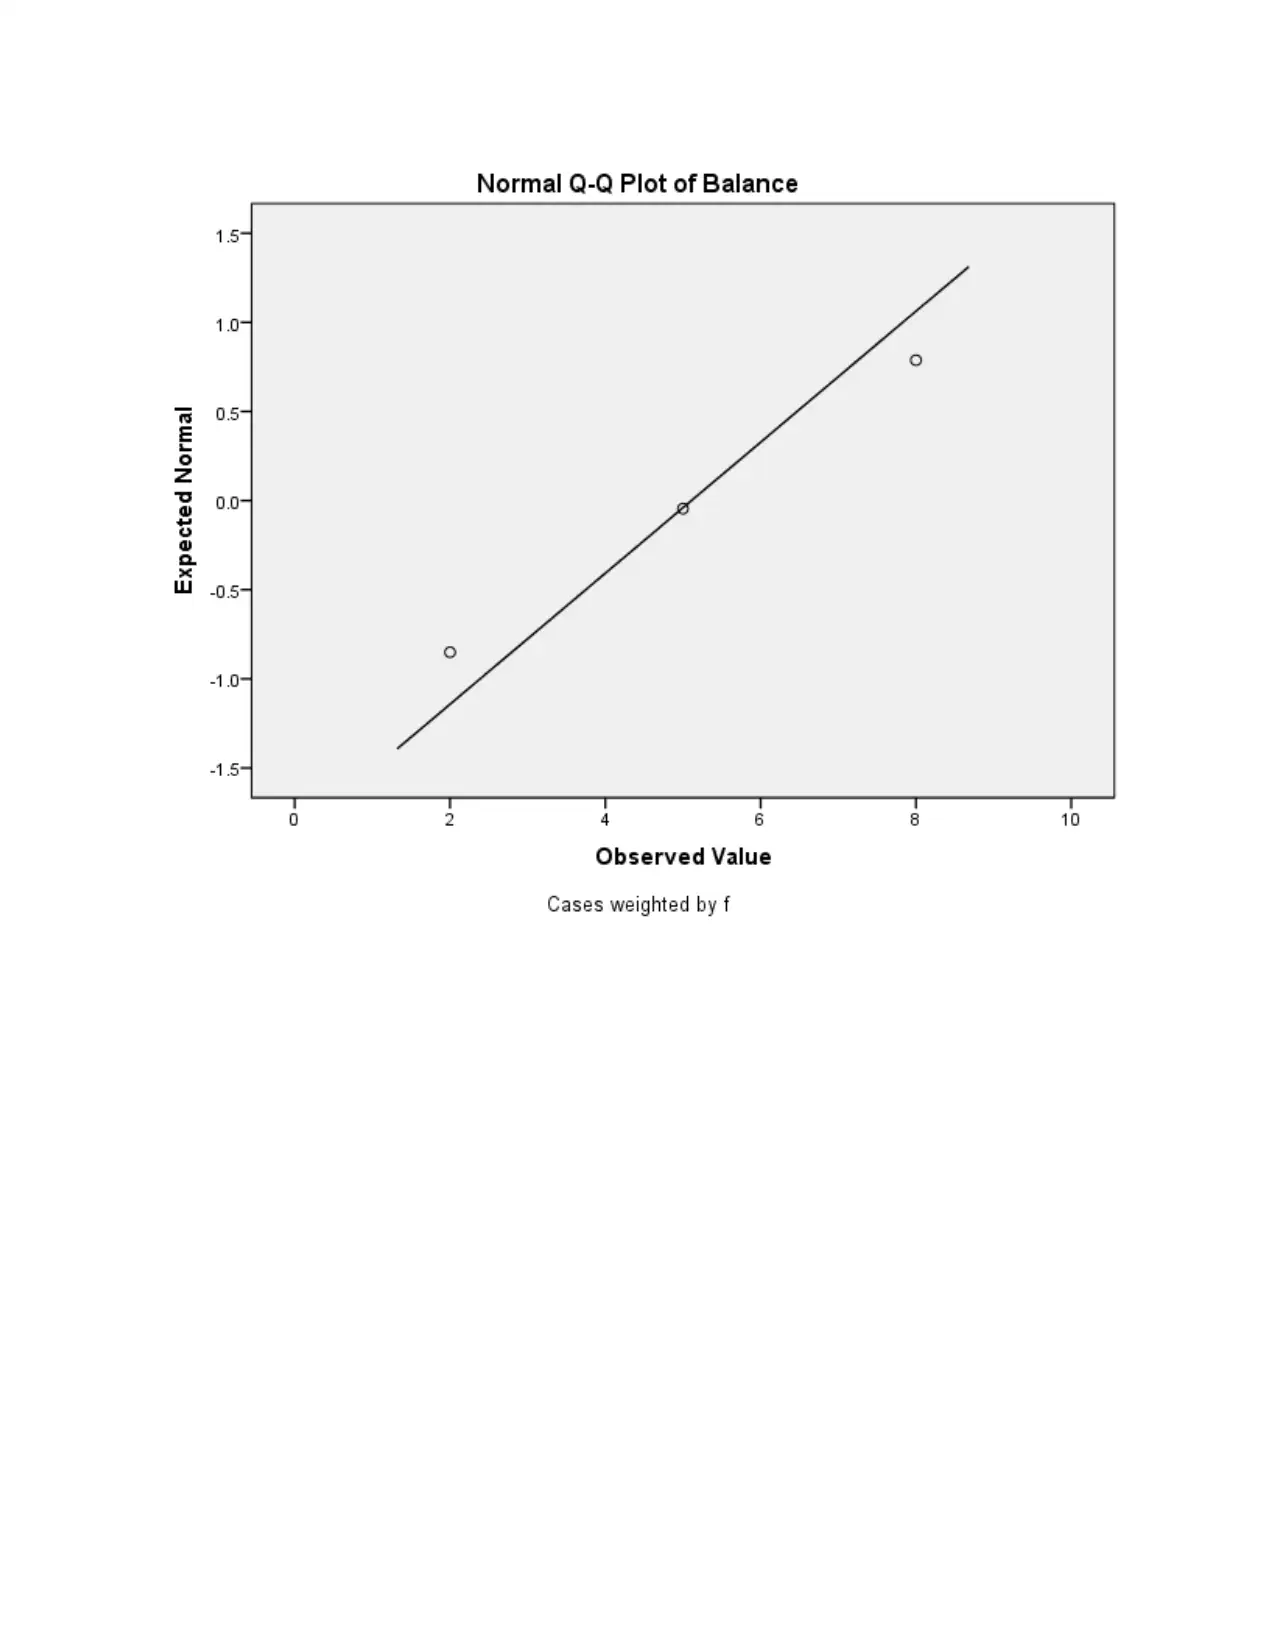
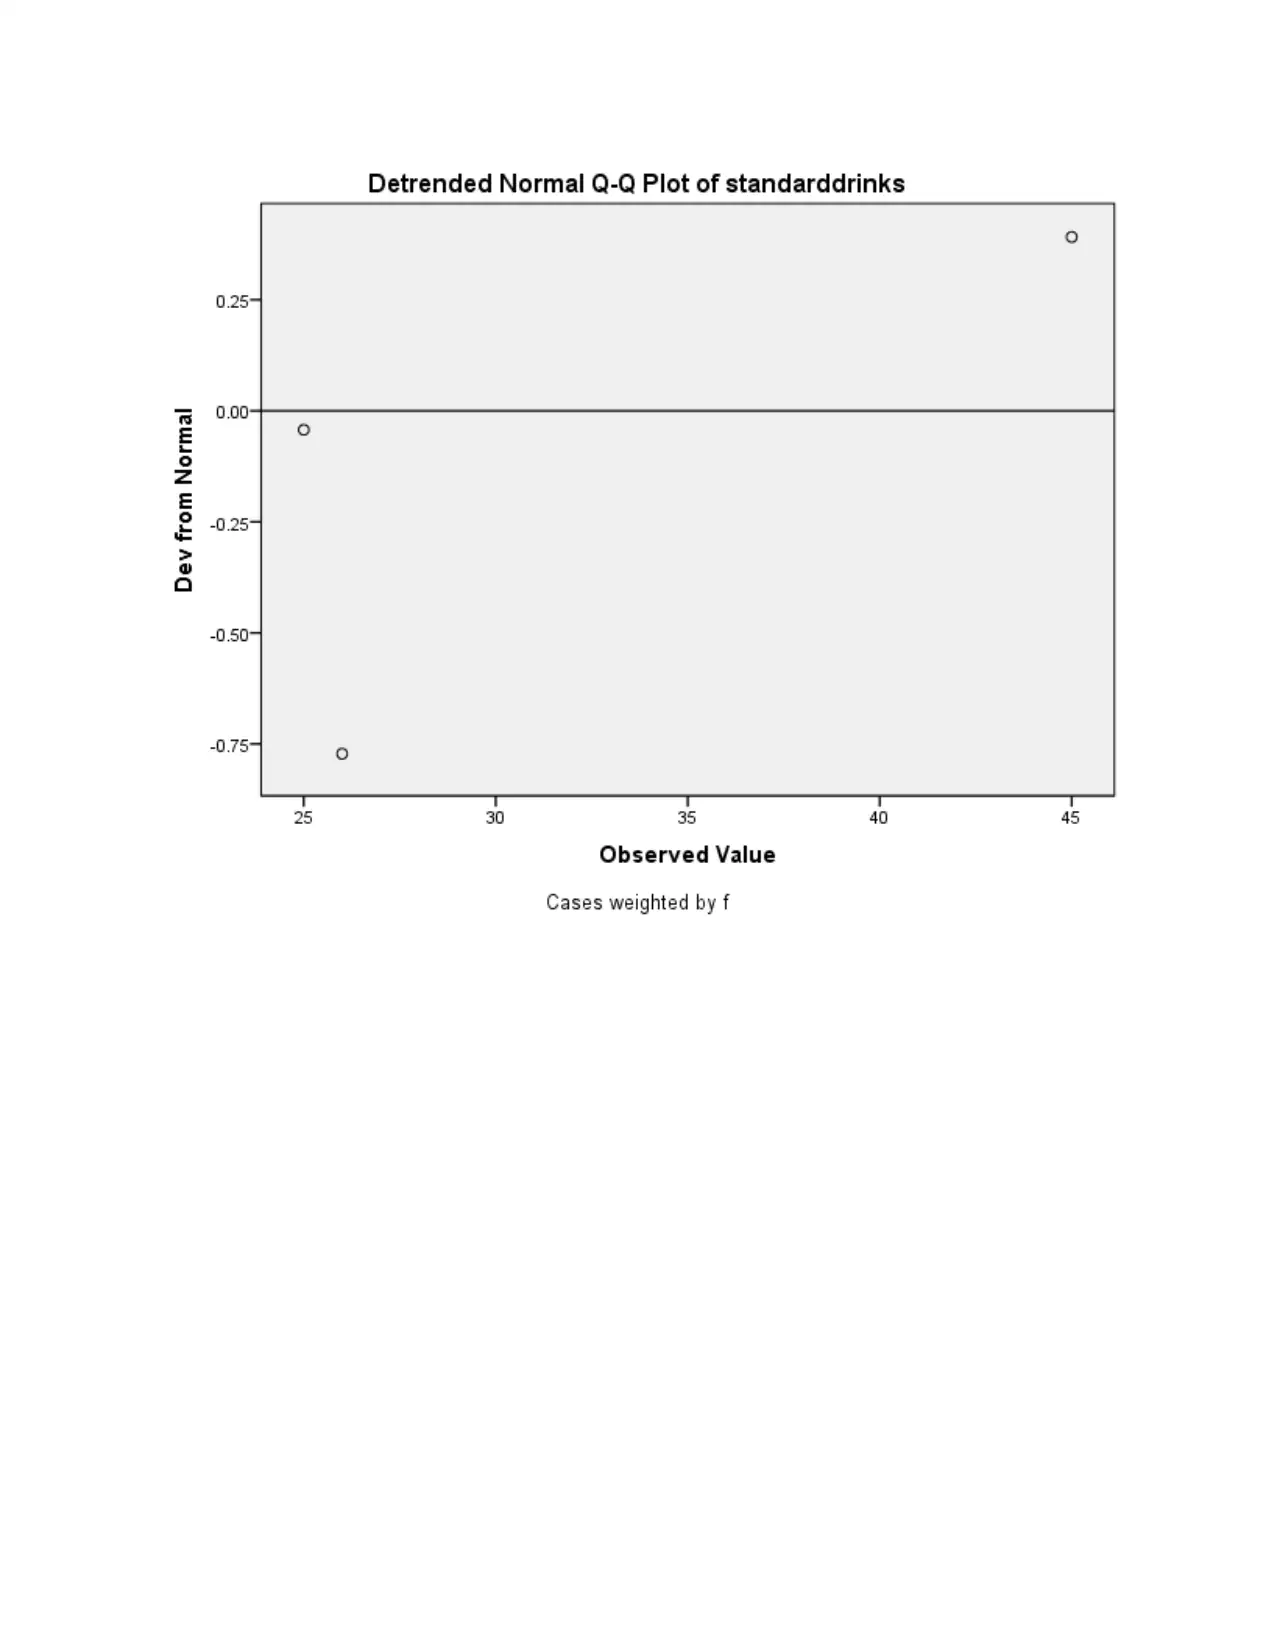
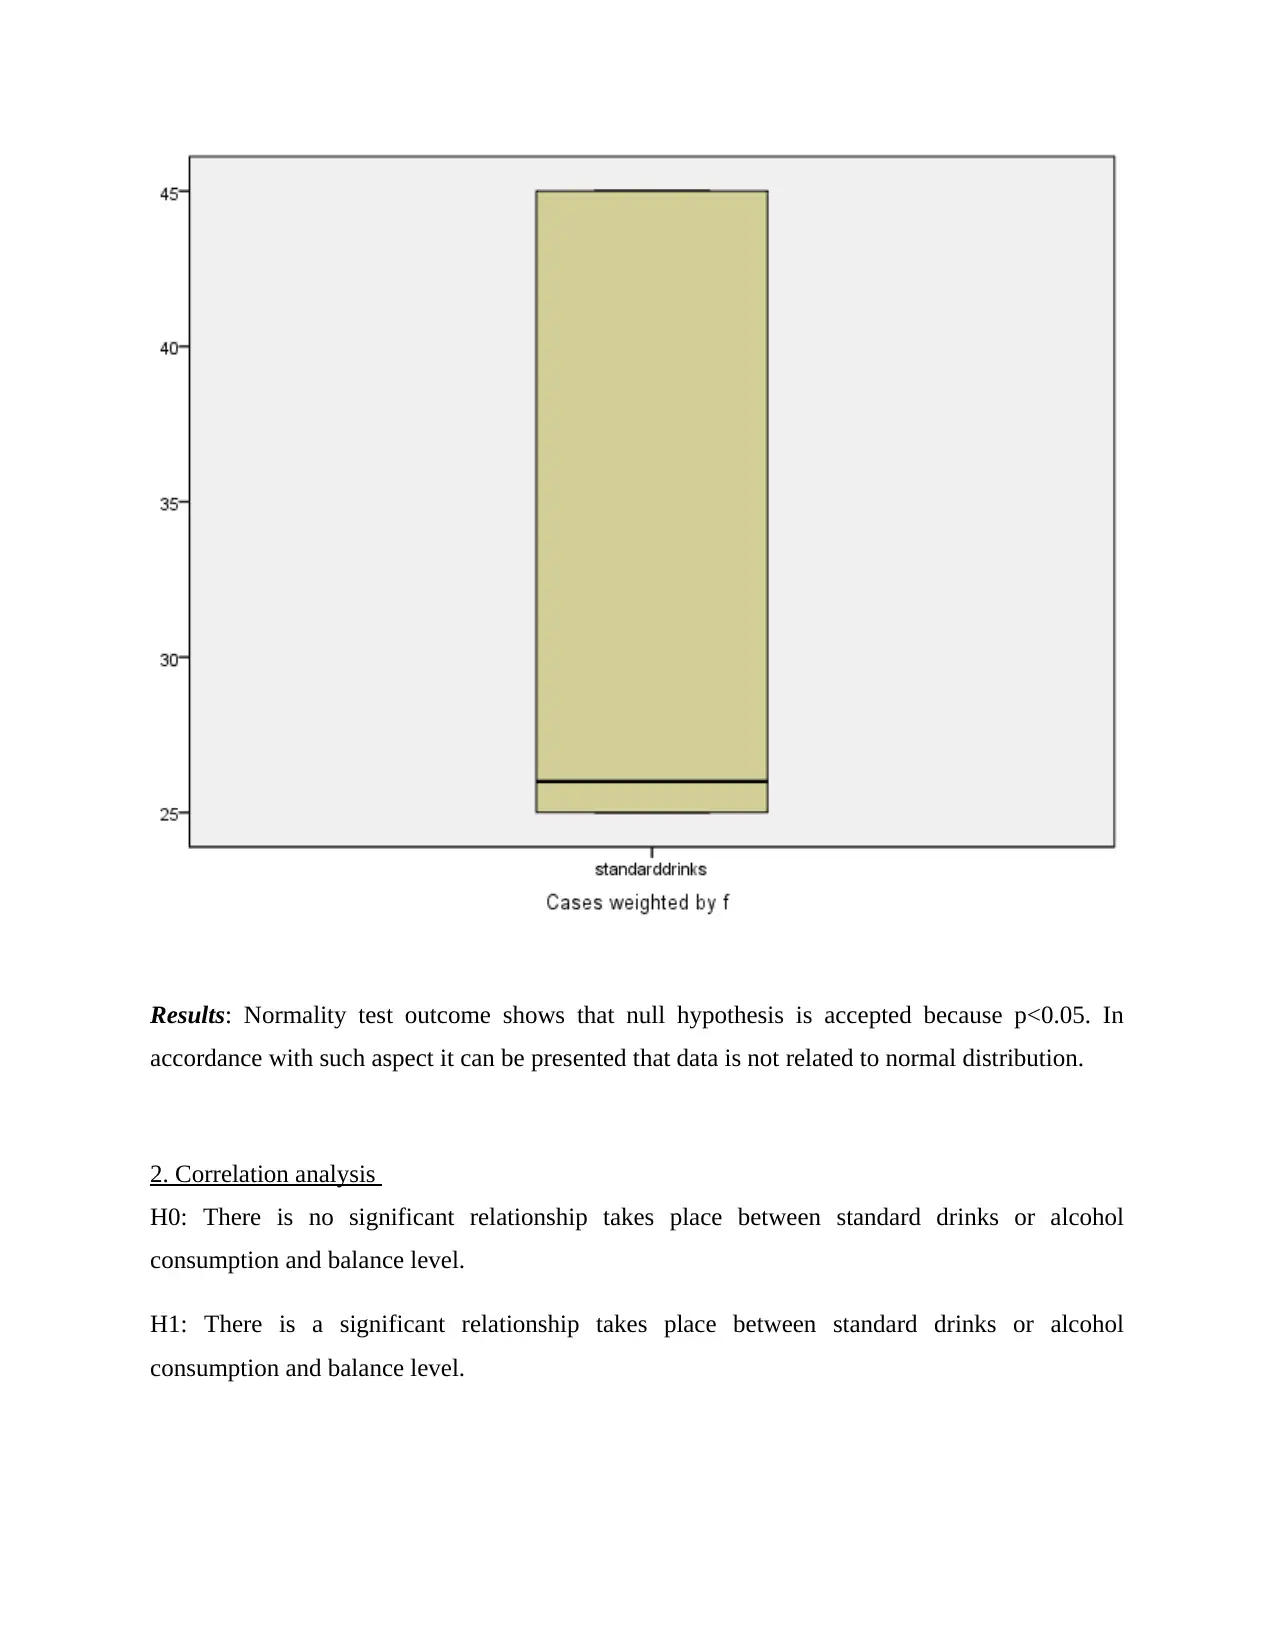
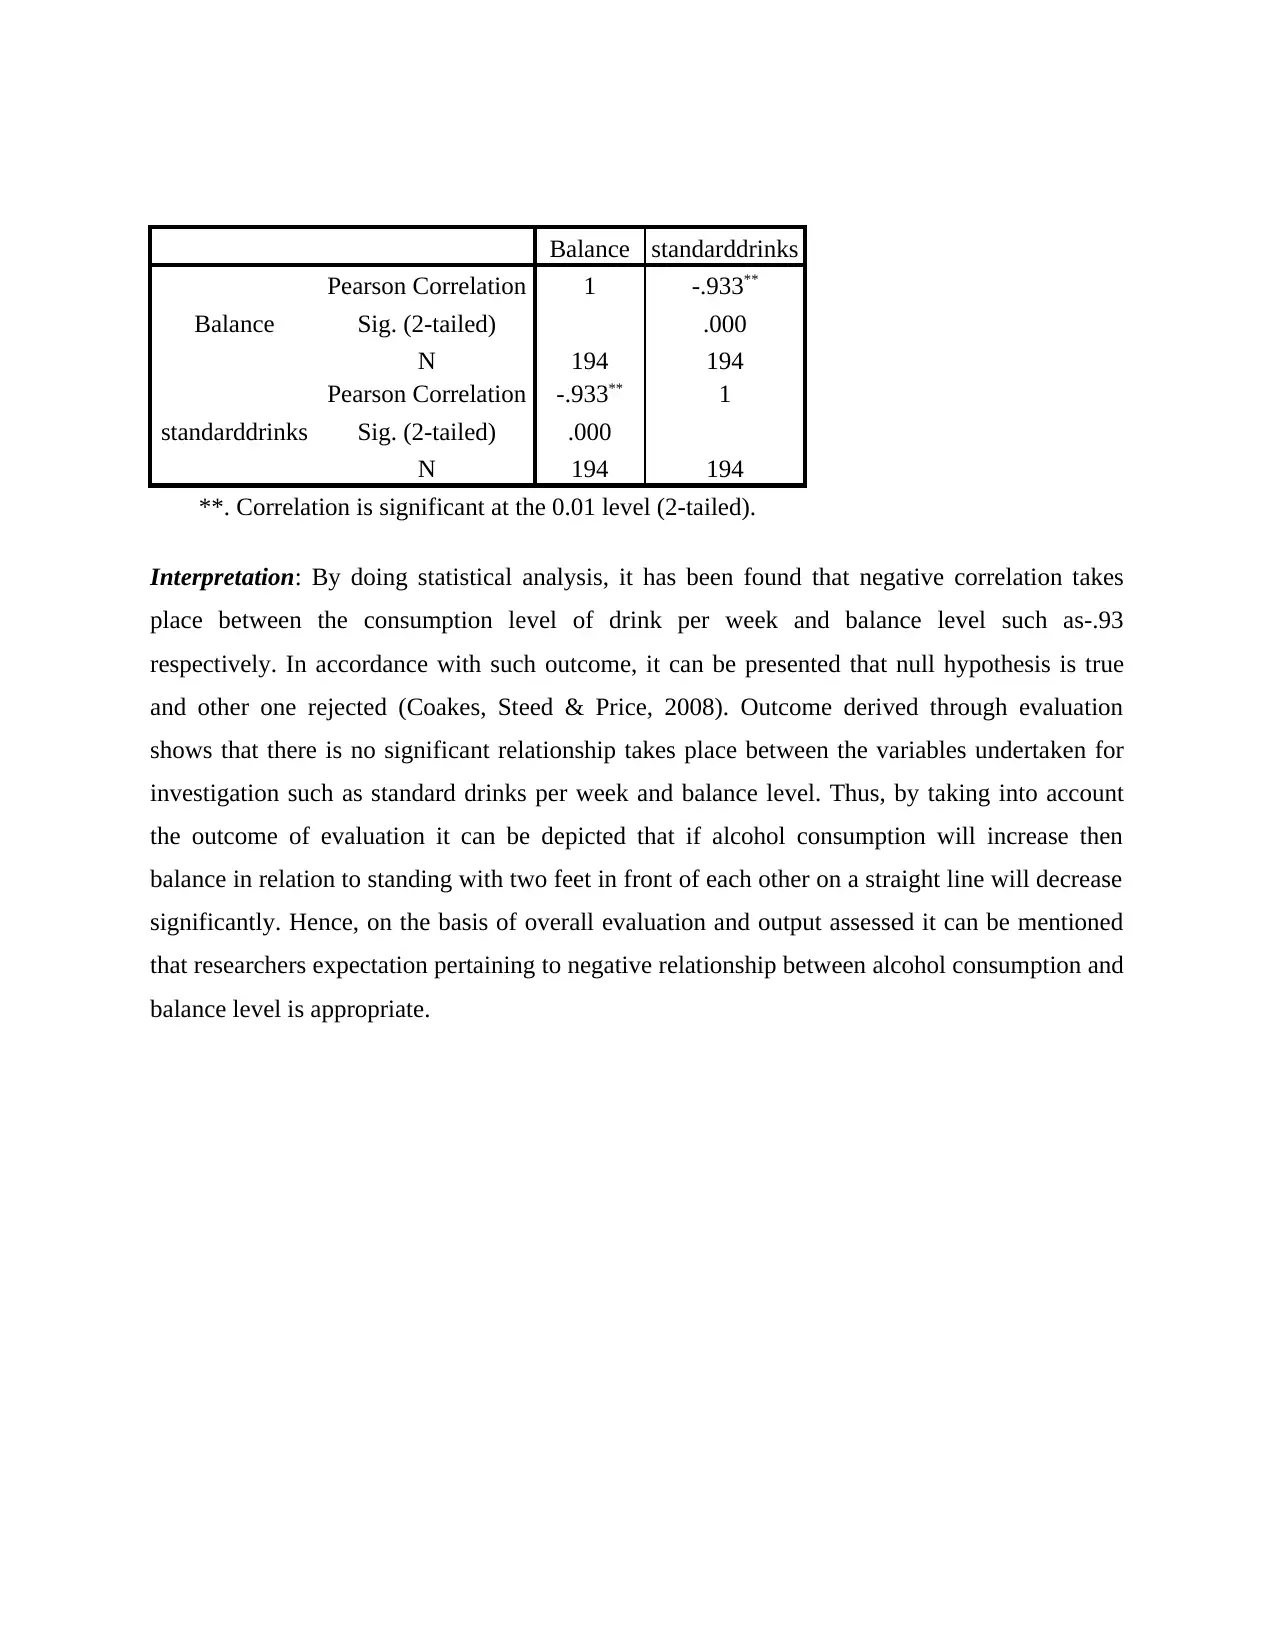
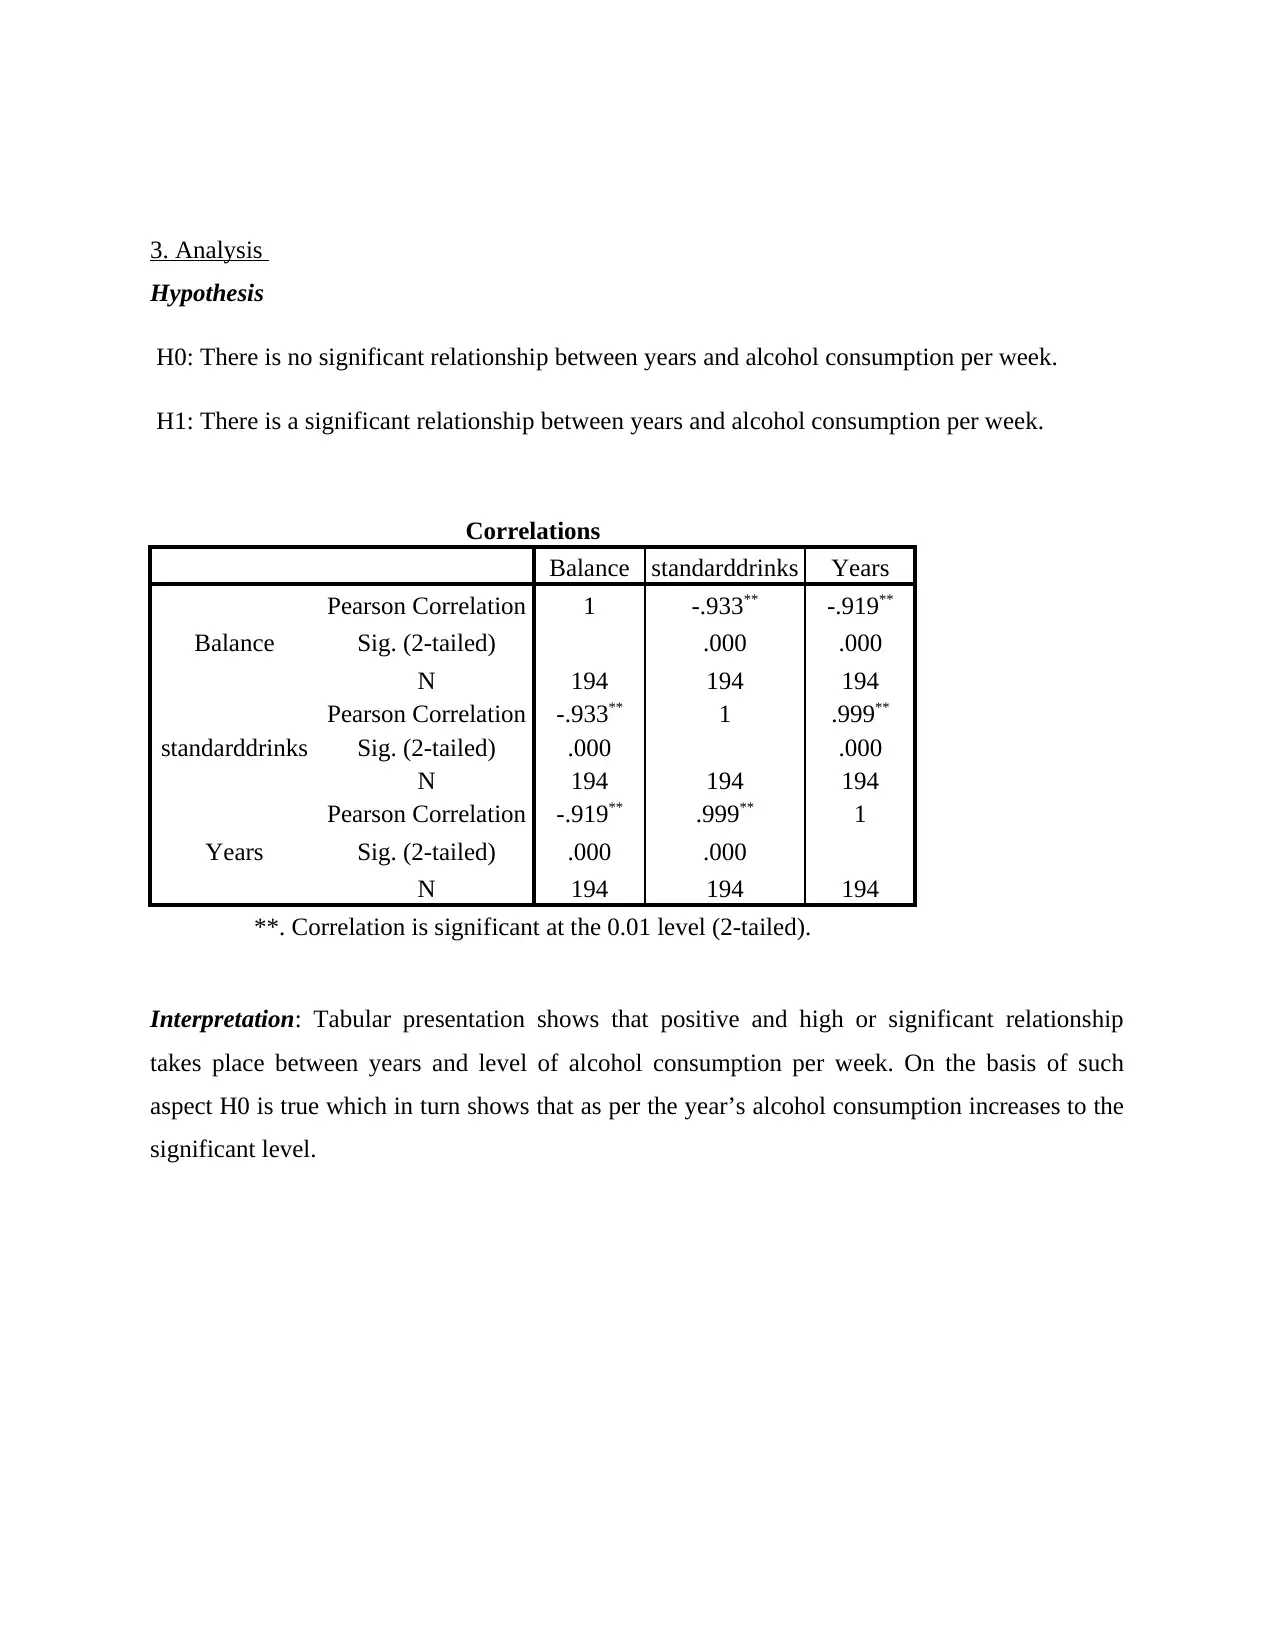
This SPSS assignment presents a correlation analysis examining the relationship between alcohol consumption (standard drinks), balance level, and years. The analysis begins with a normality test to assess data distribution, followed by a Pearson correlation analysis to determine the strength and direction of the relationships between the variables. The results indicate a negative correlation between alcohol consumption and balance, and a positive correlation between years and alcohol consumption. The assignment includes hypothesis testing, interpretations of the statistical findings, and a reference to support the analysis. The study concludes that increased alcohol consumption is associated with decreased balance, and as the years increase the alcohol consumption increases.
Document Page
SPSS- Part 3
tabler-icon-diamond-filled.svg

Paraphrase This Document

Need a fresh take? Get an instant paraphrase of this document with our AI Paraphraser
Document Page
TABLE OF CONTENTS
PART 3............................................................................................................................................1
CORRELATIONS...........................................................................................................................1
TASK 6............................................................................................................................................1
1. Normality test..........................................................................................................................1
2. Correlation analysis.................................................................................................................8
3. Analysis.................................................................................................................................10
REFERENCE................................................................................................................................11
Document Page
PART 3
CORRELATIONS
TASK 6
1. Normality test
Case Processing Summary
Cases
Valid Missing Total
N Percent N Percent N Percent
Balance 194 100.0% 0 0.0% 194 100.0%
standarddrinks 194 100.0% 0 0.0% 194 100.0%
Descriptives
Statistic Std. Error
Balance
Mean 5.1082 .19534
95% Confidence Interval
for Mean
Lower Bound 4.7230
Upper Bound 5.4935
5% Trimmed Mean 5.1203
Median 5.0000
Variance 7.403
Std. Deviation 2.72080
Minimum 2.00
Maximum 8.00
Range 6.00
Interquartile Range 6.00
Skewness -.072 .175
Kurtosis -1.789 .347
standarddrinks Mean 33.0155 .69280
Document Page
95% Confidence Interval
for Mean
Lower Bound 31.6490
Upper Bound 34.3819
5% Trimmed Mean 32.7950
Median 26.0000
Variance 93.114
Std. Deviation 9.64955
Minimum 25.00
Maximum 45.00
Range 20.00
Interquartile Range 20.00
Skewness .443 .175
Kurtosis -1.817 .347
Tests of Normality
Kolmogorov-Smirnova Shapiro-Wilk
Statistic df Sig. Statistic df Sig.
Balance .284 194 .000 .737 194 .000
standarddrinks .375 194 .000 .638 194 .000
a. Lilliefors Significance Correction
tabler-icon-diamond-filled.svg

Paraphrase This Document

Need a fresh take? Get an instant paraphrase of this document with our AI Paraphraser
Document Page
Document Page
Document Page
standarddrinks
standarddrinks Stem-and-Leaf Plot
Frequency Stem & Leaf
194.00 0 .
222222222222222222222222222222222222222222222222222222222224444444444444444444
4444444444444444444
Stem width: 100.00
Each leaf: 2 case(s)
tabler-icon-diamond-filled.svg

Paraphrase This Document

Need a fresh take? Get an instant paraphrase of this document with our AI Paraphraser
Document Page
Document Page
Document Page
Results: Normality test outcome shows that null hypothesis is accepted because p<0.05. In
accordance with such aspect it can be presented that data is not related to normal distribution.
2. Correlation analysis
H0: There is no significant relationship takes place between standard drinks or alcohol
consumption and balance level.
H1: There is a significant relationship takes place between standard drinks or alcohol
consumption and balance level.
tabler-icon-diamond-filled.svg

Paraphrase This Document

Need a fresh take? Get an instant paraphrase of this document with our AI Paraphraser
Document Page
Balance standarddrinks
Balance
Pearson Correlation 1 -.933**
Sig. (2-tailed) .000
N 194 194
standarddrinks
Pearson Correlation -.933** 1
Sig. (2-tailed) .000
N 194 194
**. Correlation is significant at the 0.01 level (2-tailed).
Interpretation: By doing statistical analysis, it has been found that negative correlation takes
place between the consumption level of drink per week and balance level such as-.93
respectively. In accordance with such outcome, it can be presented that null hypothesis is true
and other one rejected (Coakes, Steed & Price, 2008). Outcome derived through evaluation
shows that there is no significant relationship takes place between the variables undertaken for
investigation such as standard drinks per week and balance level. Thus, by taking into account
the outcome of evaluation it can be depicted that if alcohol consumption will increase then
balance in relation to standing with two feet in front of each other on a straight line will decrease
significantly. Hence, on the basis of overall evaluation and output assessed it can be mentioned
that researchers expectation pertaining to negative relationship between alcohol consumption and
balance level is appropriate.
Document Page
3. Analysis
Hypothesis
H0: There is no significant relationship between years and alcohol consumption per week.
H1: There is a significant relationship between years and alcohol consumption per week.
Correlations
Balance standarddrinks Years
Balance
Pearson Correlation 1 -.933** -.919**
Sig. (2-tailed) .000 .000
N 194 194 194
standarddrinks
Pearson Correlation -.933** 1 .999**
Sig. (2-tailed) .000 .000
N 194 194 194
Years
Pearson Correlation -.919** .999** 1
Sig. (2-tailed) .000 .000
N 194 194 194
**. Correlation is significant at the 0.01 level (2-tailed).
Interpretation: Tabular presentation shows that positive and high or significant relationship
takes place between years and level of alcohol consumption per week. On the basis of such
aspect H0 is true which in turn shows that as per the year’s alcohol consumption increases to the
significant level.
chevron_up_icon
1 out of 13
circle_padding
hide_on_mobile
zoom_out_icon
[object Object]