SPSS Analysis of Fremantle Crime Data: Goodness of Fit and Gender
VerifiedAdded on 2020/06/06
|8
|1035
|294
Practical Assignment
AI Summary
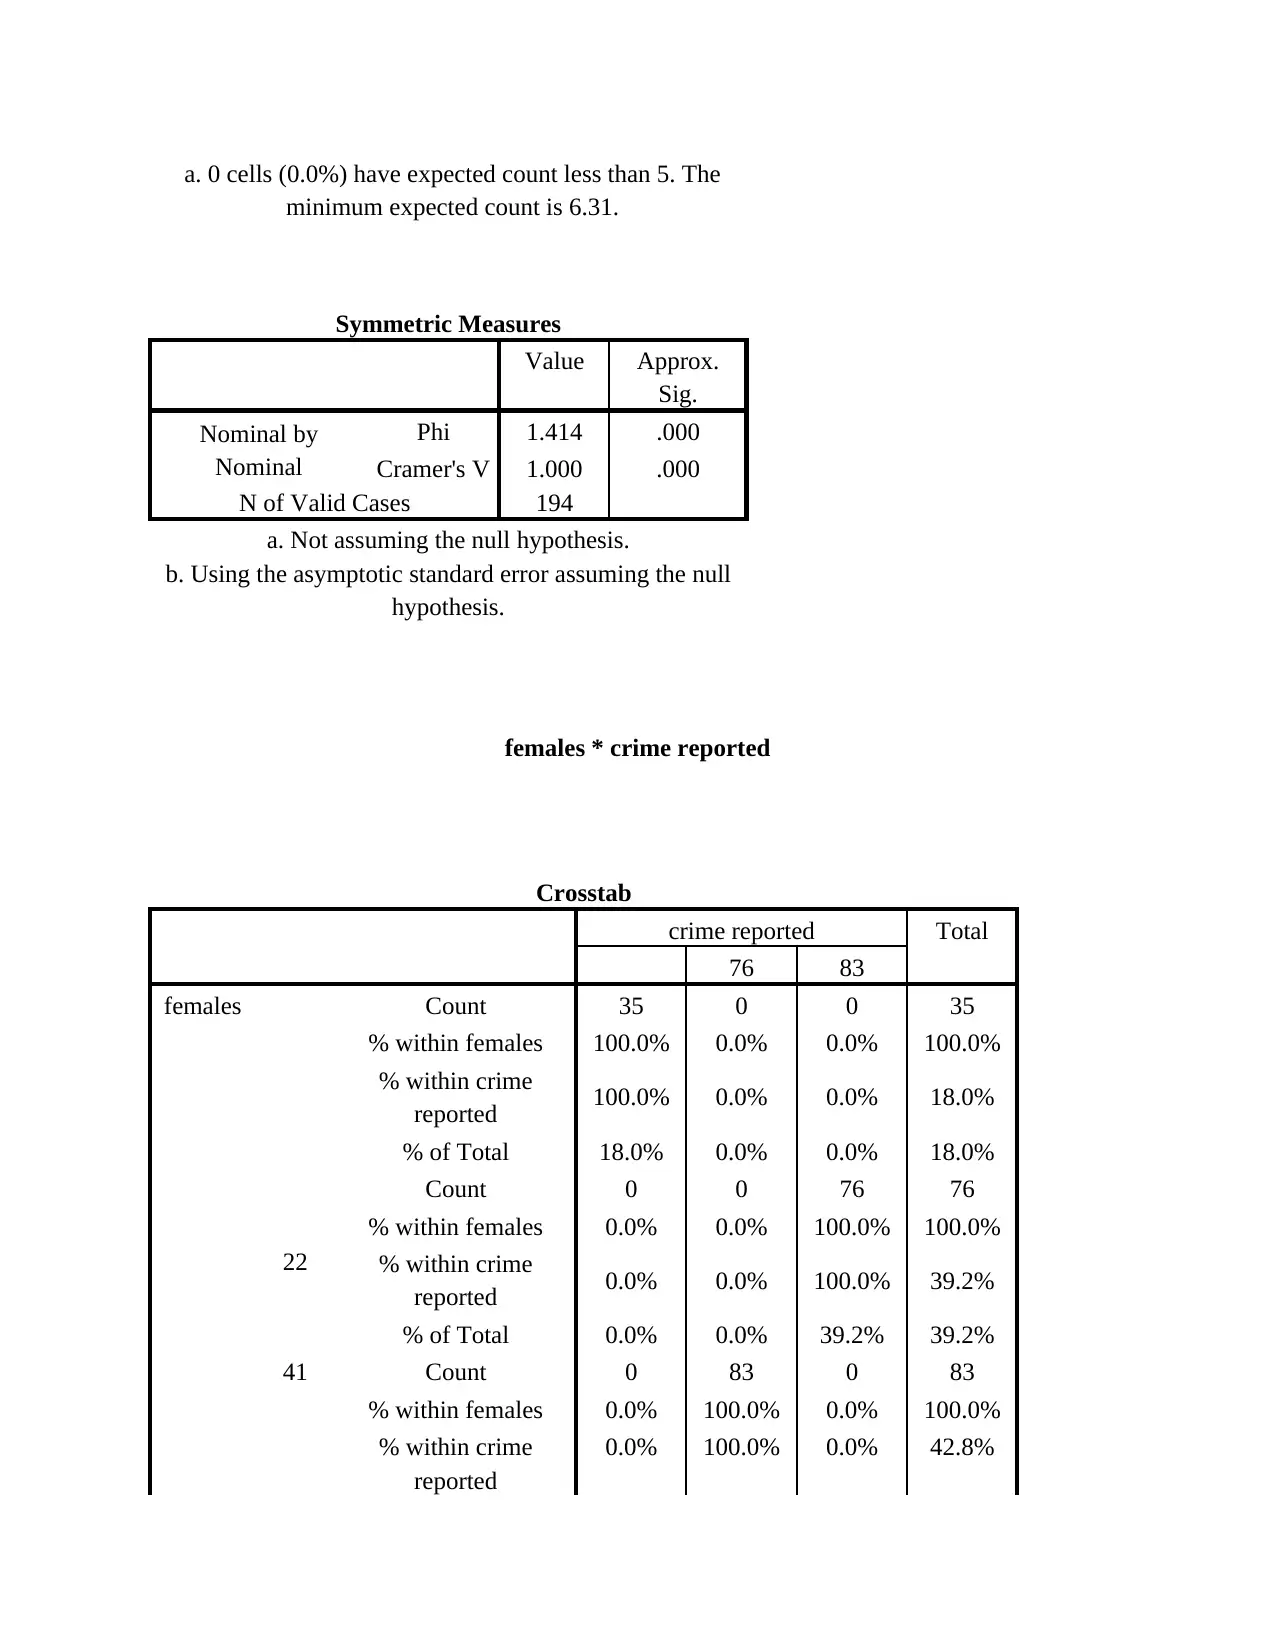
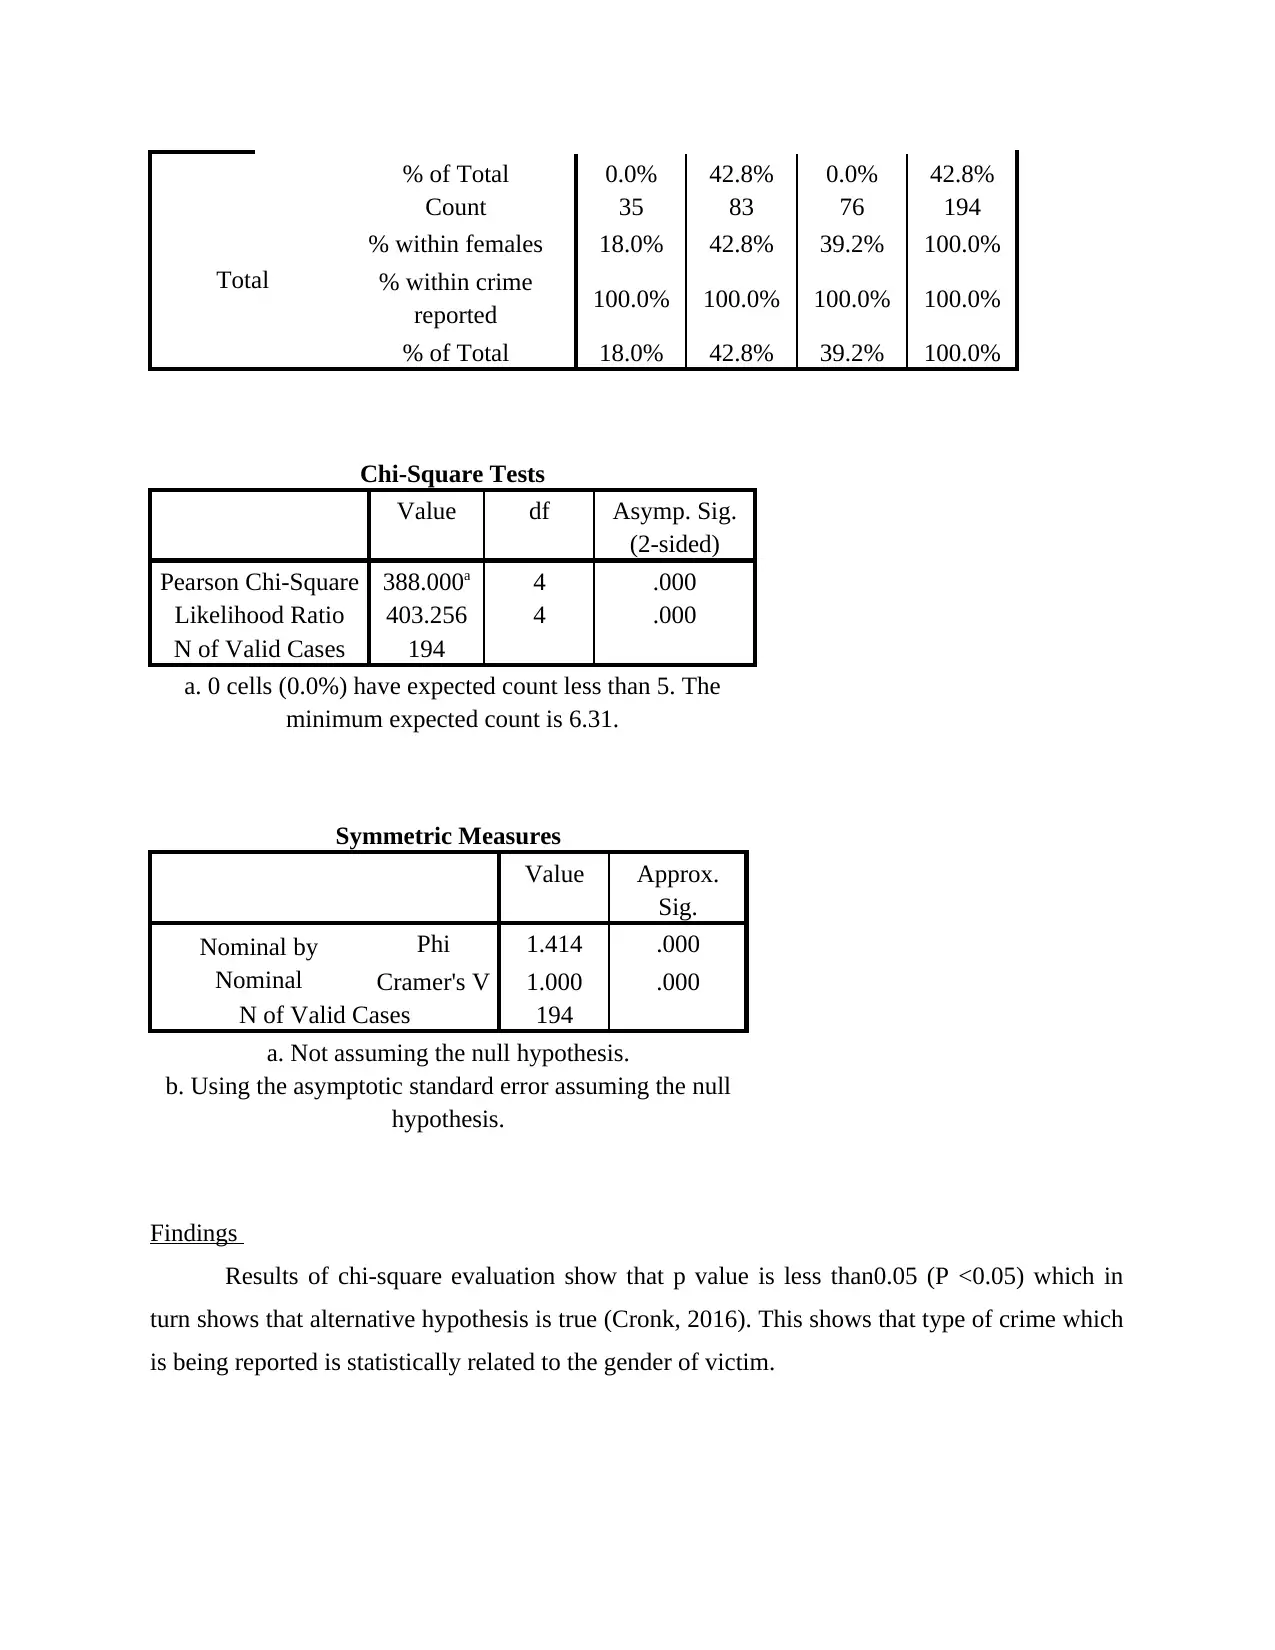
This assignment presents an SPSS analysis of crime data, focusing on Fremantle, and utilizes Chi-square tests to assess the goodness of fit and analyze the relationship between the type of crime and the gender of the victim. The analysis includes descriptive statistics, crosstabs, and Chi-square tests to determine statistical significance. The results indicate that there are statistically significant differences in the reported crimes (burglary, threatening behavior, and motor vehicle theft) and a significant relationship between the type of crime reported and the gender of the victim. The findings suggest that burglary and threatening behavior are more frequent in Fremantle, and the assignment provides a detailed interpretation of the results, including p-values and recommendations for local authorities to develop strategies to reduce crime rates. The document concludes with a list of cited references.

SPSS Part 2
Paraphrase This Document
Need a fresh take? Get an instant paraphrase of this document with our AI Paraphraser

TABLE OF CONTENTS
PART 2............................................................................................................................................3
TASK 4............................................................................................................................................3
Chi-square test to assess goodness to fit......................................................................................3
Results:........................................................................................................................................4
Findings.......................................................................................................................................4
TASK 5............................................................................................................................................4
Findings.......................................................................................................................................8
Results..........................................................................................................................................8
REFERENCES................................................................................................................................9

PART 2
TASK 4
Chi-square test to assess goodness to fit
NPar Tests
Chi-Square Test
Frequencies
Type of crime
Observed N Expected N Residual
Burglury 76 64.7 11.3
Threatening Behaviour 83 64.7 18.3
Motor Vehicle Theft 35 64.7 -29.7
Total 194
Test Statistics
Type of
Crime
Chi-Square 20.794a
df 2
Asymp. Sig. .000
⊘ This is a preview!⊘
Do you want full access?
Subscribe today to unlock all pages.

Trusted by 1+ million students worldwide

a. 0 cells (0.0%) have
expected frequencies less
than 5. The minimum
expected cell frequency is
64.7.
Results:
By applying chi-square test it has been assessed that χ2 (2) = 20.79 respectively and p
value is 0.00 which is less than the standard such as 0.05 (Tanner‐Smith and Tipton, 2014). On
the basis of this, it can be stated that alternative hypothesis is true and there is significant
difference in values of crime reported.
Findings
Investigation outcome shows that crimes which are reported in the category of burglary,
threatening behavior and theft of motor vehicle are statistically different. Moreover, data set
given clearly presents that crime pertaining to threatening behavior reported during the specified
time frame accounts for 83. On the other side, crime related to burglary reported within the last
six months implies for 76. In contrast to this, activities related to motor vehicle theft occurred in
last six months were 35. Hence, by considering all such aspects it can be stated that in the last six
months undesirable activities which occurred more frequently in Fremantle are related to
burglary and aspect of threatening behavior.
TASK 5
Crosstabs
Case Processing Summary
Cases
Valid Missing Total
N Percent N Percent N Percent
males * crime reported 194 100.0% 0 0.0% 194 100.0%
females * crime
reported 194 100.0% 0 0.0% 194 100.0%
Paraphrase This Document
Need a fresh take? Get an instant paraphrase of this document with our AI Paraphraser

males * crime reported
Crosstab
crime reported Total
76 83
males
Count 35 0 0 35
% within males 100.0% 0.0% 0.0% 100.0%
% within crime
reported 100.0% 0.0% 0.0% 18.0%
% of Total 18.0% 0.0% 0.0% 18.0%
35
Count 0 83 0 83
% within males 0.0% 100.0% 0.0% 100.0%
% within crime
reported 0.0% 100.0% 0.0% 42.8%
% of Total 0.0% 42.8% 0.0% 42.8%
61
Count 0 0 76 76
% within males 0.0% 0.0% 100.0% 100.0%
% within crime
reported 0.0% 0.0% 100.0% 39.2%
% of Total 0.0% 0.0% 39.2% 39.2%
Total
Count 35 83 76 194
% within males 18.0% 42.8% 39.2% 100.0%
% within crime
reported 100.0% 100.0% 100.0% 100.0%
% of Total 18.0% 42.8% 39.2% 100.0%
Chi-Square Tests
Value df Asymp. Sig.
(2-sided)
Pearson Chi-Square 388.000a 4 .000
Likelihood Ratio 403.256 4 .000
N of Valid Cases 194

a. 0 cells (0.0%) have expected count less than 5. The
minimum expected count is 6.31.
Symmetric Measures
Value Approx.
Sig.
Nominal by
Nominal
Phi 1.414 .000
Cramer's V 1.000 .000
N of Valid Cases 194
a. Not assuming the null hypothesis.
b. Using the asymptotic standard error assuming the null
hypothesis.
females * crime reported
Crosstab
crime reported Total
76 83
females Count 35 0 0 35
% within females 100.0% 0.0% 0.0% 100.0%
% within crime
reported 100.0% 0.0% 0.0% 18.0%
% of Total 18.0% 0.0% 0.0% 18.0%
22
Count 0 0 76 76
% within females 0.0% 0.0% 100.0% 100.0%
% within crime
reported 0.0% 0.0% 100.0% 39.2%
% of Total 0.0% 0.0% 39.2% 39.2%
41 Count 0 83 0 83
% within females 0.0% 100.0% 0.0% 100.0%
% within crime
reported
0.0% 100.0% 0.0% 42.8%
⊘ This is a preview!⊘
Do you want full access?
Subscribe today to unlock all pages.

Trusted by 1+ million students worldwide

% of Total 0.0% 42.8% 0.0% 42.8%
Total
Count 35 83 76 194
% within females 18.0% 42.8% 39.2% 100.0%
% within crime
reported 100.0% 100.0% 100.0% 100.0%
% of Total 18.0% 42.8% 39.2% 100.0%
Chi-Square Tests
Value df Asymp. Sig.
(2-sided)
Pearson Chi-Square 388.000a 4 .000
Likelihood Ratio 403.256 4 .000
N of Valid Cases 194
a. 0 cells (0.0%) have expected count less than 5. The
minimum expected count is 6.31.
Symmetric Measures
Value Approx.
Sig.
Nominal by
Nominal
Phi 1.414 .000
Cramer's V 1.000 .000
N of Valid Cases 194
a. Not assuming the null hypothesis.
b. Using the asymptotic standard error assuming the null
hypothesis.
Findings
Results of chi-square evaluation show that p value is less than0.05 (P <0.05) which in
turn shows that alternative hypothesis is true (Cronk, 2016). This shows that type of crime which
is being reported is statistically related to the gender of victim.
Paraphrase This Document
Need a fresh take? Get an instant paraphrase of this document with our AI Paraphraser

Results
From assessment, it has been discovered that highly significant or effectual relationship
exist between the reporting for different crimes and gender of the victim. Thus, political
authorities of Fremantle are required to develop suitable strategic framework to reduce the level
of crimes related to burglary and threatening behavior.
1 out of 8
Related Documents

Your All-in-One AI-Powered Toolkit for Academic Success.
+13062052269
info@desklib.com
Available 24*7 on WhatsApp / Email
Unlock your academic potential
Copyright © 2020–2025 A2Z Services. All Rights Reserved. Developed and managed by ZUCOL.