Organizational Commitment at UWA: An SPSS Project Data Analysis
VerifiedAdded on 2020/10/23
|15
|2692
|146
Project
AI Summary
This SPSS project analyzes organizational commitment among students at UWA. It examines the three components of commitment: affective, normative, and continuance, using factor analysis, ANOVA, and hierarchical regression. The project tests three hypotheses related to the relationships between these commitment types and factors such as work experience and time spent on university work. The analysis includes descriptive statistics, KMO and Bartlett's tests, scree plots, and pattern matrices to assess the validity and reliability of the data. The findings reveal correlations between the commitment components and their antecedents, as well as the impact of work hours and gender on time spent on university work. The project concludes that affective and continuance commitments are positively correlated, while normative commitment shows a negative correlation, and that there is no significant difference in commitment levels based on employment status. The project provides detailed analysis of the results, including model summaries, coefficients, and significance levels, and concludes by summarizing the findings and drawing inferences about the nature of organizational commitment within the UWA student population.

SPSS PROJECT
Paraphrase This Document
Need a fresh take? Get an instant paraphrase of this document with our AI Paraphraser
Table of Contents
INTRODUCTION...........................................................................................................................1
DATA ANALYSIS AND HYPOTHESES TESTING....................................................................1
Analysing the Results of Hypotheses Testing.............................................................................2
CONCLUSION................................................................................................................................5
REFERENCES................................................................................................................................6
DATA ANALYSIS AND HYPOTHESES TESTING
As per the Journal Paper published by Meyer and Allen in 1990, the three component
conceptualization of organisational commitment are best viewed as elements rather than types of
attitudinal commitment. This means that employees may experience such psychological aspects
in varying degrees depending on certain characteristics. The four main antecedents can be
categorised as Work Experience as well as Personal, Structural and Job Characteristics. Out of
these, the antecedents related to Work Experience have proved to be the strongest which mostly
relate to the fulfilment of psychological needs that ensure employee's comfortableness and
competence in the work-role carried out by them in the business enterprise.
The hypotheses testing conducted by the two authors is based around the view that: Development of Measures [Study 1]: If the three components of commitment are to
reflect different psychological experience to the employees, there may be a possibility to
germinate independent measures for them.
Antecedents of Commitment [Study 2]: If Study 1 is successful, their measures must
correlate to Work Experience Antecedents but not with characteristics associated with
other components.
In addition to this, Normative Commitment has been included in order to analyse the pattern of
its relation with antecedents predicted as well as associated with affective and continuance
components along with enabling better understanding,
Analysing the Results of Hypotheses Testing
Test 1: Organisational commitment to the university comprises three factors: affective,
normative and continuance commitment.
For the purpose, a seven-point scale has been utilised as can be observed in Appendices
Section Part 1 of this report. The data collected for this Test, included a sample size of 356
students enrolled at the UWA University (Blunch, 2012). Correlations were derived from the
recoded items [Appendices Section Part 1], out of which four items were eliminated due to low
correlation criteria:
I would be very happy to spend the rest of my career at UWA;
If I had already not put so much of myself into UWA I might consider studying
elsewhere; and
1
⊘ This is a preview!⊘
Do you want full access?
Subscribe today to unlock all pages.
Trusted by 1+ million students worldwide
I do not feel any obligation to remain with UWA.
The raw data was recorded using Descriptive Statistics Methodology in a non-recoded
manner. This was further recoded for 5 variables using Reverse Scoring techniques for the
seven-point scales so that higher values indicated a more positive outlook on the results
generated. These are as follows:
Org_Commitment_7
Org_Commitment_8
Org_Commitment_9
Org_Commitment_10
Org_Commitment_12
KMO and Bartlett's Test:
The results inferred from SPSS consisted of Factor Analysis for which the Extraction
Method used is Principle Component Analysis (PCA) along with Rotation using Oblimin with
Kaiser Normalization (Barrett & et.al, 2012). This Rotation Method has been used in order to
derive the adequacy of the sample taken into consideration. A value of 0.826 is closer to 1 which
indicates better prospects or sufficiency of the given sample taken into consideration, that is 356
students going to UWA University (Eslami and Gharakhani, 2012). Thus, it is okay to proceed
with Factor Analysis. On the other hand, Bartlett's Test of Sphericity tests the null hypotheses
wherein the diagonal elements equal one whereas off-diagonal elements equal zero. Here, the p-
value (Sig.) 0.000 is less than 0.005 and hence it can be concluded that the Factor Analysis taken
into account is of valid nature. Thus, one can reject the null hypotheses (H0) and accept alternate
hypotheses (H1). Approx. Chi-Square1687.825 and degree of freedom (df) of 91 indicates that
Factor Analysis is an appropriate technique to be employed for this dataset.
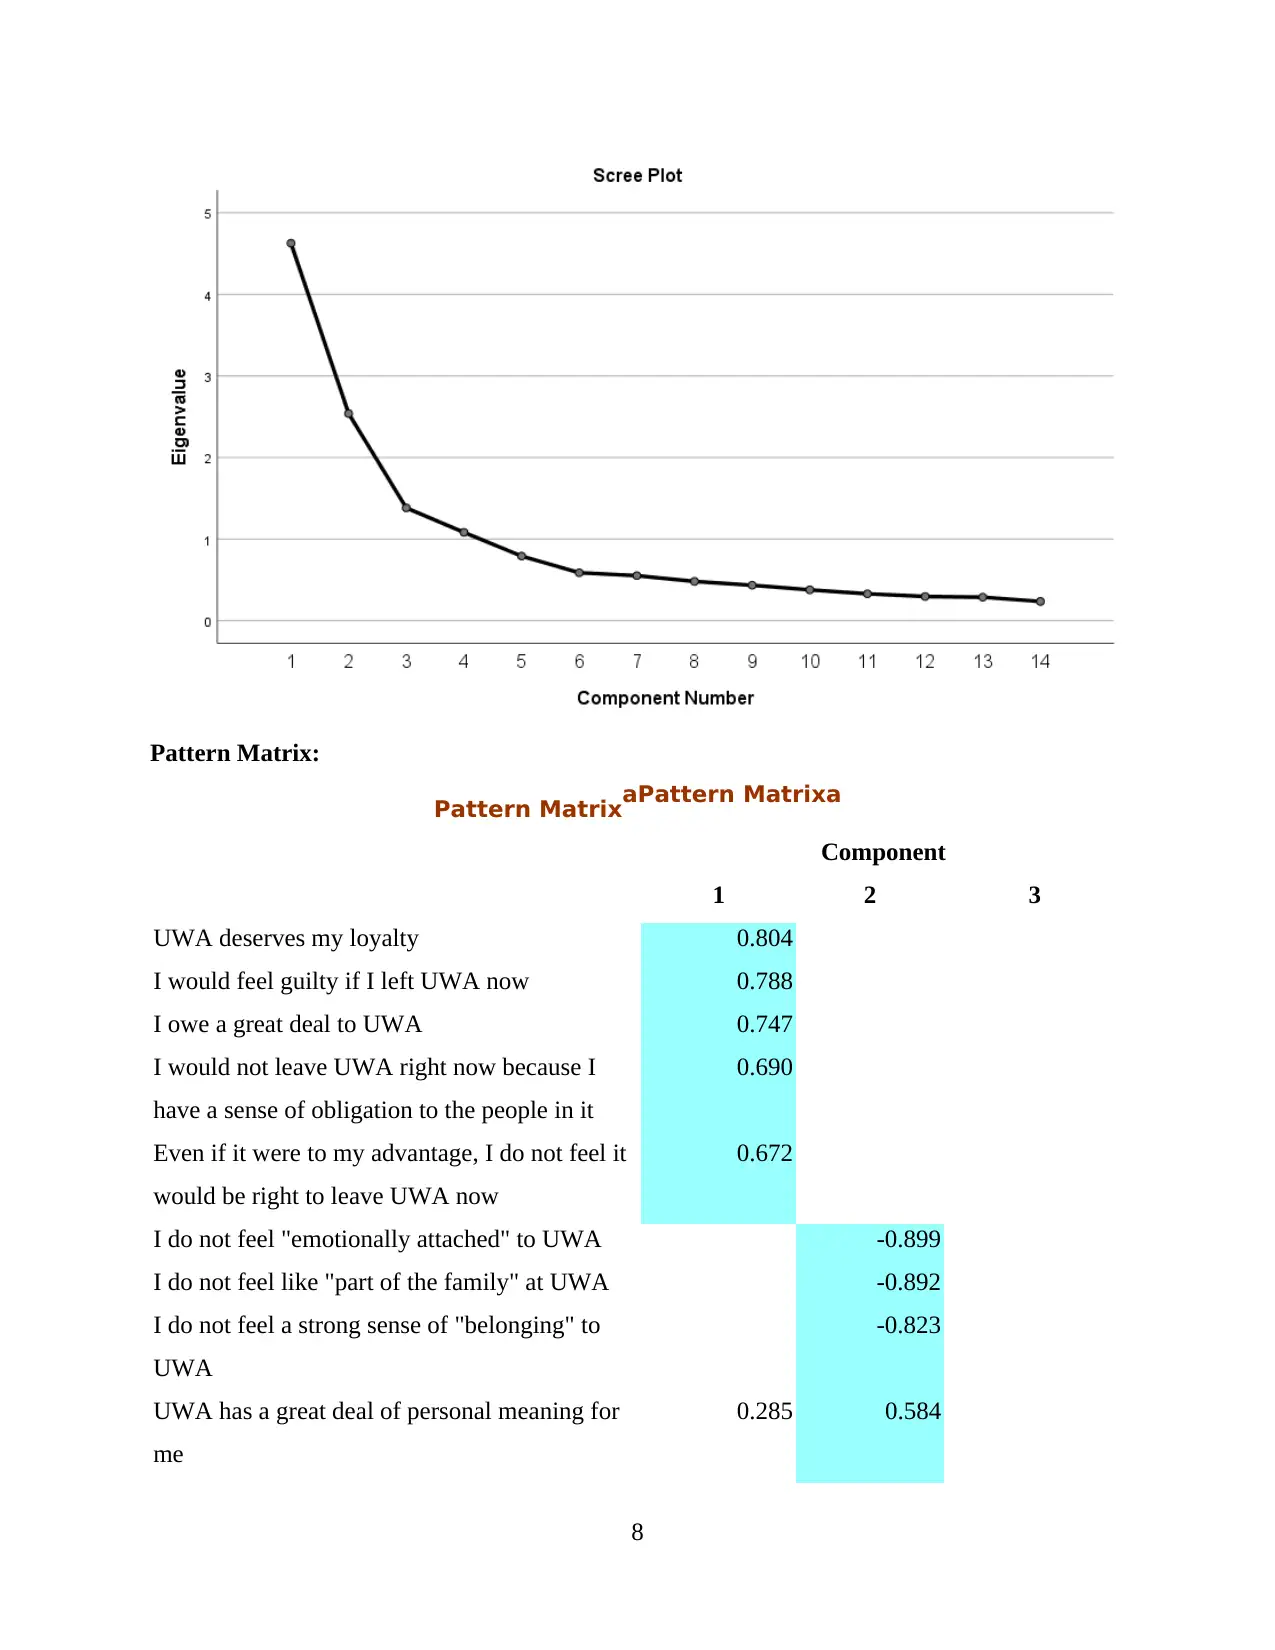
Scree Plot:
The factors have been ascertained using Eigenvalues that exceed 1 which have then been
plotted on a Scree Plot. The scree plot indicated a break/inflexion point at 3 factors, so the factor
analysis was re-run by restricting the number of factors to 3 as shown in Appendices Section Part
3. In this case, the three main factors or determinants of measures are Affective, Normative and
Continuance Commitment. There is a sharp curvature after the third factor indicating that as one
moves towards the right end of the graph, total variance amounts go on decreasing (Leech,
Barrett and Morgan, 2013).
2
The raw data was recorded using Descriptive Statistics Methodology in a non-recoded
manner. This was further recoded for 5 variables using Reverse Scoring techniques for the
seven-point scales so that higher values indicated a more positive outlook on the results
generated. These are as follows:
Org_Commitment_7
Org_Commitment_8
Org_Commitment_9
Org_Commitment_10
Org_Commitment_12
KMO and Bartlett's Test:
The results inferred from SPSS consisted of Factor Analysis for which the Extraction
Method used is Principle Component Analysis (PCA) along with Rotation using Oblimin with
Kaiser Normalization (Barrett & et.al, 2012). This Rotation Method has been used in order to
derive the adequacy of the sample taken into consideration. A value of 0.826 is closer to 1 which
indicates better prospects or sufficiency of the given sample taken into consideration, that is 356
students going to UWA University (Eslami and Gharakhani, 2012). Thus, it is okay to proceed
with Factor Analysis. On the other hand, Bartlett's Test of Sphericity tests the null hypotheses
wherein the diagonal elements equal one whereas off-diagonal elements equal zero. Here, the p-
value (Sig.) 0.000 is less than 0.005 and hence it can be concluded that the Factor Analysis taken
into account is of valid nature. Thus, one can reject the null hypotheses (H0) and accept alternate
hypotheses (H1). Approx. Chi-Square1687.825 and degree of freedom (df) of 91 indicates that
Factor Analysis is an appropriate technique to be employed for this dataset.
Scree Plot:
The factors have been ascertained using Eigenvalues that exceed 1 which have then been
plotted on a Scree Plot. The scree plot indicated a break/inflexion point at 3 factors, so the factor
analysis was re-run by restricting the number of factors to 3 as shown in Appendices Section Part
3. In this case, the three main factors or determinants of measures are Affective, Normative and
Continuance Commitment. There is a sharp curvature after the third factor indicating that as one
moves towards the right end of the graph, total variance amounts go on decreasing (Leech,
Barrett and Morgan, 2013).
2
Paraphrase This Document
Need a fresh take? Get an instant paraphrase of this document with our AI Paraphraser
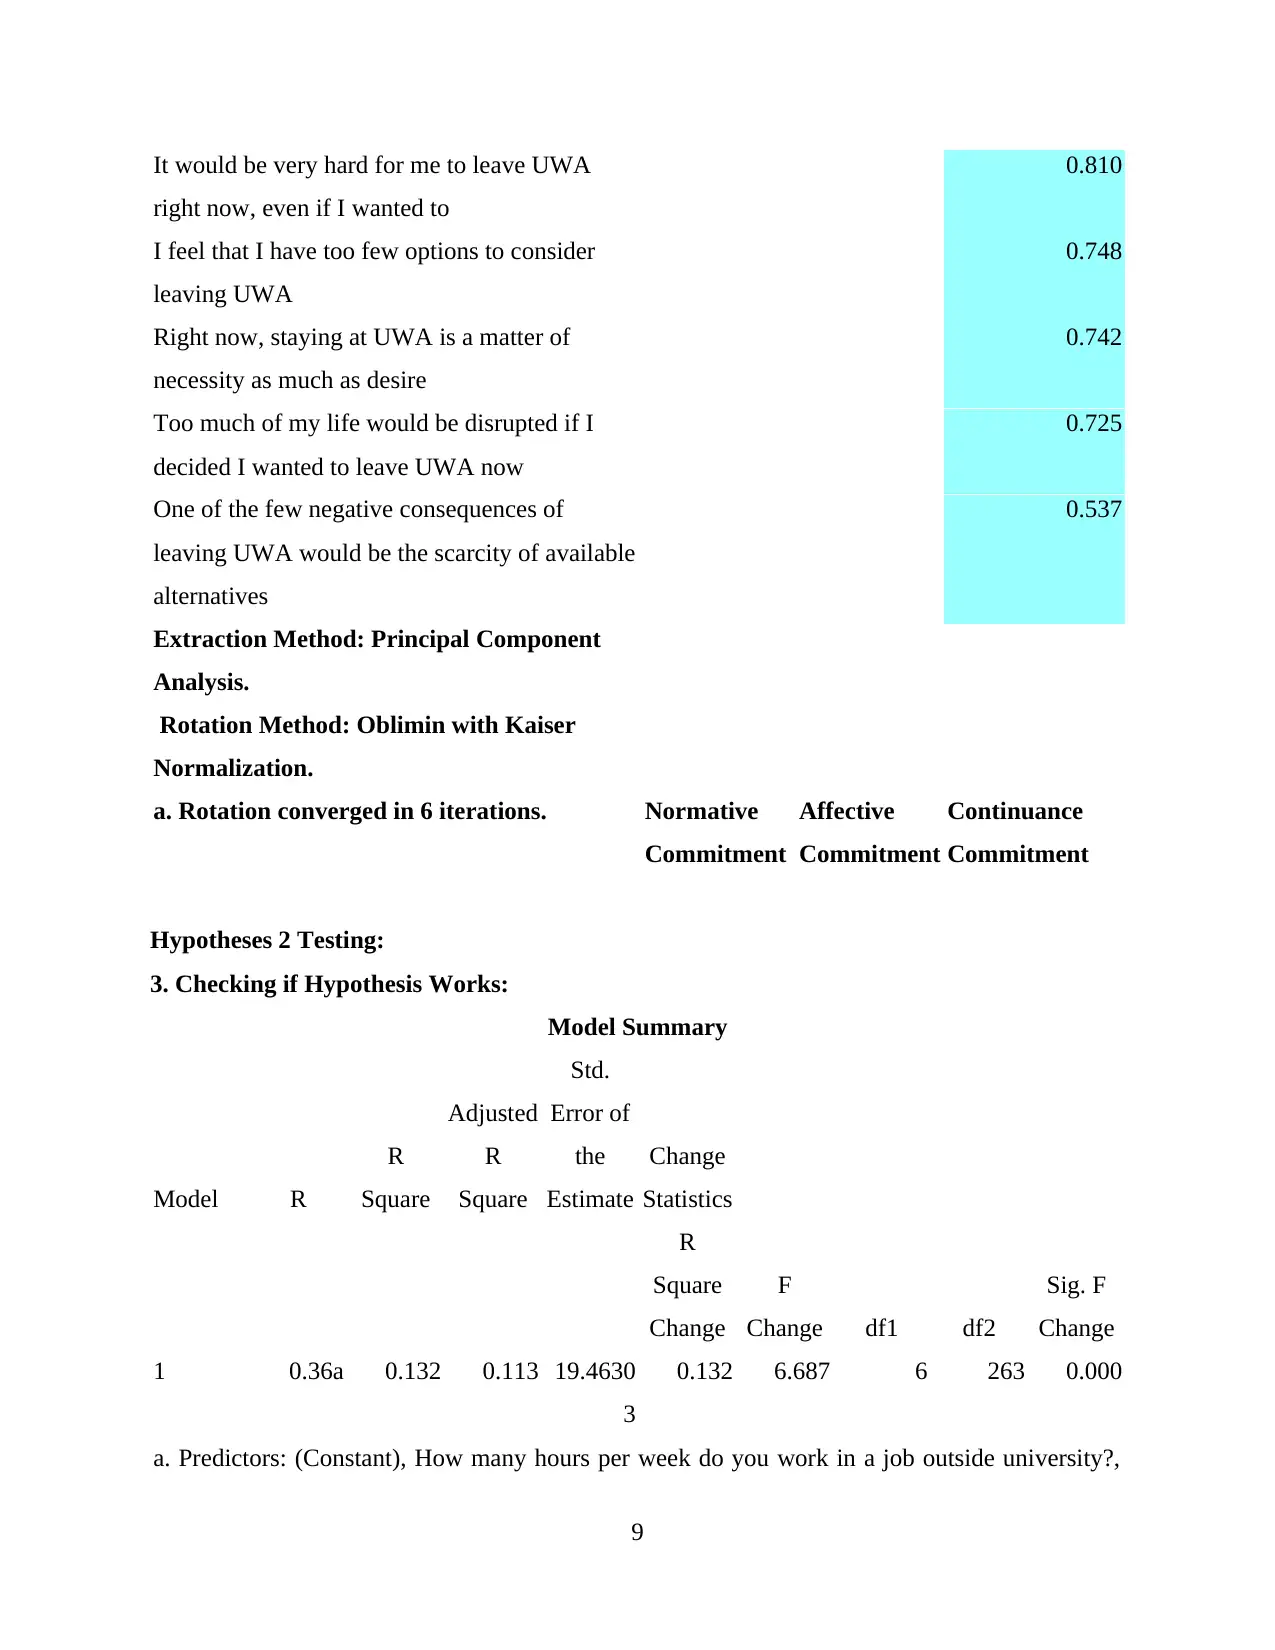
Pattern Matrix:
PCA provides a transformation of original values into a whole new mutually orthogonal
set. Factor Analysis was run 14 variables. The Pattern Matrix indicates the orthogonal rotation
shows correlation between the three components of organisational commitment as well as the
variables falling under these categories. There is a high correlation between factors with positive
correlation observed between Factor 1 and 3, that is, Normative and Continuance Commitment
whereas Factor 3 (Affective Commitment) indicates a negative correlation. This means that there
is an opposite effect on the Factor when other two given components move in the same direction.
Test 2: The time spent by students on their university work is significantly predicted by: (a)
conscientiousness; extroversion; affective commitment; normative commitment;
continuance commitment; and amount of time working in a job outside the university.
These effects will be significant even after controlling for gender.
For this study, two scenarios have been created and a hierarchical multiple regression is
applied. The first one includes the results when gender is not controlled whereas the second one
includes controlling for gender. The dependent variable for both cases is Time Spent which is the
Sum of Estimates SQ001 to SQ004.
Model Summary:
The Model Summary shows the relationship between the model and the dependent
variable. The value of R in both scenarios comes out to be 0.364 and 0.76, 0.383, for First and
Second Scenarios mentioned in the Appendices Section Part 3 and 4 respectively. This means
that there is a strong relationship exhibited between values when there is a significant amount of
control exercised on gender as opposed to when there is no control exercised on the gender factor
of the given dataset (Meyer and et.al., 2012).
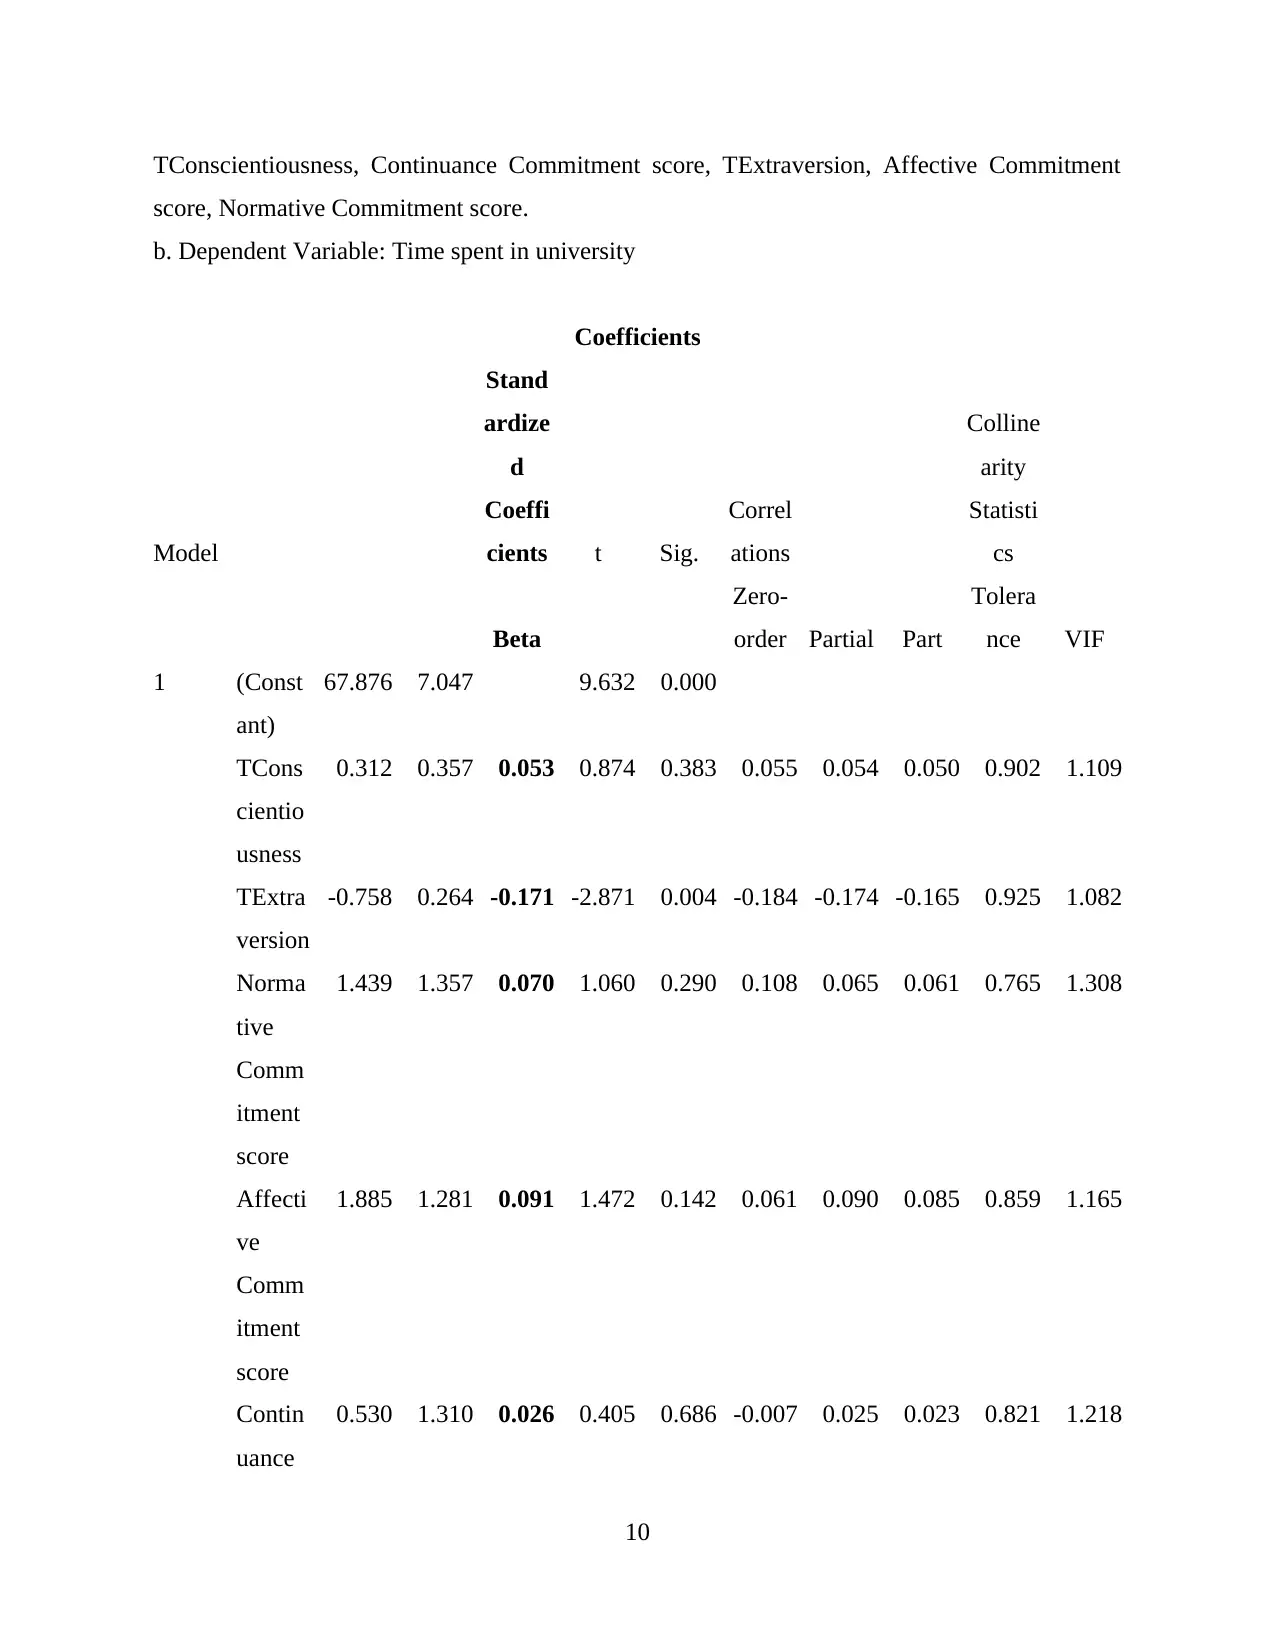
Coefficients:
For the first scenario, the Appendices Section Part 3 of this report named Standardized
'coefficients' show that Tconscientiousness, Normative Commitment, Affective Commitment and
Continuance Commitment impact Time Spent in University positively, while Textraversion and
Hours spent at work impact it negatively. However, only Hours spent at work is significant.
As far as the second scenario is concerned, Controlling for gender (entering gender as
the first block in the Hierarchical Regression procedure in SPSS) does not change the results
3
PCA provides a transformation of original values into a whole new mutually orthogonal
set. Factor Analysis was run 14 variables. The Pattern Matrix indicates the orthogonal rotation
shows correlation between the three components of organisational commitment as well as the
variables falling under these categories. There is a high correlation between factors with positive
correlation observed between Factor 1 and 3, that is, Normative and Continuance Commitment
whereas Factor 3 (Affective Commitment) indicates a negative correlation. This means that there
is an opposite effect on the Factor when other two given components move in the same direction.
Test 2: The time spent by students on their university work is significantly predicted by: (a)
conscientiousness; extroversion; affective commitment; normative commitment;
continuance commitment; and amount of time working in a job outside the university.
These effects will be significant even after controlling for gender.
For this study, two scenarios have been created and a hierarchical multiple regression is
applied. The first one includes the results when gender is not controlled whereas the second one
includes controlling for gender. The dependent variable for both cases is Time Spent which is the
Sum of Estimates SQ001 to SQ004.
Model Summary:
The Model Summary shows the relationship between the model and the dependent
variable. The value of R in both scenarios comes out to be 0.364 and 0.76, 0.383, for First and
Second Scenarios mentioned in the Appendices Section Part 3 and 4 respectively. This means
that there is a strong relationship exhibited between values when there is a significant amount of
control exercised on gender as opposed to when there is no control exercised on the gender factor
of the given dataset (Meyer and et.al., 2012).
Coefficients:
For the first scenario, the Appendices Section Part 3 of this report named Standardized
'coefficients' show that Tconscientiousness, Normative Commitment, Affective Commitment and
Continuance Commitment impact Time Spent in University positively, while Textraversion and
Hours spent at work impact it negatively. However, only Hours spent at work is significant.
As far as the second scenario is concerned, Controlling for gender (entering gender as
the first block in the Hierarchical Regression procedure in SPSS) does not change the results
3
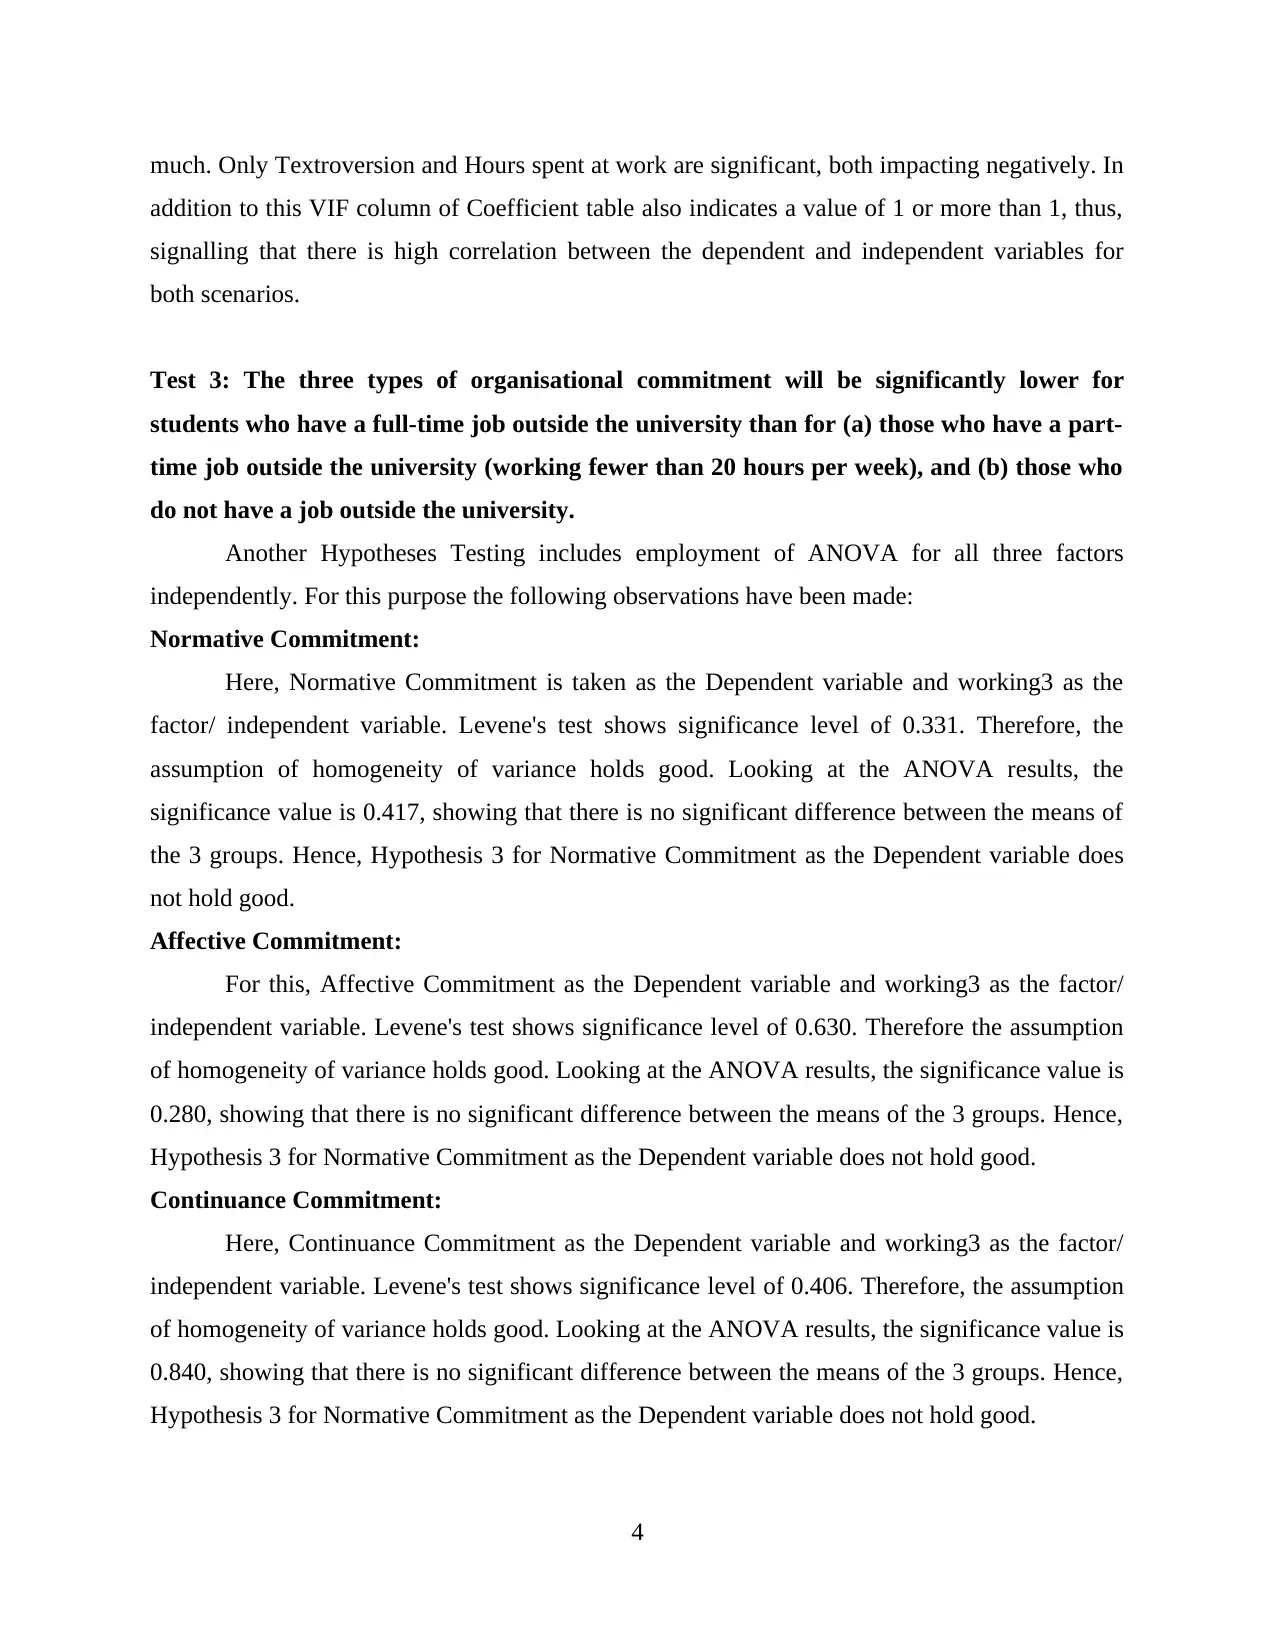
much. Only Textroversion and Hours spent at work are significant, both impacting negatively. In
addition to this VIF column of Coefficient table also indicates a value of 1 or more than 1, thus,
signalling that there is high correlation between the dependent and independent variables for
both scenarios.
Test 3: The three types of organisational commitment will be significantly lower for
students who have a full-time job outside the university than for (a) those who have a part-
time job outside the university (working fewer than 20 hours per week), and (b) those who
do not have a job outside the university.
Another Hypotheses Testing includes employment of ANOVA for all three factors
independently. For this purpose the following observations have been made:
Normative Commitment:
Here, Normative Commitment is taken as the Dependent variable and working3 as the
factor/ independent variable. Levene's test shows significance level of 0.331. Therefore, the
assumption of homogeneity of variance holds good. Looking at the ANOVA results, the
significance value is 0.417, showing that there is no significant difference between the means of
the 3 groups. Hence, Hypothesis 3 for Normative Commitment as the Dependent variable does
not hold good.
Affective Commitment:
For this, Affective Commitment as the Dependent variable and working3 as the factor/
independent variable. Levene's test shows significance level of 0.630. Therefore the assumption
of homogeneity of variance holds good. Looking at the ANOVA results, the significance value is
0.280, showing that there is no significant difference between the means of the 3 groups. Hence,
Hypothesis 3 for Normative Commitment as the Dependent variable does not hold good.
Continuance Commitment:
Here, Continuance Commitment as the Dependent variable and working3 as the factor/
independent variable. Levene's test shows significance level of 0.406. Therefore, the assumption
of homogeneity of variance holds good. Looking at the ANOVA results, the significance value is
0.840, showing that there is no significant difference between the means of the 3 groups. Hence,
Hypothesis 3 for Normative Commitment as the Dependent variable does not hold good.
4
⊘ This is a preview!⊘
Do you want full access?
Subscribe today to unlock all pages.
Trusted by 1+ million students worldwide
Looking at these inferences, one can say that there is no significant difference between
the groups working outside the university on a part-time basis, the ones working full time as well
as those having no job outside the UWA University. Thus, the hypotheses stands rejected
(Pallant, 2013).
CONCLUSION
From the above report it can be inferred that organisational commitment has three
conceptualized factors or measurements of units viz. Affective, Normative and Continuance
Commitments. Looking at each hypotheses it can be concluded that while affective and
continuance commitment among students towards UWA University goes hand in hand, there is a
negative correlation that exists between these two variables and Normative Commitment which
states that one strongly feels that they ought to stay at an organisation such as UWA university.
On the other hand, Affective and Continuance state that students remain in the university
because they want to whereas continuance states that they feel they need to.
5
Paraphrase This Document
Need a fresh take? Get an instant paraphrase of this document with our AI Paraphraser
REFERENCES
Books and Journal
Barrett, K. C. & et.al. (2012). IBM SPSS for introductory statistics: Use and interpretation.
Routledge.
Blunch, N. (2012). Introduction to structural equation modeling using IBM SPSS statistics and
AMOS. Sage.
Eslami, J., & Gharakhani, D. (2012). Organizational commitment and job satisfaction. ARPN
Journal of Science and Technology. 2(2). 85-91.
Leech, N., Barrett, K., & Morgan, G. A. (2013). SPSS for intermediate statistics: Use and
interpretation. Routledge.
Meyer, J. P. & et.al. (2012). Affective, normative, and continuance commitment levels across
cultures: A meta-analysis. Journal of Vocational Behavior. 80(2). 225-245.
Pallant, J. (2013). SPSS survival manual. McGraw-Hill Education (UK).
6
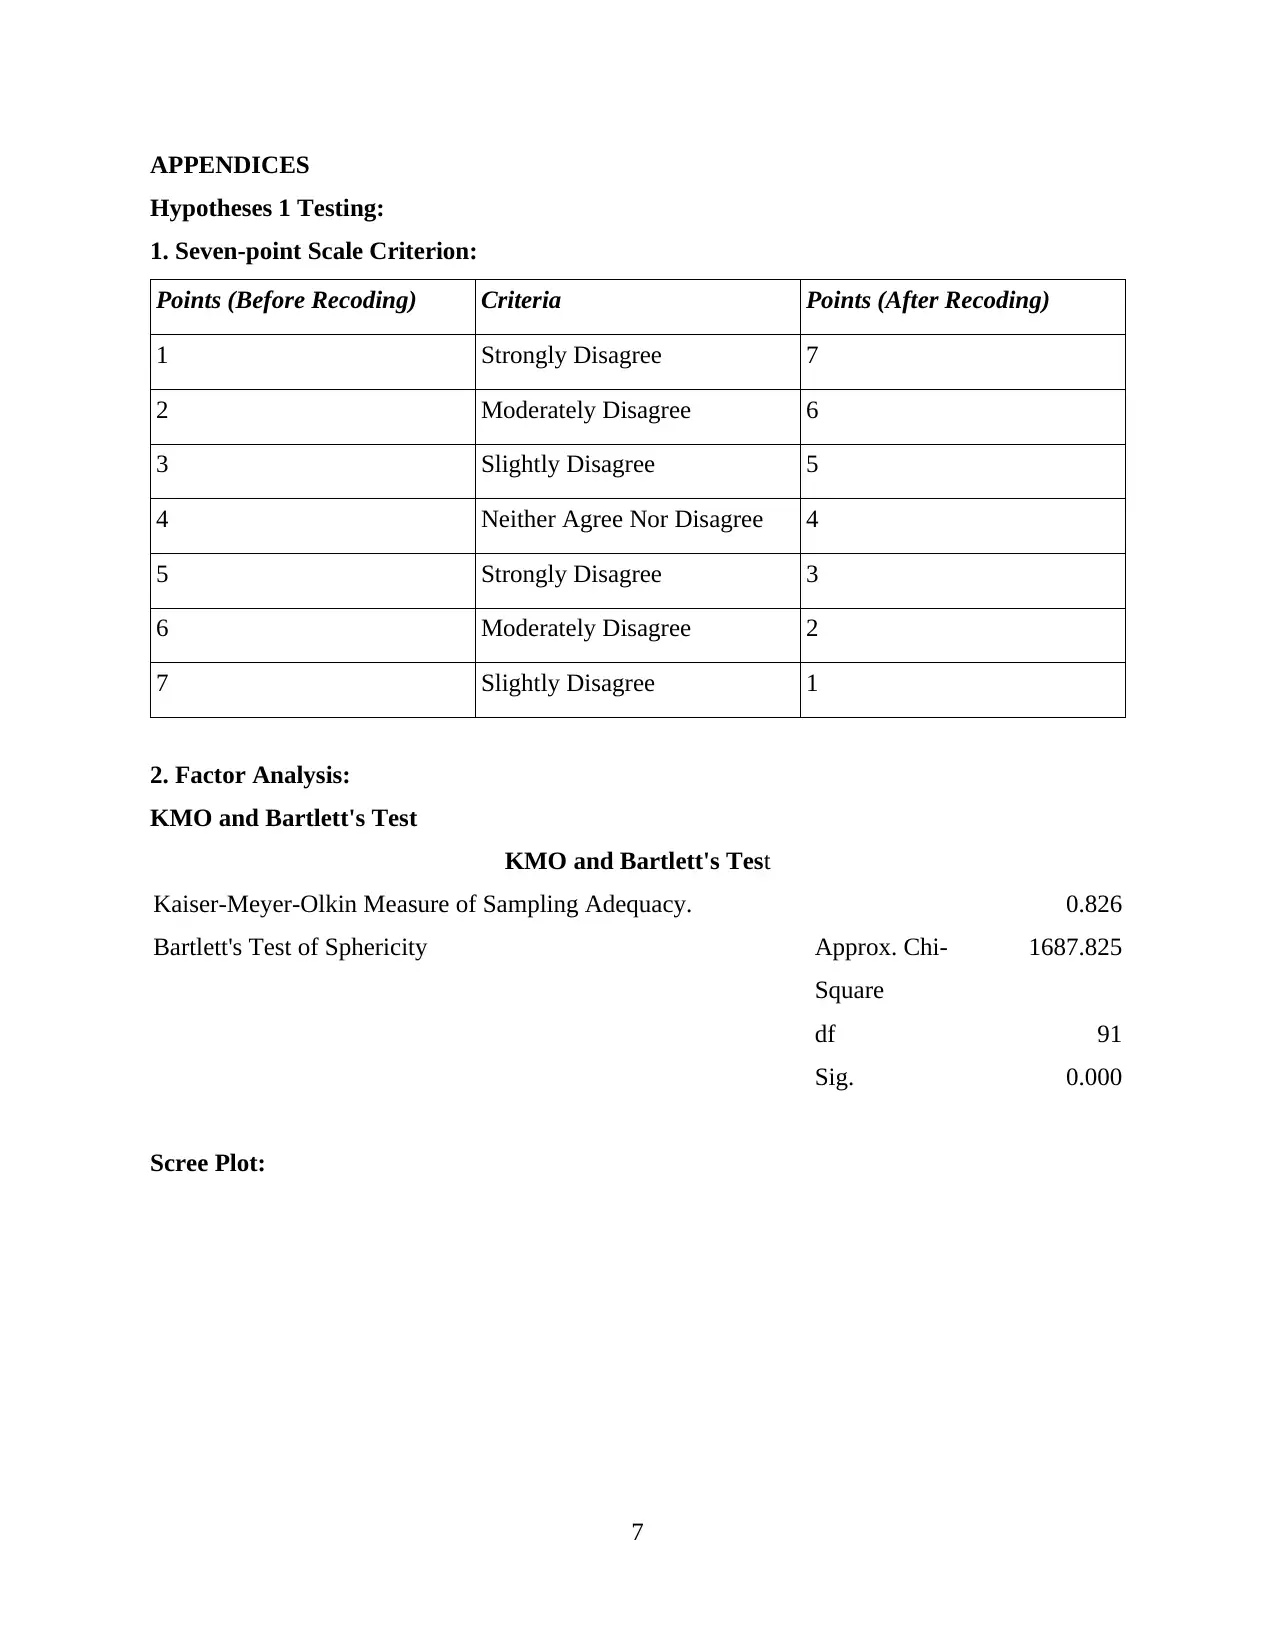
APPENDICES
Hypotheses 1 Testing:
1. Seven-point Scale Criterion:
Points (Before Recoding) Criteria Points (After Recoding)
1 Strongly Disagree 7
2 Moderately Disagree 6
3 Slightly Disagree 5
4 Neither Agree Nor Disagree 4
5 Strongly Disagree 3
6 Moderately Disagree 2
7 Slightly Disagree 1
2. Factor Analysis:
KMO and Bartlett's Test
KMO and Bartlett's Test
Kaiser-Meyer-Olkin Measure of Sampling Adequacy. 0.826
Bartlett's Test of Sphericity Approx. Chi-
Square
1687.825
df 91
Sig. 0.000
Scree Plot:
7
⊘ This is a preview!⊘
Do you want full access?
Subscribe today to unlock all pages.
Trusted by 1+ million students worldwide
Pattern Matrix:
Pattern MatrixaPattern Matrixa
Component
1 2 3
UWA deserves my loyalty 0.804
I would feel guilty if I left UWA now 0.788
I owe a great deal to UWA 0.747
I would not leave UWA right now because I
have a sense of obligation to the people in it
0.690
Even if it were to my advantage, I do not feel it
would be right to leave UWA now
0.672
I do not feel "emotionally attached" to UWA -0.899
I do not feel like "part of the family" at UWA -0.892
I do not feel a strong sense of "belonging" to
UWA
-0.823
UWA has a great deal of personal meaning for
me
0.285 0.584
8
Paraphrase This Document
Need a fresh take? Get an instant paraphrase of this document with our AI Paraphraser
It would be very hard for me to leave UWA
right now, even if I wanted to
0.810
I feel that I have too few options to consider
leaving UWA
0.748
Right now, staying at UWA is a matter of
necessity as much as desire
0.742
Too much of my life would be disrupted if I
decided I wanted to leave UWA now
0.725
One of the few negative consequences of
leaving UWA would be the scarcity of available
alternatives
0.537
Extraction Method: Principal Component
Analysis.
Rotation Method: Oblimin with Kaiser
Normalization.
a. Rotation converged in 6 iterations. Normative
Commitment
Affective
Commitment
Continuance
Commitment
Hypotheses 2 Testing:
3. Checking if Hypothesis Works:
Model Summary
Model R
R
Square
Adjusted
R
Square
Std.
Error of
the
Estimate
Change
Statistics
R
Square
Change
F
Change df1 df2
Sig. F
Change
1 0.36a 0.132 0.113 19.4630
3
0.132 6.687 6 263 0.000
a. Predictors: (Constant), How many hours per week do you work in a job outside university?,
9
TConscientiousness, Continuance Commitment score, TExtraversion, Affective Commitment
score, Normative Commitment score.
b. Dependent Variable: Time spent in university
Coefficients
Model
Stand
ardize
d
Coeffi
cients t Sig.
Correl
ations
Colline
arity
Statisti
cs
Beta
Zero-
order Partial Part
Tolera
nce VIF
1 (Const
ant)
67.876 7.047 9.632 0.000
TCons
cientio
usness
0.312 0.357 0.053 0.874 0.383 0.055 0.054 0.050 0.902 1.109
TExtra
version
-0.758 0.264 -0.171 -2.871 0.004 -0.184 -0.174 -0.165 0.925 1.082
Norma
tive
Comm
itment
score
1.439 1.357 0.070 1.060 0.290 0.108 0.065 0.061 0.765 1.308
Affecti
ve
Comm
itment
score
1.885 1.281 0.091 1.472 0.142 0.061 0.090 0.085 0.859 1.165
Contin
uance
0.530 1.310 0.026 0.405 0.686 -0.007 0.025 0.023 0.821 1.218
10
⊘ This is a preview!⊘
Do you want full access?
Subscribe today to unlock all pages.
Trusted by 1+ million students worldwide
1 out of 15
Related Documents


Your All-in-One AI-Powered Toolkit for Academic Success.
+13062052269
info@desklib.com
Available 24*7 on WhatsApp / Email
![[object Object]](/_next/static/media/star-bottom.7253800d.svg)
Unlock your academic potential
Copyright © 2020–2026 A2Z Services. All Rights Reserved. Developed and managed by ZUCOL.