Statistics Assignment: Analyzing Sports Data Using SPSS Statistics

Verified

Added on  2020/07/23

|35
|5684
|57
Homework Assignment
AI Summary
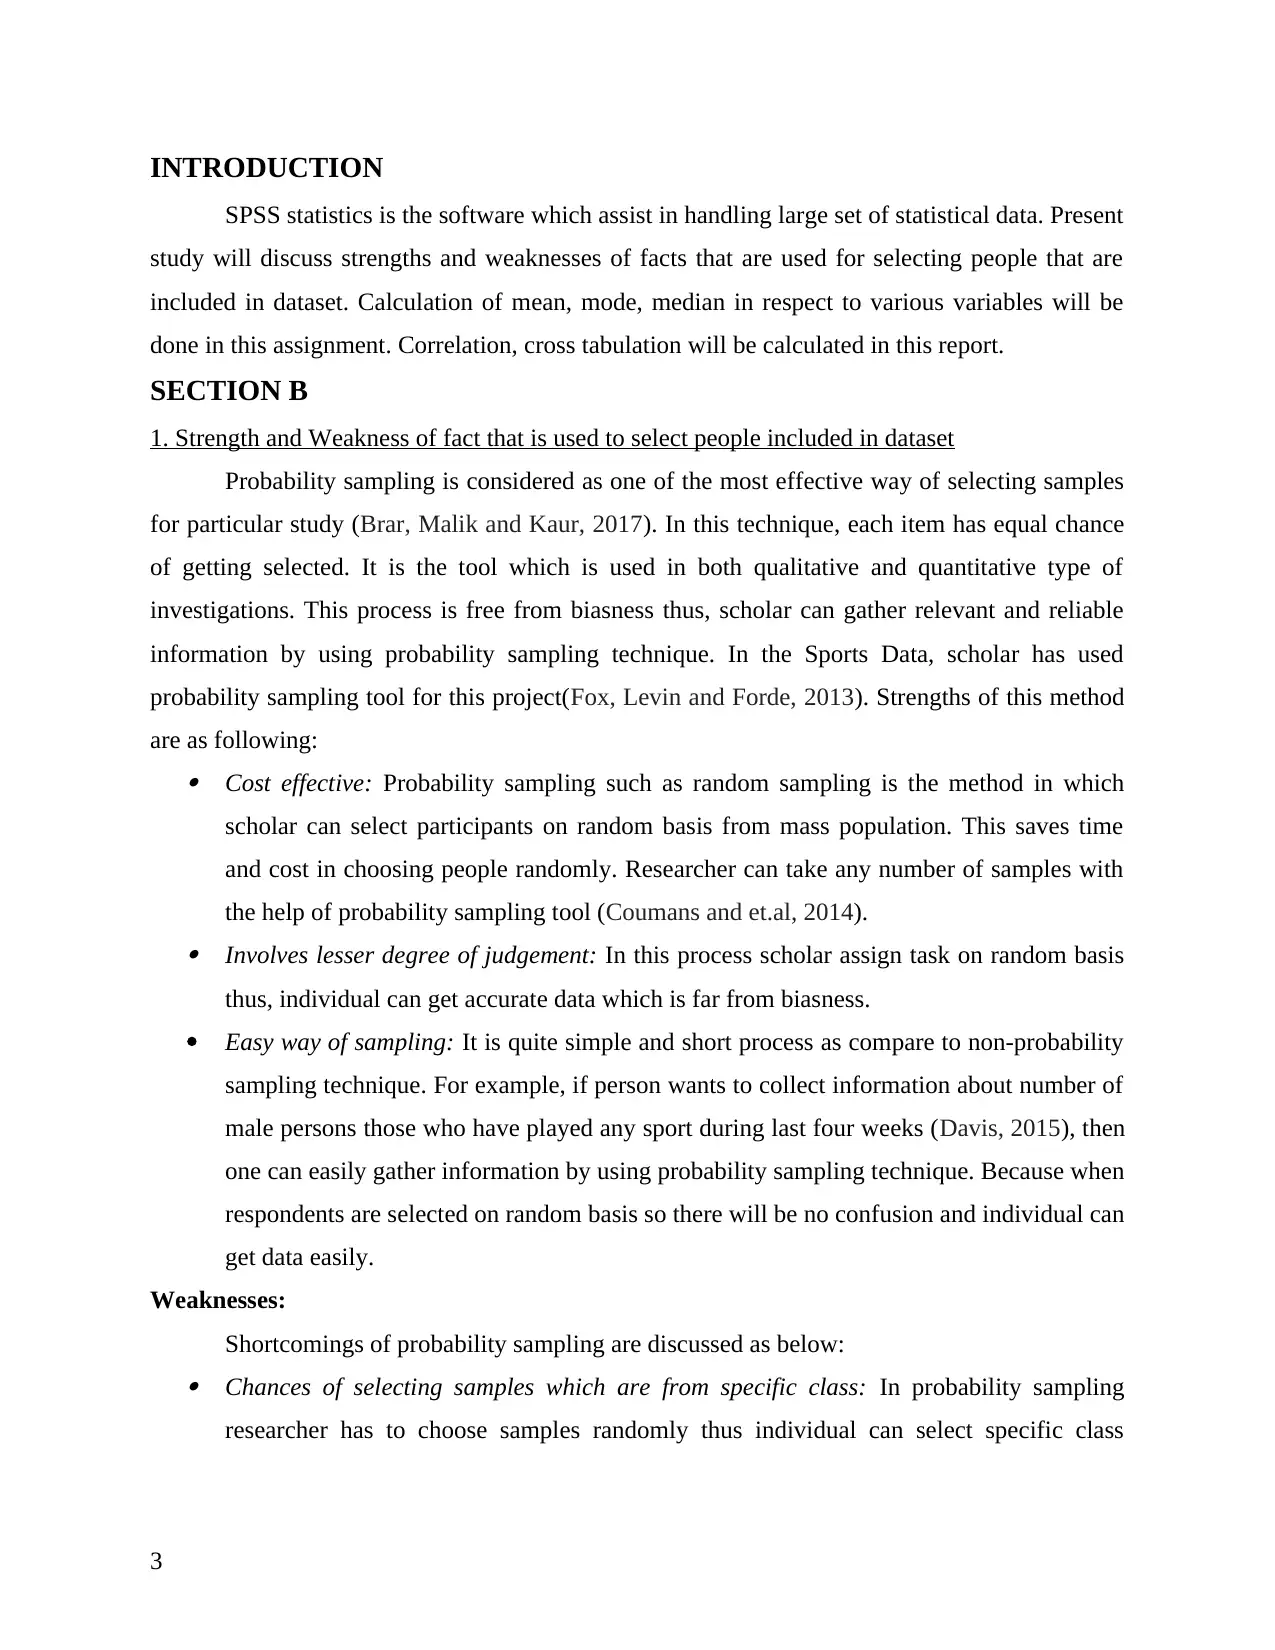
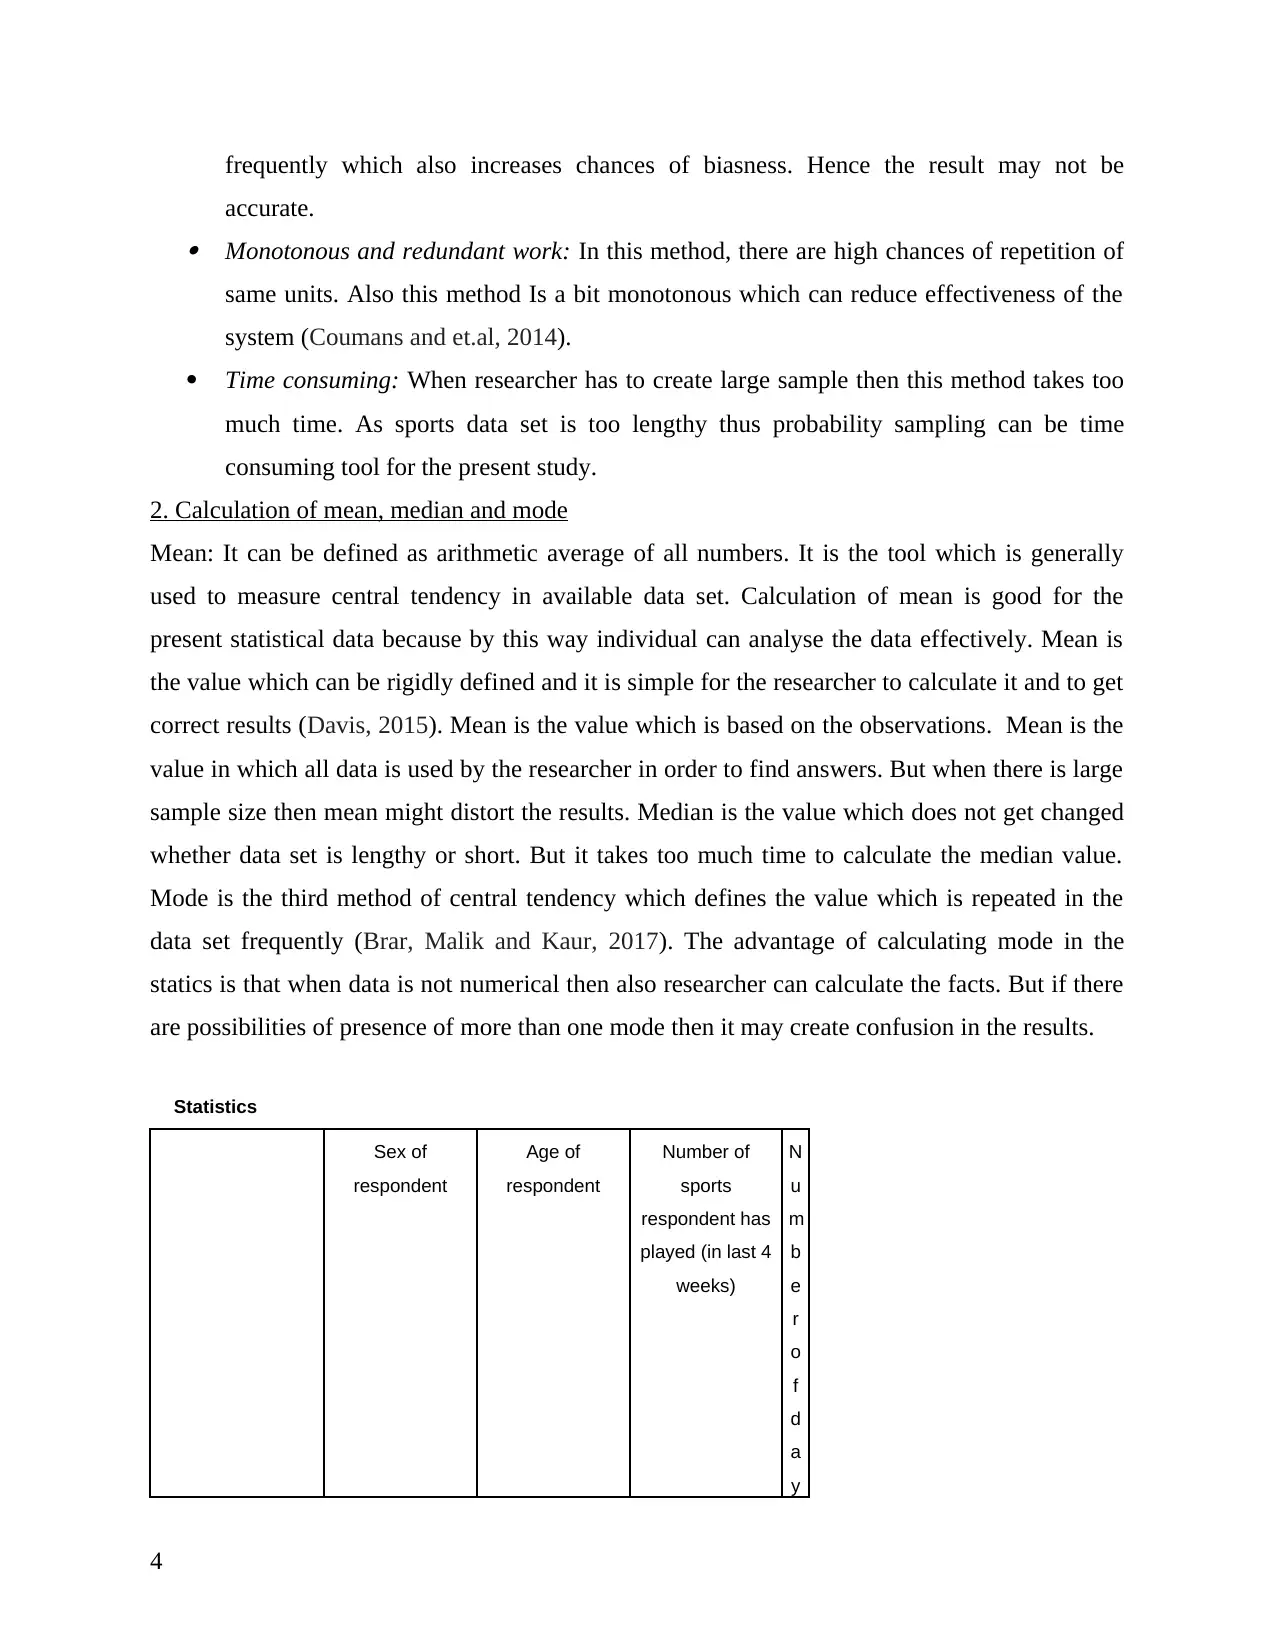
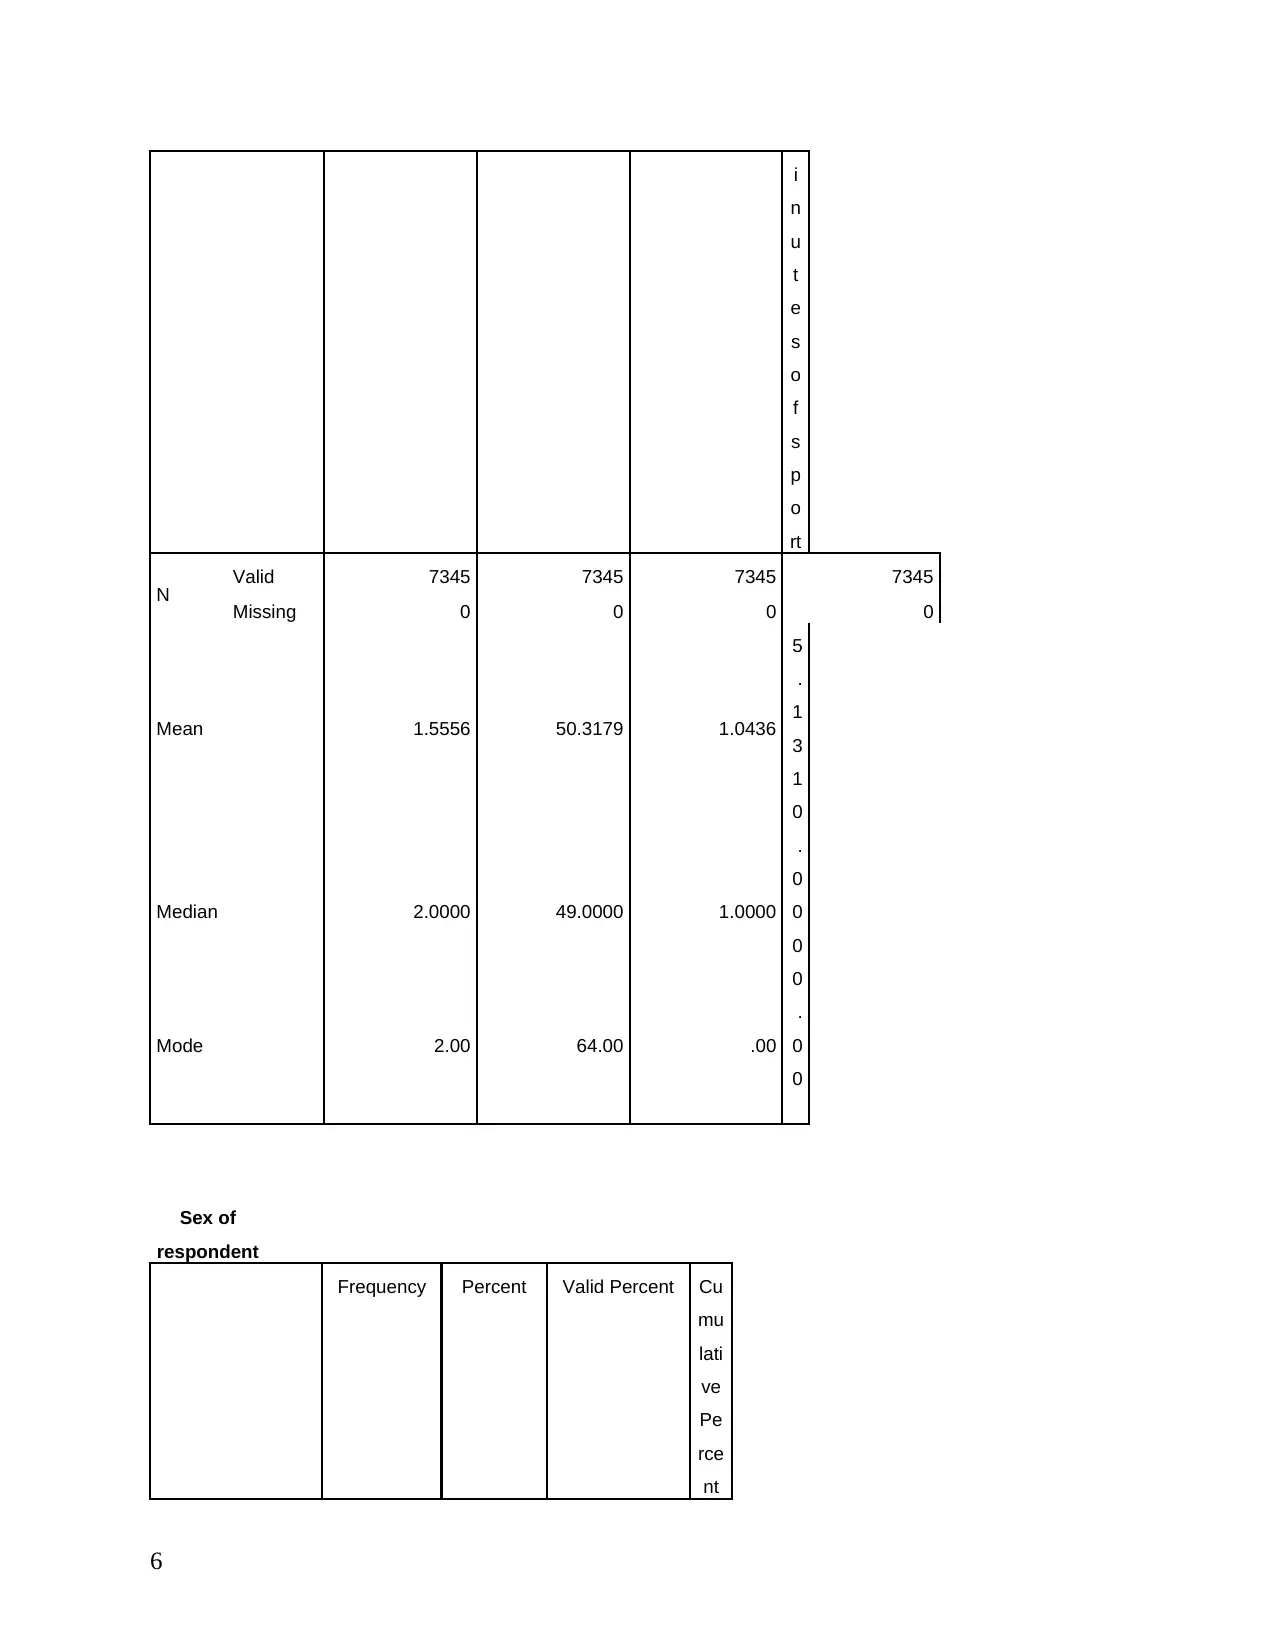
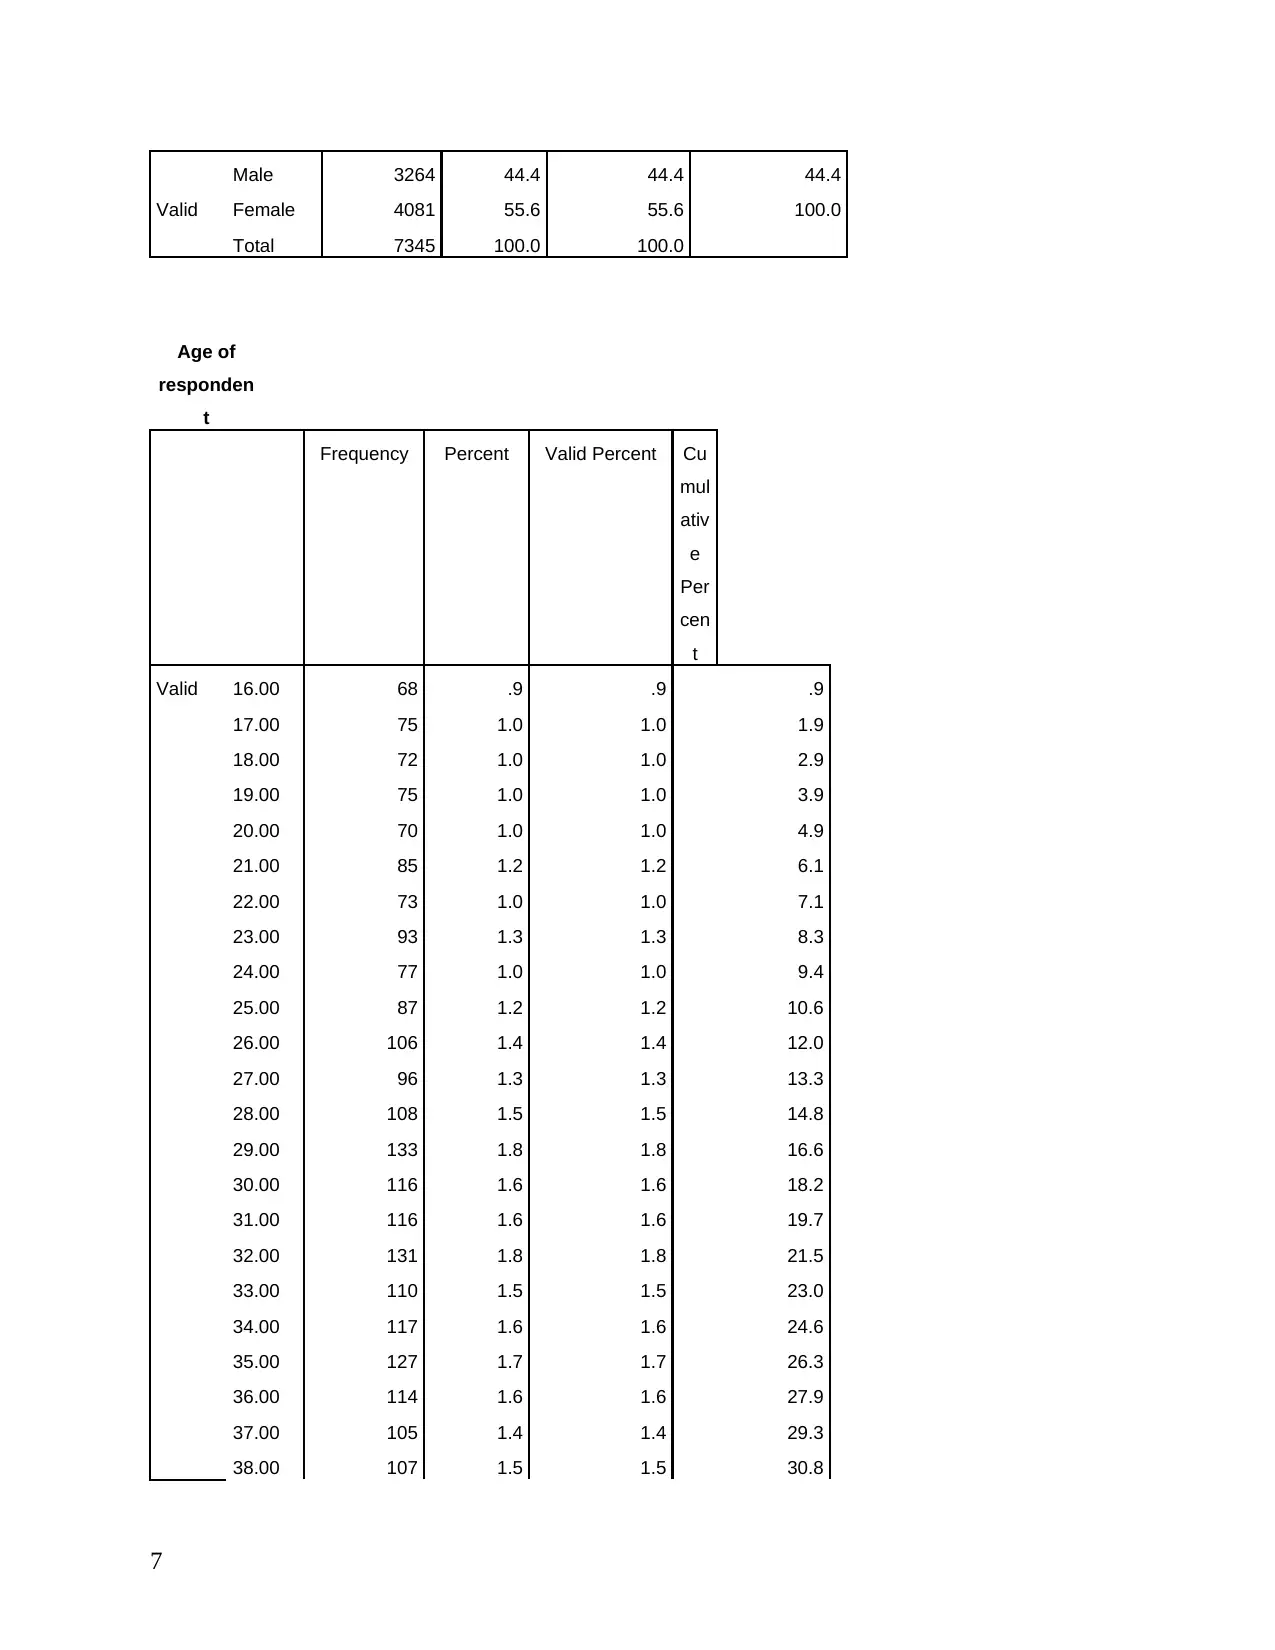
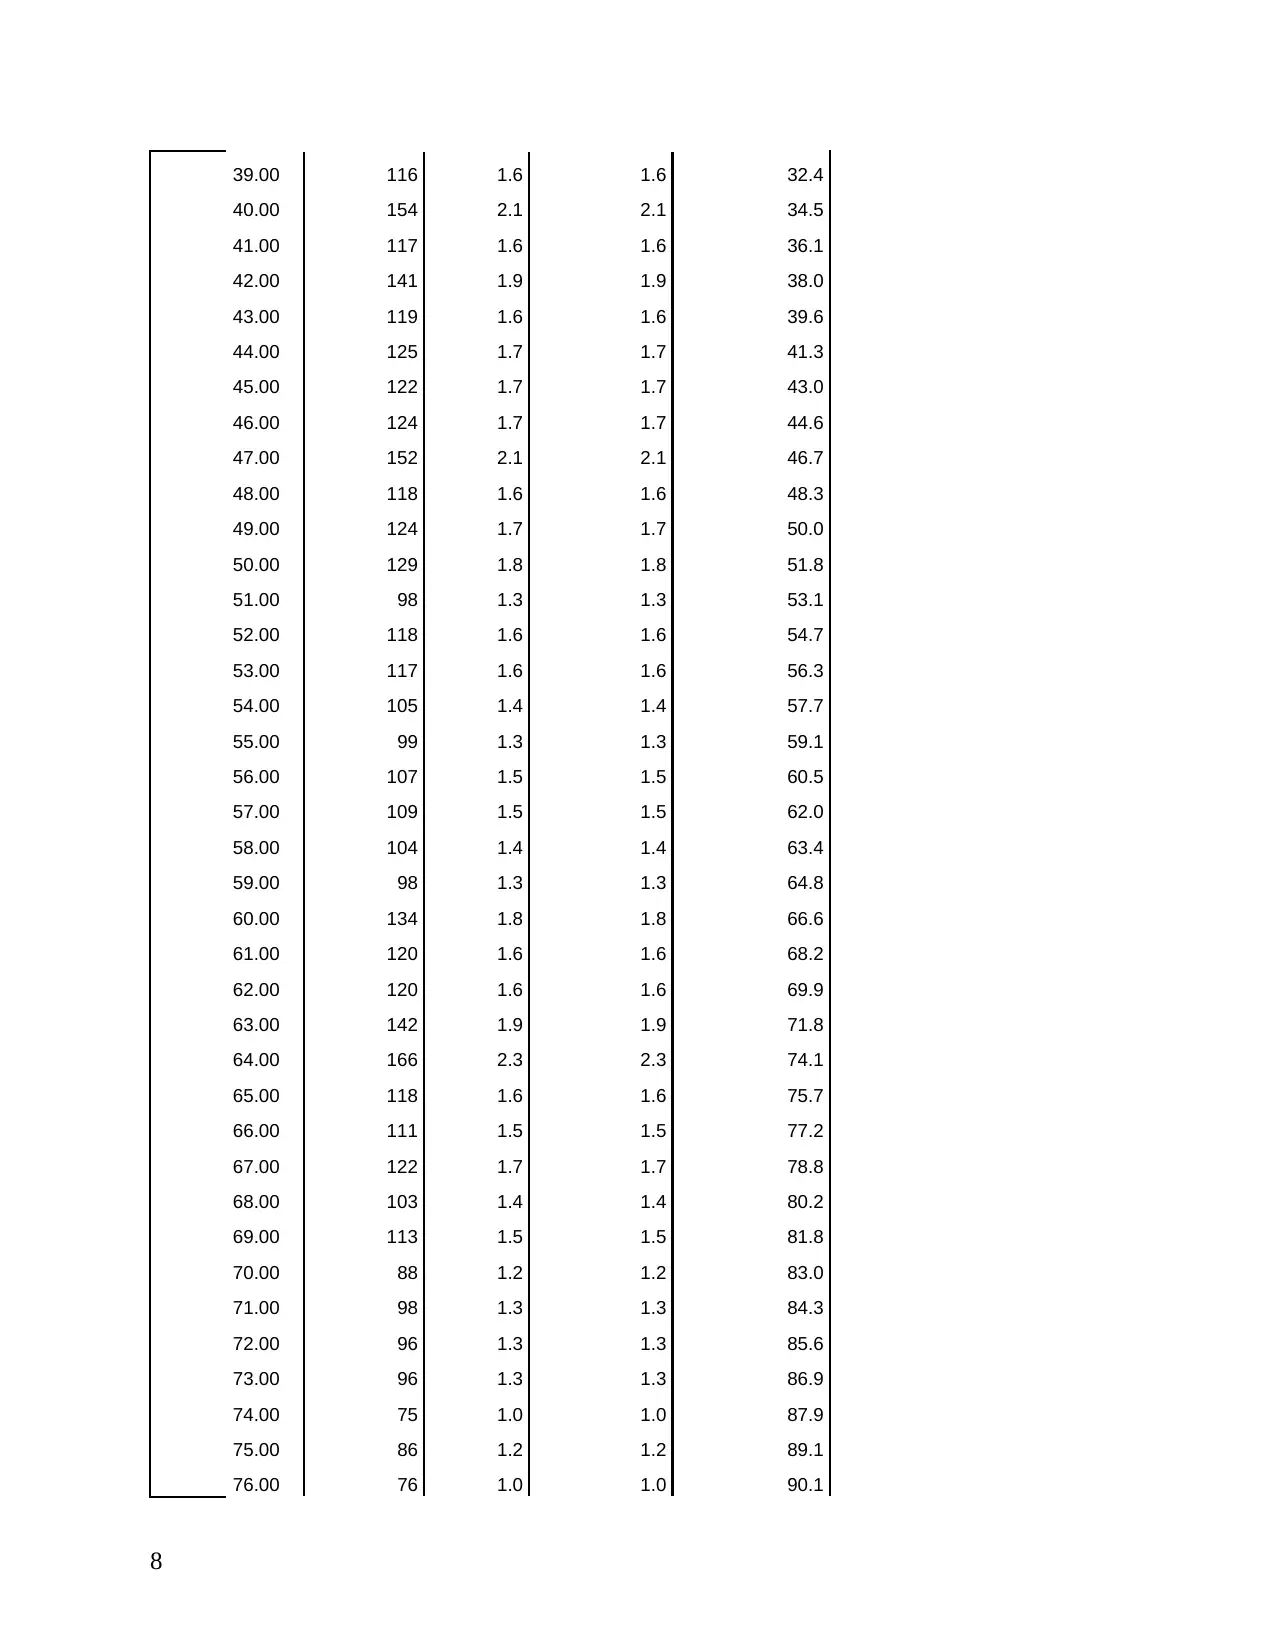
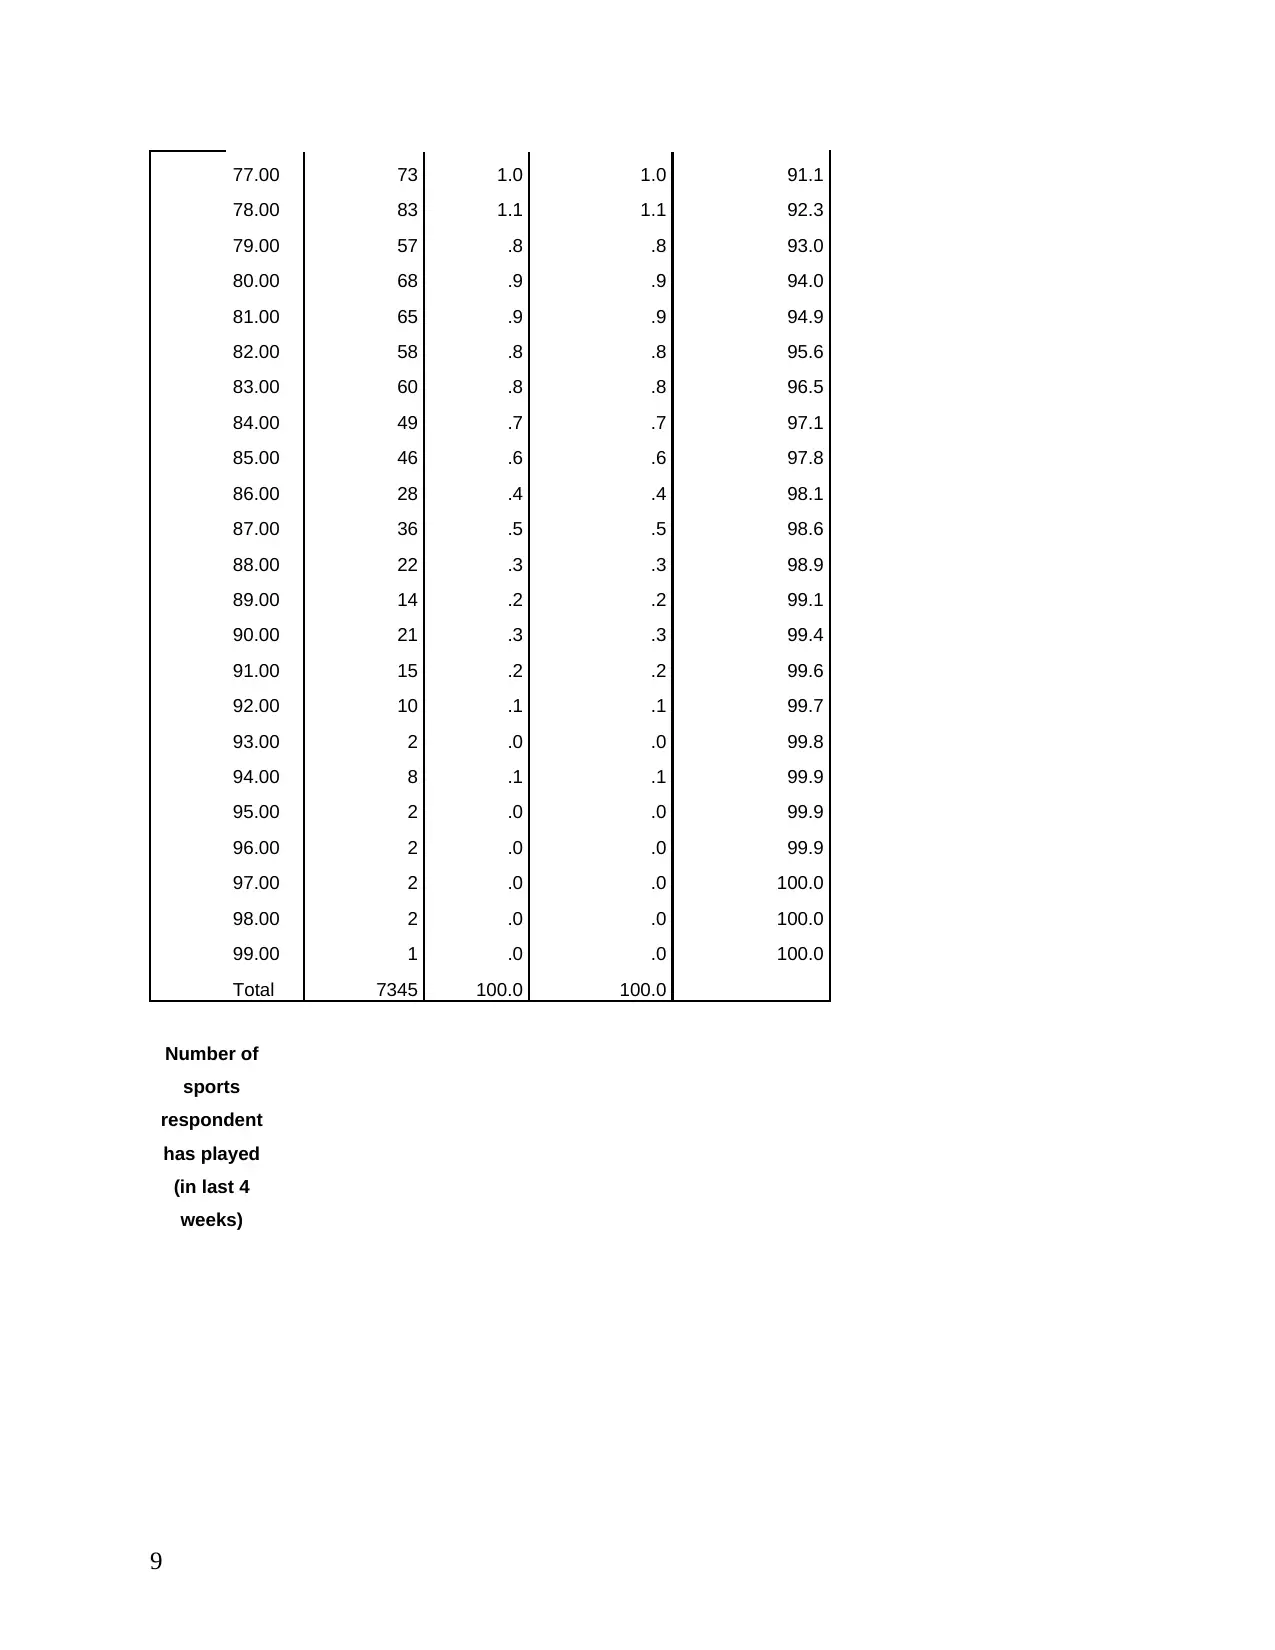
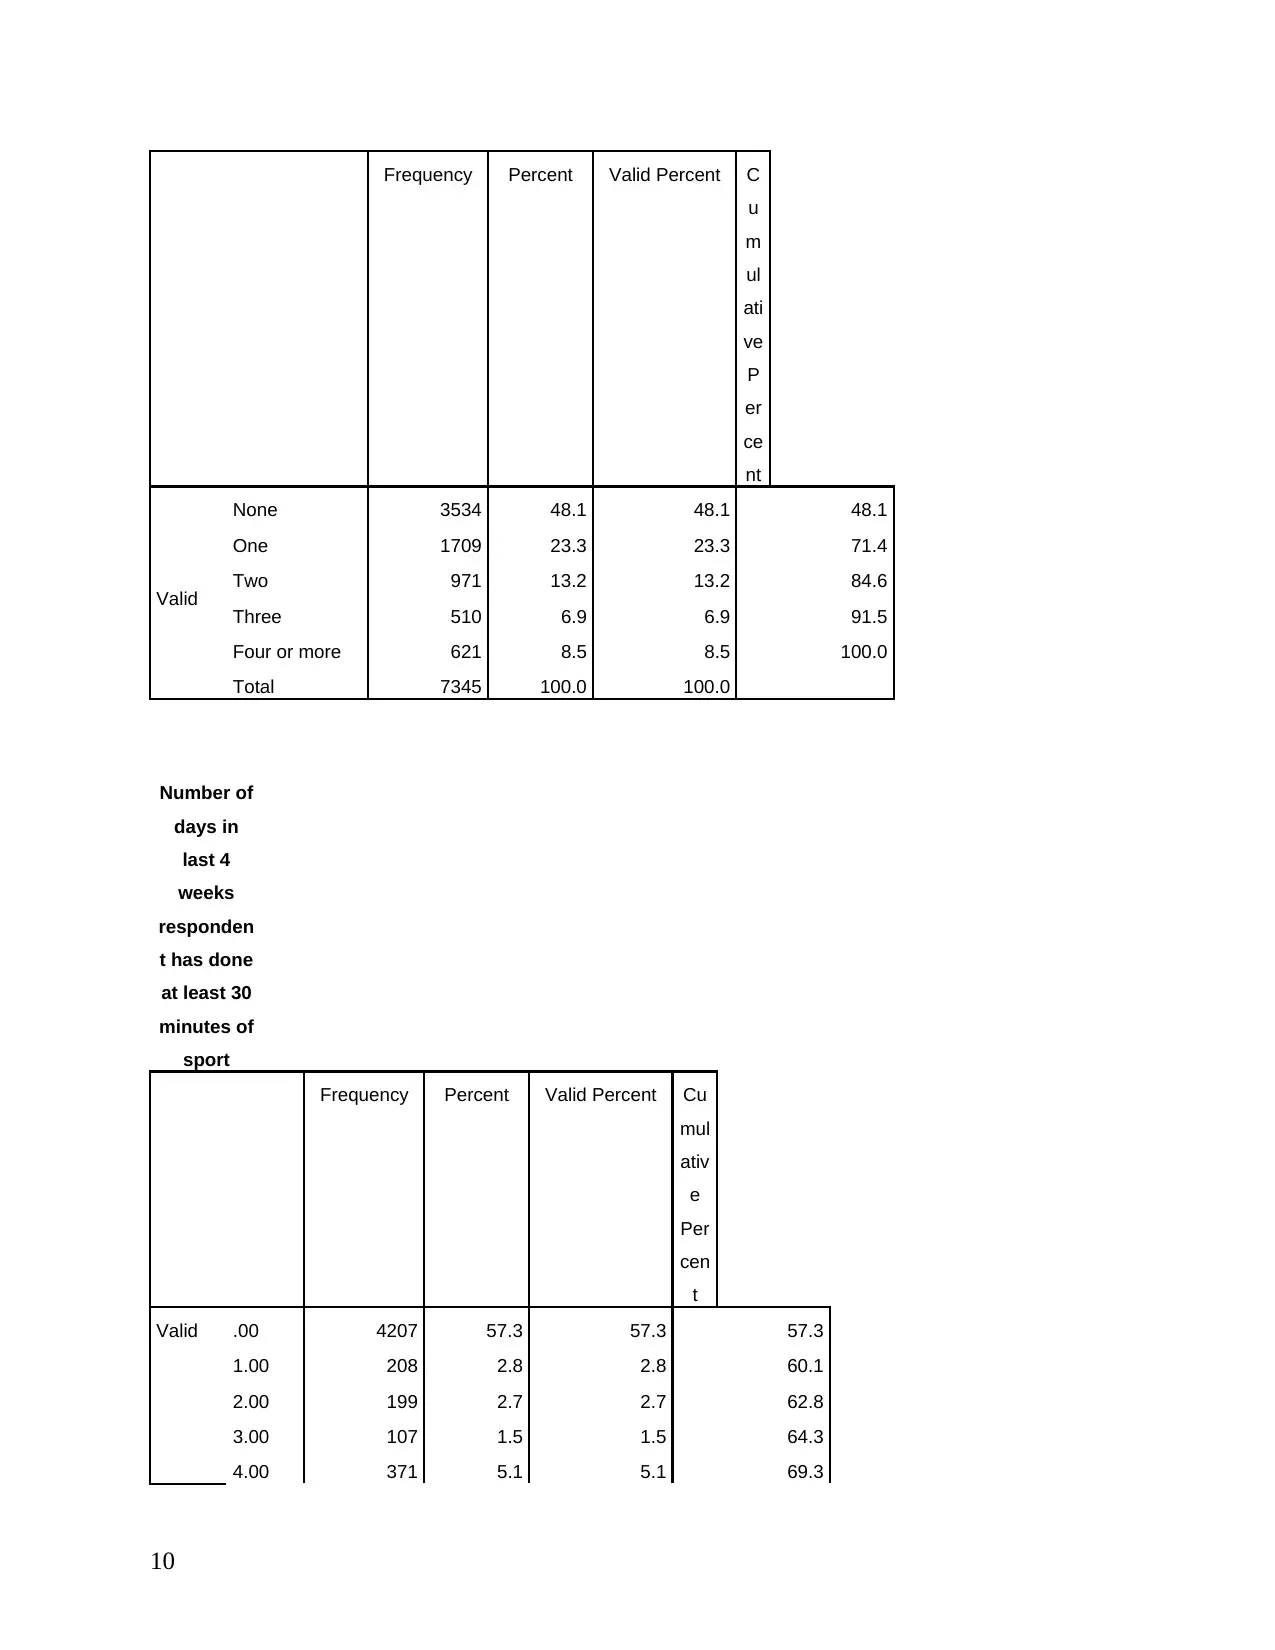
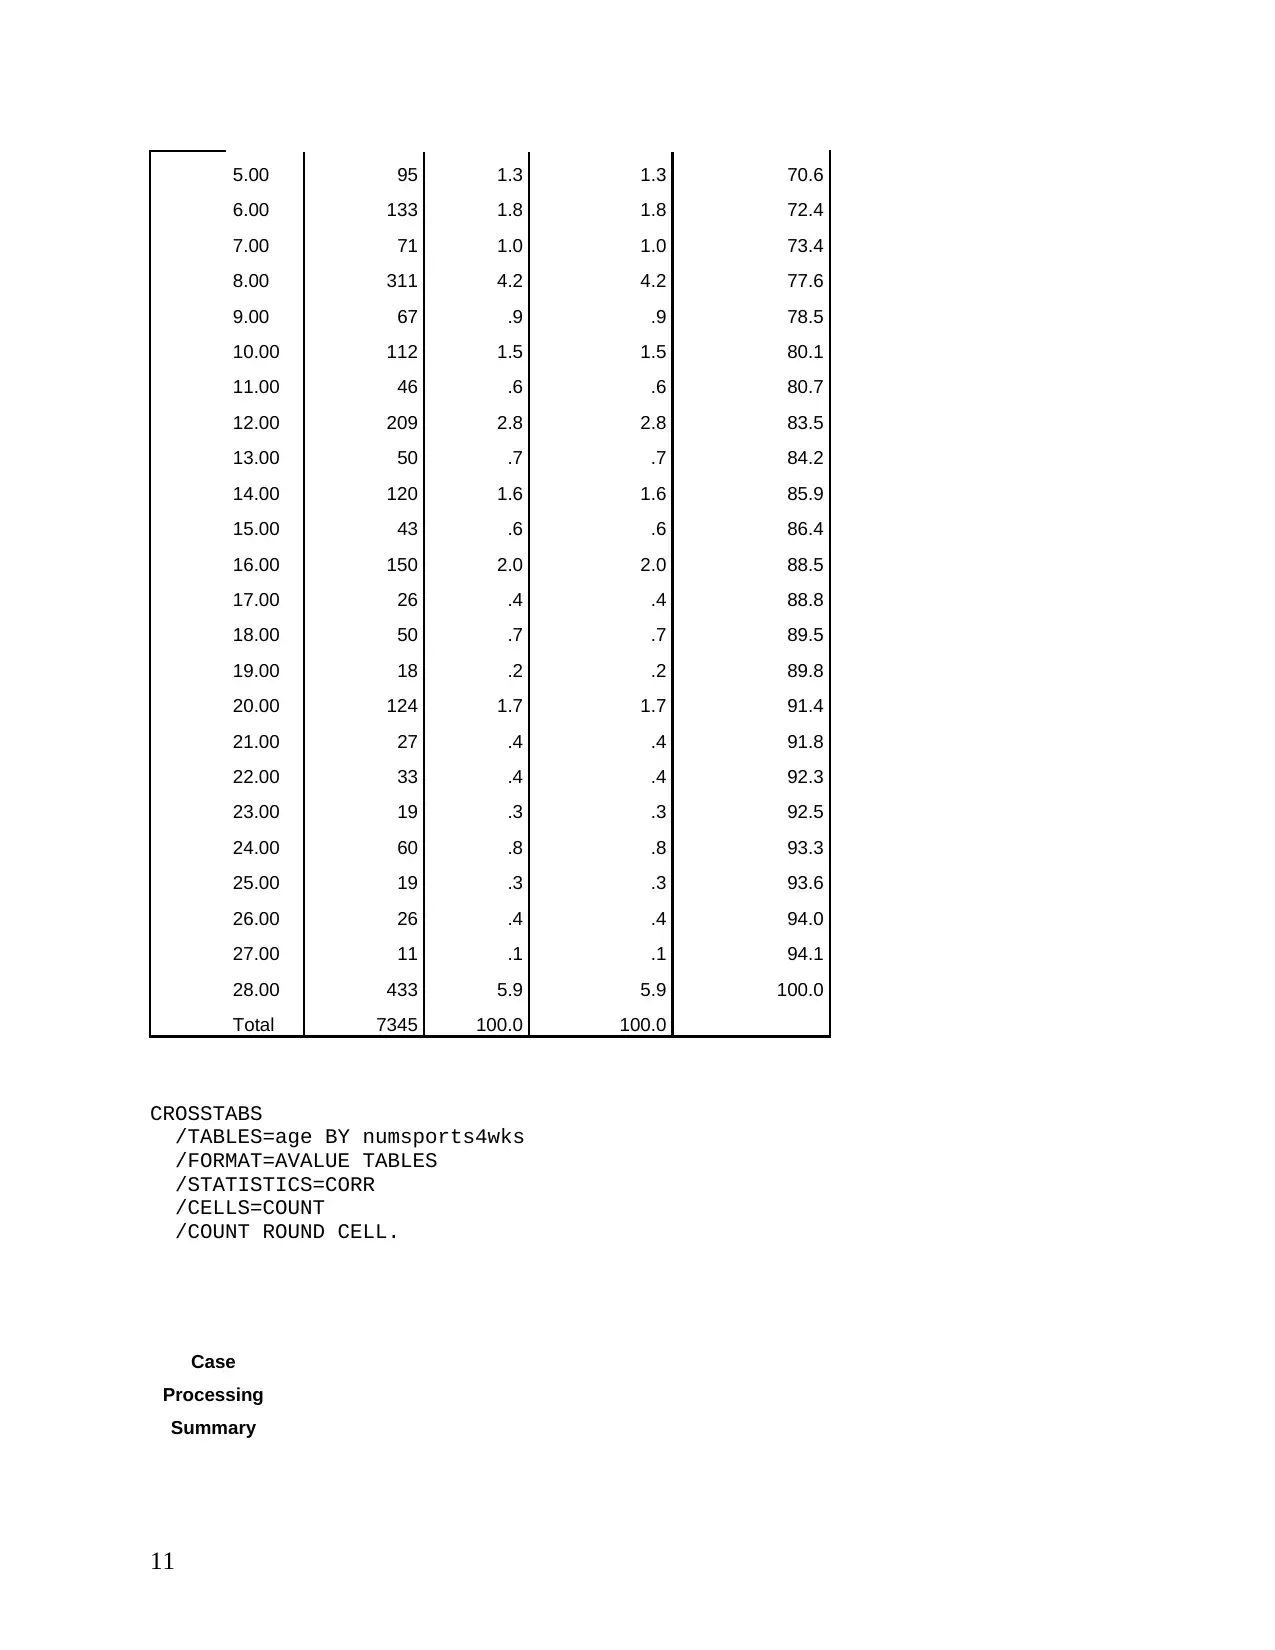
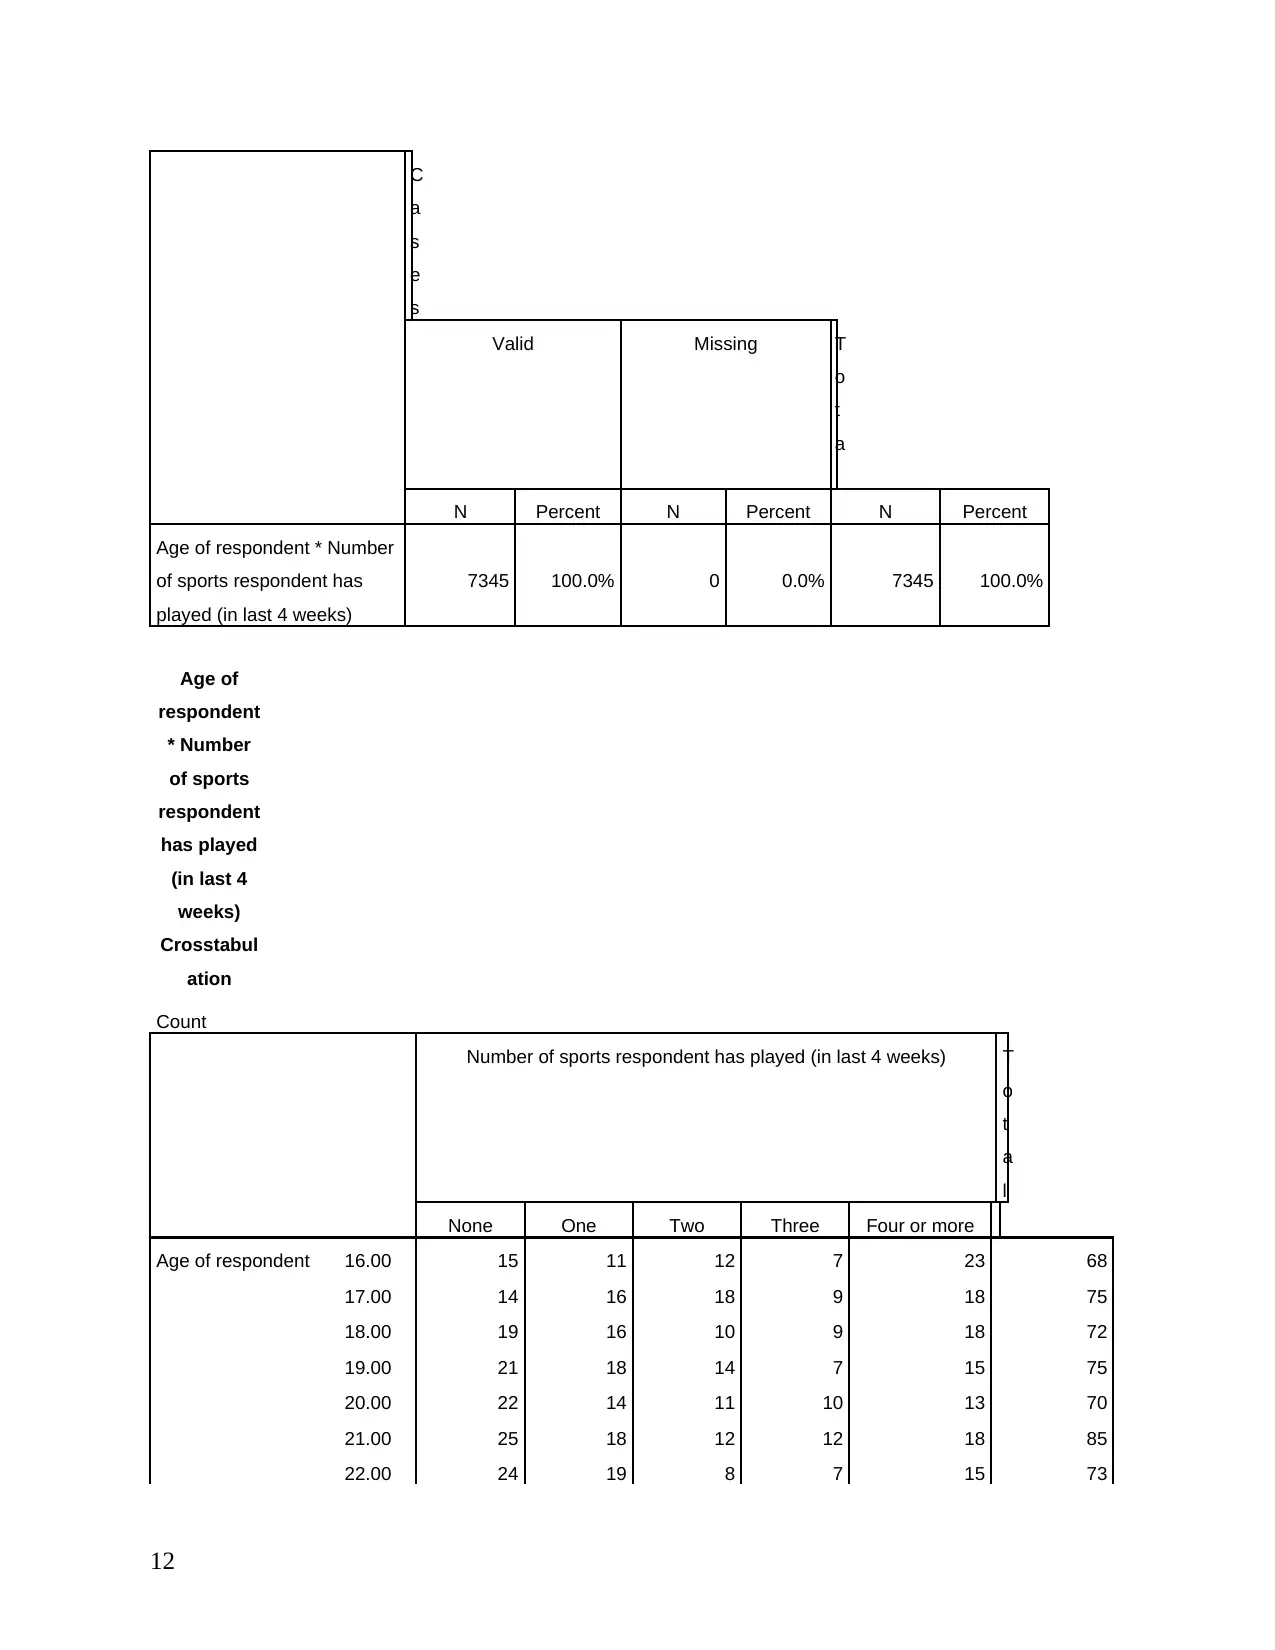
This assignment delves into statistical analysis using SPSS software, focusing on a sports dataset. It begins by discussing the strengths and weaknesses of probability sampling, a method used to select participants, highlighting its cost-effectiveness and reduced bias while acknowledging potential limitations. The assignment then proceeds to calculate and interpret key statistical measures including mean, median, and mode for various variables within the dataset, such as age and gender of respondents and number of sports played. Furthermore, the report includes the calculation of cross-tabulation and correlation to explore relationships between different variables. The analysis provides a comprehensive overview of the data, offering valuable insights into the characteristics and behaviors of the respondents. The assignment is designed to demonstrate understanding of statistical techniques and their application in real-world scenarios, as well as the use of SPSS for statistical data processing.
Document Page
INTRODUCTION TO RESEARCH:
STATISTICS ASSIGNMENT
tabler-icon-diamond-filled.svg

Paraphrase This Document

Need a fresh take? Get an instant paraphrase of this document with our AI Paraphraser
Document Page
Table of Contents
INTRODUCTION...........................................................................................................................3
SECTION B.....................................................................................................................................3
1. Strength and Weakness of fact that is used to select people included in dataset....................3
2. Calculation of mean, median and mode..................................................................................4
3. Calculation of cross tabulation, correlation..........................................................................28
CONCLUSION..............................................................................................................................29
REFERENCES..............................................................................................................................30
Document Page
INTRODUCTION
SPSS statistics is the software which assist in handling large set of statistical data. Present
study will discuss strengths and weaknesses of facts that are used for selecting people that are
included in dataset. Calculation of mean, mode, median in respect to various variables will be
done in this assignment. Correlation, cross tabulation will be calculated in this report.
SECTION B
1. Strength and Weakness of fact that is used to select people included in dataset
Probability sampling is considered as one of the most effective way of selecting samples
for particular study (Brar, Malik and Kaur, 2017). In this technique, each item has equal chance
of getting selected. It is the tool which is used in both qualitative and quantitative type of
investigations. This process is free from biasness thus, scholar can gather relevant and reliable
information by using probability sampling technique. In the Sports Data, scholar has used
probability sampling tool for this project(Fox, Levin and Forde, 2013). Strengths of this method
are as following:ï‚· Cost effective: Probability sampling such as random sampling is the method in which
scholar can select participants on random basis from mass population. This saves time
and cost in choosing people randomly. Researcher can take any number of samples with
the help of probability sampling tool (Coumans and et.al, 2014).ï‚· Involves lesser degree of judgement: In this process scholar assign task on random basis
thus, individual can get accurate data which is far from biasness.
ï‚· Easy way of sampling: It is quite simple and short process as compare to non-probability
sampling technique. For example, if person wants to collect information about number of
male persons those who have played any sport during last four weeks (Davis, 2015), then
one can easily gather information by using probability sampling technique. Because when
respondents are selected on random basis so there will be no confusion and individual can
get data easily.
Weaknesses:
Shortcomings of probability sampling are discussed as below:ï‚· Chances of selecting samples which are from specific class: In probability sampling
researcher has to choose samples randomly thus individual can select specific class
3
Document Page
frequently which also increases chances of biasness. Hence the result may not be
accurate.ï‚· Monotonous and redundant work: In this method, there are high chances of repetition of
same units. Also this method Is a bit monotonous which can reduce effectiveness of the
system (Coumans and et.al, 2014).
ï‚· Time consuming: When researcher has to create large sample then this method takes too
much time. As sports data set is too lengthy thus probability sampling can be time
consuming tool for the present study.
2. Calculation of mean, median and mode
Mean: It can be defined as arithmetic average of all numbers. It is the tool which is generally
used to measure central tendency in available data set. Calculation of mean is good for the
present statistical data because by this way individual can analyse the data effectively. Mean is
the value which can be rigidly defined and it is simple for the researcher to calculate it and to get
correct results (Davis, 2015). Mean is the value which is based on the observations. Mean is the
value in which all data is used by the researcher in order to find answers. But when there is large
sample size then mean might distort the results. Median is the value which does not get changed
whether data set is lengthy or short. But it takes too much time to calculate the median value.
Mode is the third method of central tendency which defines the value which is repeated in the
data set frequently (Brar, Malik and Kaur, 2017). The advantage of calculating mode in the
statics is that when data is not numerical then also researcher can calculate the facts. But if there
are possibilities of presence of more than one mode then it may create confusion in the results.
Statistics
Sex of
respondent
Age of
respondent
Number of
sports
respondent has
played (in last 4
weeks)
N
u
m
b
e
r
o
f
d
a
y
4
tabler-icon-diamond-filled.svg

Paraphrase This Document

Need a fresh take? Get an instant paraphrase of this document with our AI Paraphraser
Document Page
s
i
n
l
a
s
t
4
w
e
e
k
s
r
e
s
p
o
n
d
e
n
t
h
a
s
d
o
n
e
a
t
l
e
a
s
t
3
0
m
5
Document Page
i
n
u
t
e
s
o
f
s
p
o
rt
N Valid 7345 7345 7345 7345
Missing 0 0 0 0
Mean 1.5556 50.3179 1.0436
5
.
1
3
1
0
Median 2.0000 49.0000 1.0000
.
0
0
0
0
Mode 2.00 64.00 .00
.
0
0
Sex of
respondent
Frequency Percent Valid Percent Cu
mu
lati
ve
Pe
rce
nt
6
Document Page
Valid
Male 3264 44.4 44.4 44.4
Female 4081 55.6 55.6 100.0
Total 7345 100.0 100.0
Age of
responden
t
Frequency Percent Valid Percent Cu
mul
ativ
e
Per
cen
t
Valid 16.00 68 .9 .9 .9
17.00 75 1.0 1.0 1.9
18.00 72 1.0 1.0 2.9
19.00 75 1.0 1.0 3.9
20.00 70 1.0 1.0 4.9
21.00 85 1.2 1.2 6.1
22.00 73 1.0 1.0 7.1
23.00 93 1.3 1.3 8.3
24.00 77 1.0 1.0 9.4
25.00 87 1.2 1.2 10.6
26.00 106 1.4 1.4 12.0
27.00 96 1.3 1.3 13.3
28.00 108 1.5 1.5 14.8
29.00 133 1.8 1.8 16.6
30.00 116 1.6 1.6 18.2
31.00 116 1.6 1.6 19.7
32.00 131 1.8 1.8 21.5
33.00 110 1.5 1.5 23.0
34.00 117 1.6 1.6 24.6
35.00 127 1.7 1.7 26.3
36.00 114 1.6 1.6 27.9
37.00 105 1.4 1.4 29.3
38.00 107 1.5 1.5 30.8
7
tabler-icon-diamond-filled.svg

Paraphrase This Document

Need a fresh take? Get an instant paraphrase of this document with our AI Paraphraser
Document Page
39.00 116 1.6 1.6 32.4
40.00 154 2.1 2.1 34.5
41.00 117 1.6 1.6 36.1
42.00 141 1.9 1.9 38.0
43.00 119 1.6 1.6 39.6
44.00 125 1.7 1.7 41.3
45.00 122 1.7 1.7 43.0
46.00 124 1.7 1.7 44.6
47.00 152 2.1 2.1 46.7
48.00 118 1.6 1.6 48.3
49.00 124 1.7 1.7 50.0
50.00 129 1.8 1.8 51.8
51.00 98 1.3 1.3 53.1
52.00 118 1.6 1.6 54.7
53.00 117 1.6 1.6 56.3
54.00 105 1.4 1.4 57.7
55.00 99 1.3 1.3 59.1
56.00 107 1.5 1.5 60.5
57.00 109 1.5 1.5 62.0
58.00 104 1.4 1.4 63.4
59.00 98 1.3 1.3 64.8
60.00 134 1.8 1.8 66.6
61.00 120 1.6 1.6 68.2
62.00 120 1.6 1.6 69.9
63.00 142 1.9 1.9 71.8
64.00 166 2.3 2.3 74.1
65.00 118 1.6 1.6 75.7
66.00 111 1.5 1.5 77.2
67.00 122 1.7 1.7 78.8
68.00 103 1.4 1.4 80.2
69.00 113 1.5 1.5 81.8
70.00 88 1.2 1.2 83.0
71.00 98 1.3 1.3 84.3
72.00 96 1.3 1.3 85.6
73.00 96 1.3 1.3 86.9
74.00 75 1.0 1.0 87.9
75.00 86 1.2 1.2 89.1
76.00 76 1.0 1.0 90.1
8
Document Page
77.00 73 1.0 1.0 91.1
78.00 83 1.1 1.1 92.3
79.00 57 .8 .8 93.0
80.00 68 .9 .9 94.0
81.00 65 .9 .9 94.9
82.00 58 .8 .8 95.6
83.00 60 .8 .8 96.5
84.00 49 .7 .7 97.1
85.00 46 .6 .6 97.8
86.00 28 .4 .4 98.1
87.00 36 .5 .5 98.6
88.00 22 .3 .3 98.9
89.00 14 .2 .2 99.1
90.00 21 .3 .3 99.4
91.00 15 .2 .2 99.6
92.00 10 .1 .1 99.7
93.00 2 .0 .0 99.8
94.00 8 .1 .1 99.9
95.00 2 .0 .0 99.9
96.00 2 .0 .0 99.9
97.00 2 .0 .0 100.0
98.00 2 .0 .0 100.0
99.00 1 .0 .0 100.0
Total 7345 100.0 100.0
Number of
sports
respondent
has played
(in last 4
weeks)
9
Document Page
Frequency Percent Valid Percent C
u
m
ul
ati
ve
P
er
ce
nt
Valid
None 3534 48.1 48.1 48.1
One 1709 23.3 23.3 71.4
Two 971 13.2 13.2 84.6
Three 510 6.9 6.9 91.5
Four or more 621 8.5 8.5 100.0
Total 7345 100.0 100.0
Number of
days in
last 4
weeks
responden
t has done
at least 30
minutes of
sport
Frequency Percent Valid Percent Cu
mul
ativ
e
Per
cen
t
Valid .00 4207 57.3 57.3 57.3
1.00 208 2.8 2.8 60.1
2.00 199 2.7 2.7 62.8
3.00 107 1.5 1.5 64.3
4.00 371 5.1 5.1 69.3
10
tabler-icon-diamond-filled.svg

Paraphrase This Document

Need a fresh take? Get an instant paraphrase of this document with our AI Paraphraser
Document Page
5.00 95 1.3 1.3 70.6
6.00 133 1.8 1.8 72.4
7.00 71 1.0 1.0 73.4
8.00 311 4.2 4.2 77.6
9.00 67 .9 .9 78.5
10.00 112 1.5 1.5 80.1
11.00 46 .6 .6 80.7
12.00 209 2.8 2.8 83.5
13.00 50 .7 .7 84.2
14.00 120 1.6 1.6 85.9
15.00 43 .6 .6 86.4
16.00 150 2.0 2.0 88.5
17.00 26 .4 .4 88.8
18.00 50 .7 .7 89.5
19.00 18 .2 .2 89.8
20.00 124 1.7 1.7 91.4
21.00 27 .4 .4 91.8
22.00 33 .4 .4 92.3
23.00 19 .3 .3 92.5
24.00 60 .8 .8 93.3
25.00 19 .3 .3 93.6
26.00 26 .4 .4 94.0
27.00 11 .1 .1 94.1
28.00 433 5.9 5.9 100.0
Total 7345 100.0 100.0
CROSSTABS
/TABLES=age BY numsports4wks
/FORMAT=AVALUE TABLES
/STATISTICS=CORR
/CELLS=COUNT
/COUNT ROUND CELL.
Case
Processing
Summary
11
Document Page
C
a
s
e
s
Valid Missing T
o
t
a
l
N Percent N Percent N Percent
Age of respondent * Number
of sports respondent has
played (in last 4 weeks)
7345 100.0% 0 0.0% 7345 100.0%
Age of
respondent
* Number
of sports
respondent
has played
(in last 4
weeks)
Crosstabul
ation
Count
Number of sports respondent has played (in last 4 weeks) T
o
t
a
l
None One Two Three Four or more
Age of respondent 16.00 15 11 12 7 23 68
17.00 14 16 18 9 18 75
18.00 19 16 10 9 18 72
19.00 21 18 14 7 15 75
20.00 22 14 11 10 13 70
21.00 25 18 12 12 18 85
22.00 24 19 8 7 15 73
12
chevron_up_icon
1 out of 35
circle_padding
hide_on_mobile
zoom_out_icon
[object Object]