SPSS Analysis of Business Research Methods: A Comprehensive Report
VerifiedAdded on 2023/01/11
|16
|3496
|78
Report
AI Summary
This report presents an analysis of business research methods using SPSS, focusing on the relationship between entrepreneurial intention and personality traits. The study explores the concept of entrepreneurship, evaluates five key personality traits, and determines their impact on entrepreneurial intention. It includes frequency tables for demographic profiles, binomial tests for purchase intention, reliability tests for WOM credibility, and ANOVA analyses to examine the influence of gender and buying frequency. Chi-square tests are used to assess the association between customer demographics and homophily item scores. The research utilizes a questionnaire to gather data and employs statistical methods to interpret the findings, providing insights into consumer behavior and entrepreneurial tendencies. The report includes detailed SPSS outputs and interpretations, offering a comprehensive overview of the research process and outcomes.

Business Research Methods-
SPSS
1
SPSS
1
Paraphrase This Document
Need a fresh take? Get an instant paraphrase of this document with our AI Paraphraser
Contents
PART ONE......................................................................................................................................3
Review covering the key objectives of this study.......................................................................3
Arguments of positivist paradigm in this study...........................................................................3
Key concepts introduced in this study and stating the appropriate research hypotheses............4
Questionnaire...............................................................................................................................4
PART TWO.....................................................................................................................................5
Objective 1...................................................................................................................................5
Objective 2...................................................................................................................................6
Objective 3...................................................................................................................................7
Objective 4...................................................................................................................................7
Objective 5...................................................................................................................................7
Objective 6...................................................................................................................................8
Objective 7...................................................................................................................................9
Objective 8.................................................................................................................................14
REFERENCES..............................................................................................................................16
2
PART ONE
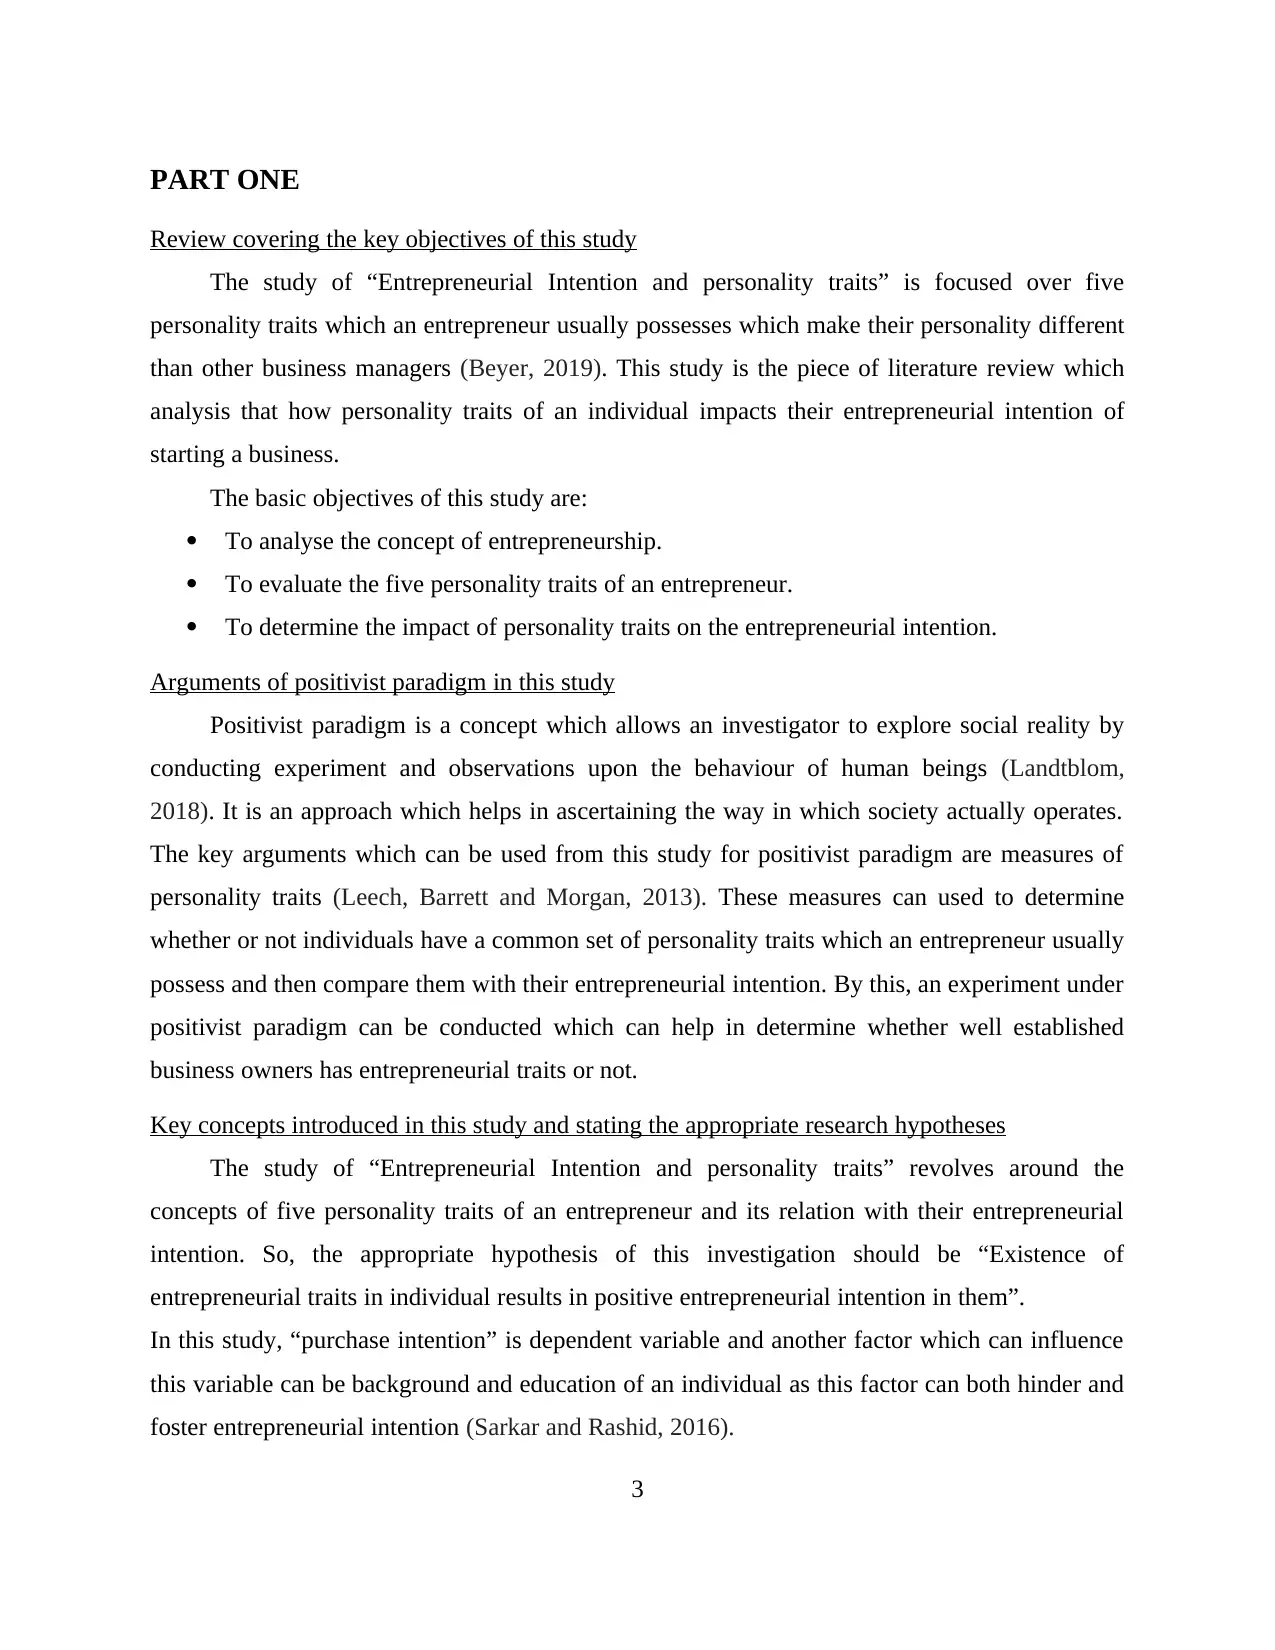
Review covering the key objectives of this study
The study of “Entrepreneurial Intention and personality traits” is focused over five
personality traits which an entrepreneur usually possesses which make their personality different
than other business managers (Beyer, 2019). This study is the piece of literature review which
analysis that how personality traits of an individual impacts their entrepreneurial intention of
starting a business.
The basic objectives of this study are:
To analyse the concept of entrepreneurship.
To evaluate the five personality traits of an entrepreneur.
To determine the impact of personality traits on the entrepreneurial intention.
Arguments of positivist paradigm in this study
Positivist paradigm is a concept which allows an investigator to explore social reality by
conducting experiment and observations upon the behaviour of human beings (Landtblom,
2018). It is an approach which helps in ascertaining the way in which society actually operates.
The key arguments which can be used from this study for positivist paradigm are measures of
personality traits (Leech, Barrett and Morgan, 2013). These measures can used to determine
whether or not individuals have a common set of personality traits which an entrepreneur usually
possess and then compare them with their entrepreneurial intention. By this, an experiment under
positivist paradigm can be conducted which can help in determine whether well established
business owners has entrepreneurial traits or not.
Key concepts introduced in this study and stating the appropriate research hypotheses
The study of “Entrepreneurial Intention and personality traits” revolves around the
concepts of five personality traits of an entrepreneur and its relation with their entrepreneurial
intention. So, the appropriate hypothesis of this investigation should be “Existence of
entrepreneurial traits in individual results in positive entrepreneurial intention in them”.
In this study, “purchase intention” is dependent variable and another factor which can influence
this variable can be background and education of an individual as this factor can both hinder and
foster entrepreneurial intention (Sarkar and Rashid, 2016).
3
⊘ This is a preview!⊘
Do you want full access?
Subscribe today to unlock all pages.
Trusted by 1+ million students worldwide
.
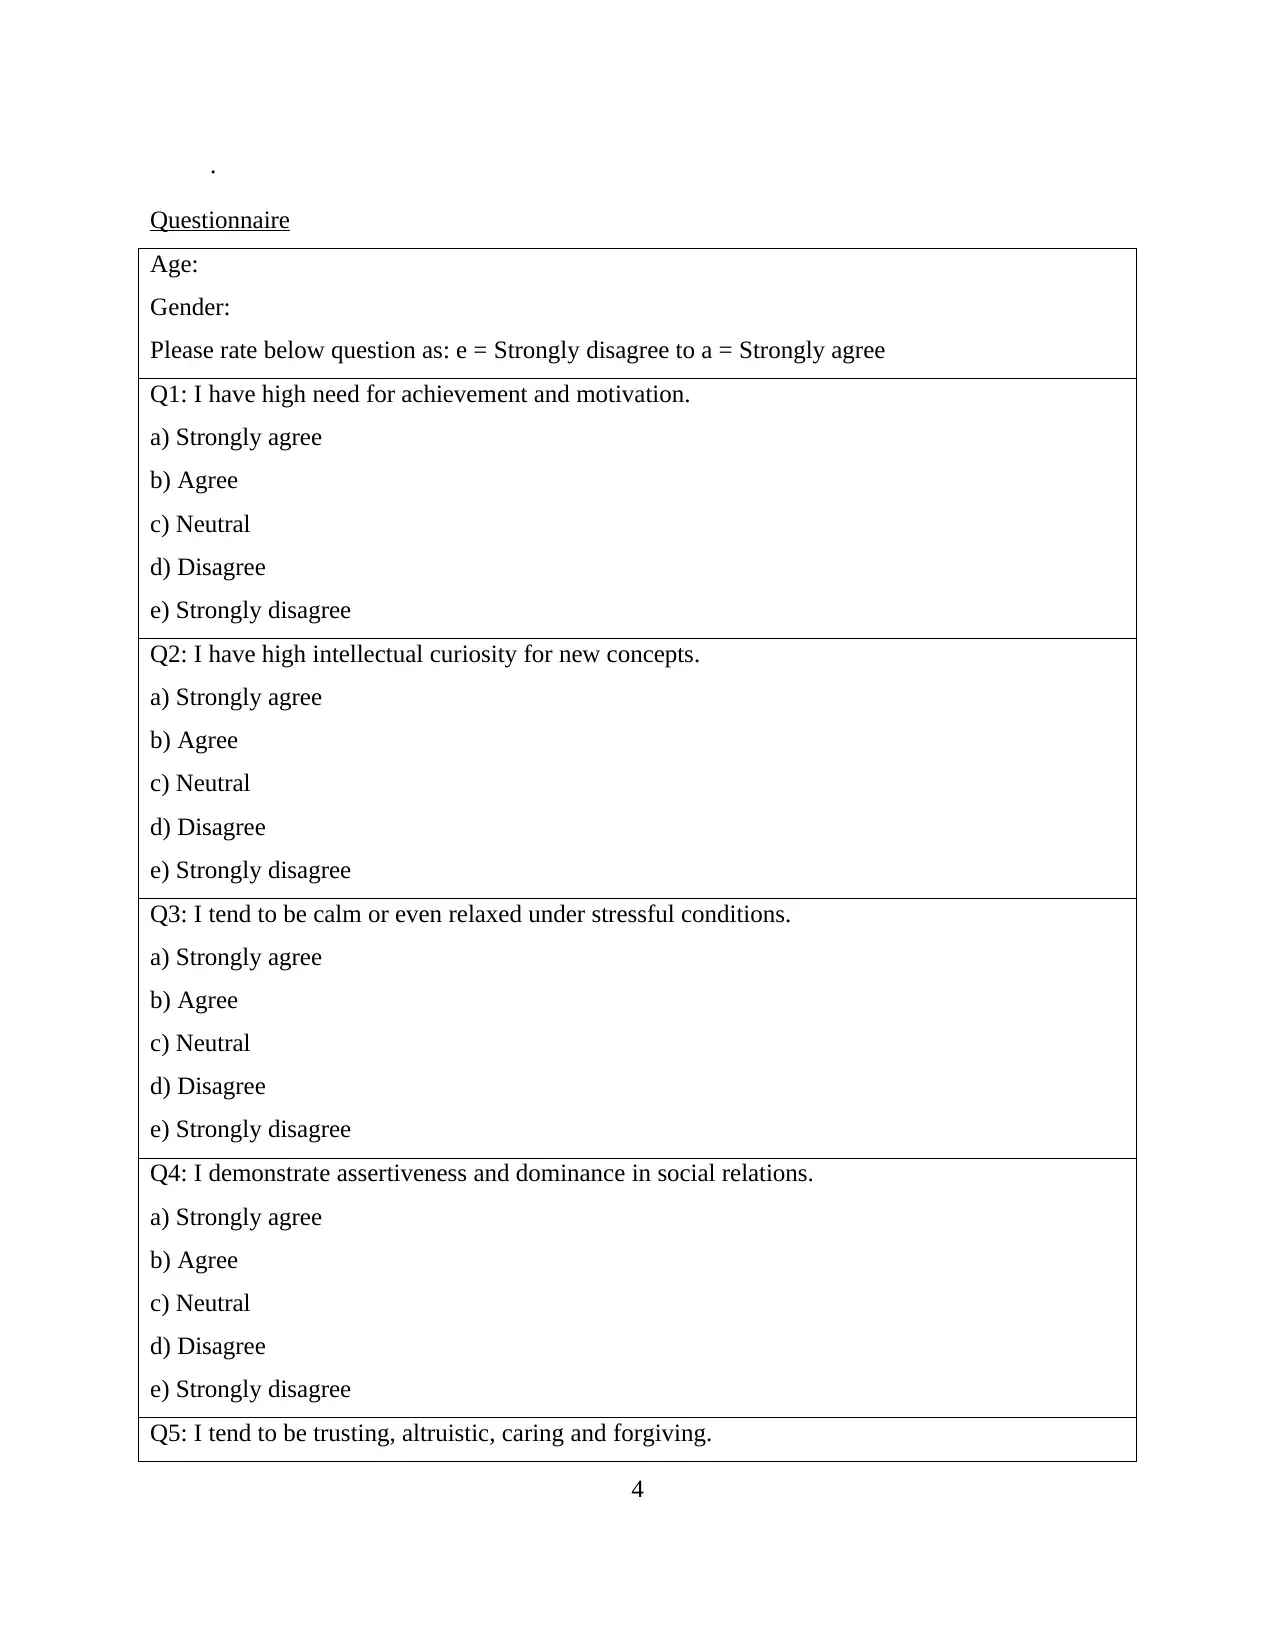
Questionnaire
Age:
Gender:
Please rate below question as: e = Strongly disagree to a = Strongly agree
Q1: I have high need for achievement and motivation.
a) Strongly agree
b) Agree
c) Neutral
d) Disagree
e) Strongly disagree
Q2: I have high intellectual curiosity for new concepts.
a) Strongly agree
b) Agree
c) Neutral
d) Disagree
e) Strongly disagree
Q3: I tend to be calm or even relaxed under stressful conditions.
a) Strongly agree
b) Agree
c) Neutral
d) Disagree
e) Strongly disagree
Q4: I demonstrate assertiveness and dominance in social relations.
a) Strongly agree
b) Agree
c) Neutral
d) Disagree
e) Strongly disagree
Q5: I tend to be trusting, altruistic, caring and forgiving.
4
Paraphrase This Document
Need a fresh take? Get an instant paraphrase of this document with our AI Paraphraser
a) Strongly agree
b) Agree
c) Neutral
d) Disagree
e) Strongly disagree
Q6: I have intention to start my own business.
a) Strongly agree
b) Agree
c) Neutral
d) Disagree
e) Strongly disagree
PART TWO
Objective 1
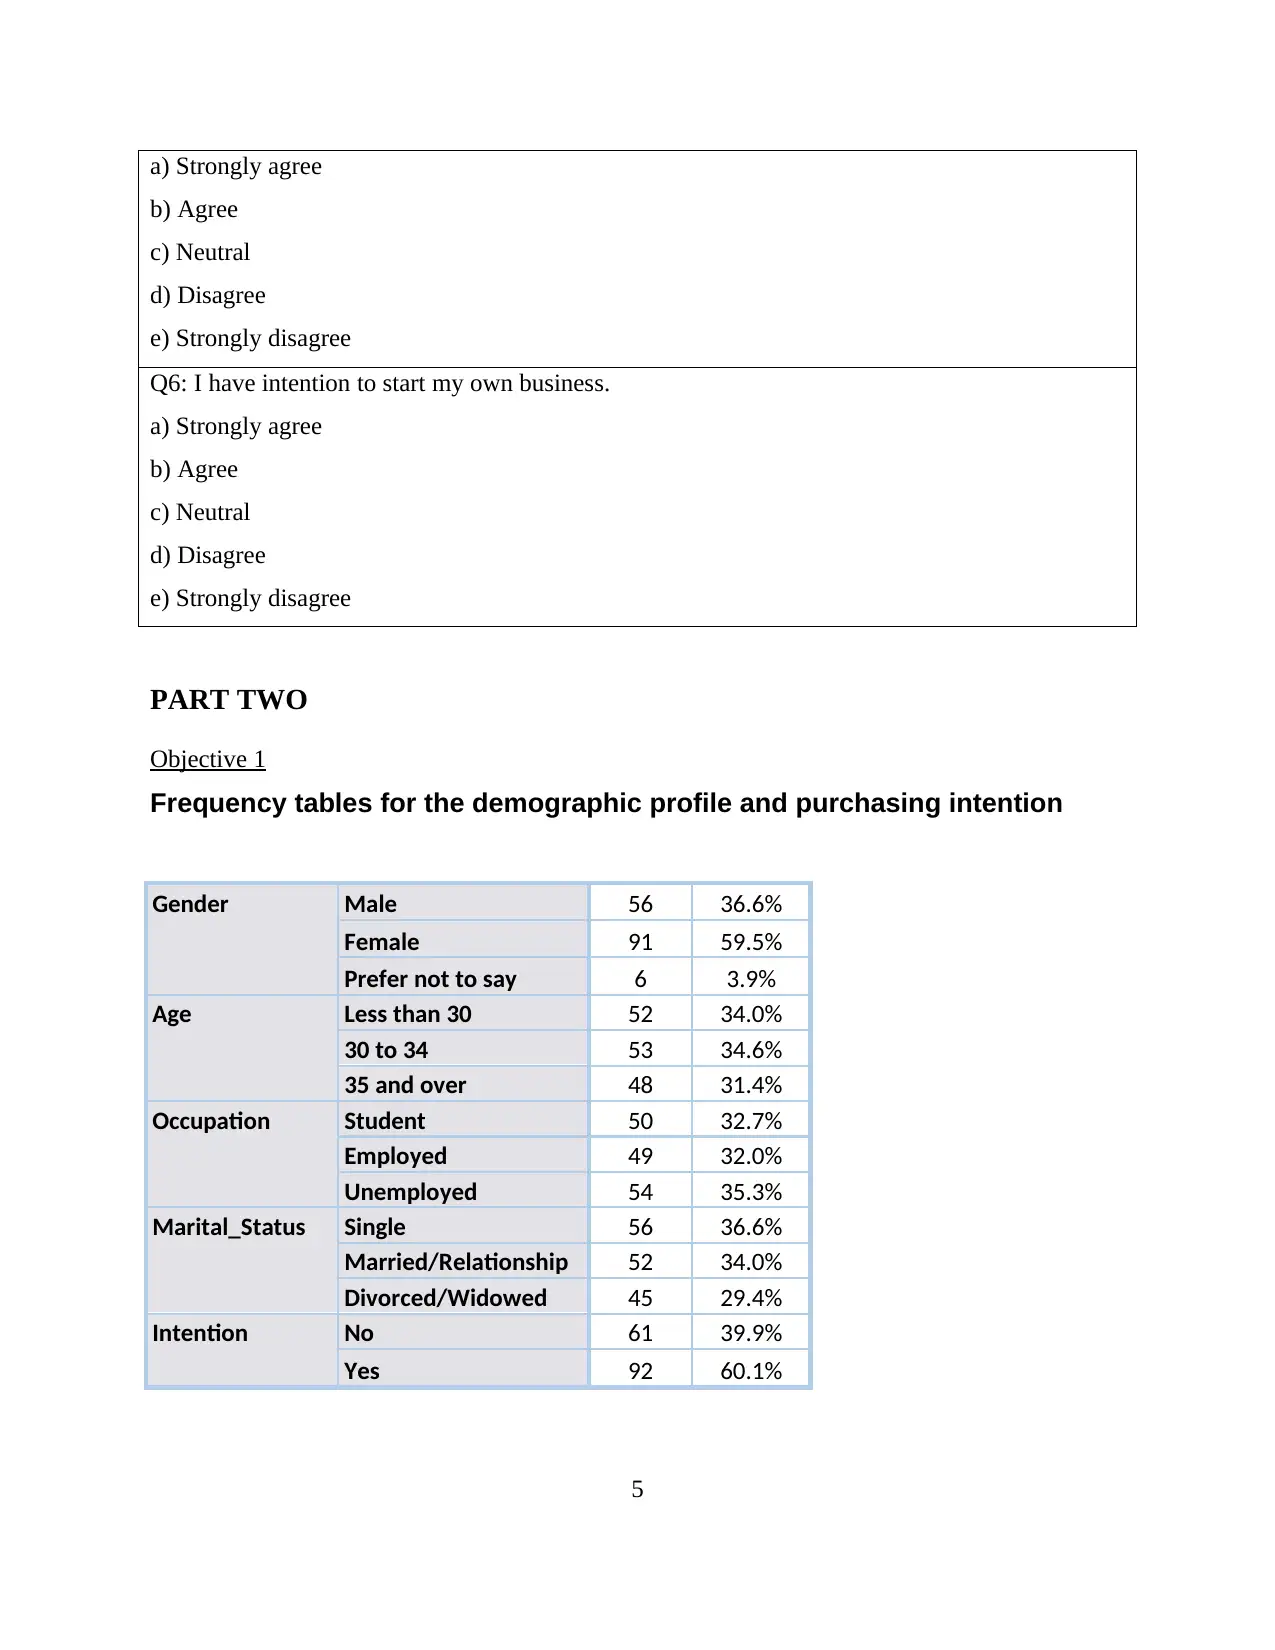
Frequency tables for the demographic profile and purchasing intention
Gender Male 56 36.6%
Female 91 59.5%
Prefer not to say 6 3.9%
Age Less than 30 52 34.0%
30 to 34 53 34.6%
35 and over 48 31.4%
Occupation Student 50 32.7%
Employed 49 32.0%
Unemployed 54 35.3%
Marital_Status Single 56 36.6%
Married/Relationship 52 34.0%
Divorced/Widowed 45 29.4%
Intention No 61 39.9%
Yes 92 60.1%
5
b) Agree
c) Neutral
d) Disagree
e) Strongly disagree
Q6: I have intention to start my own business.
a) Strongly agree
b) Agree
c) Neutral
d) Disagree
e) Strongly disagree
PART TWO
Objective 1
Frequency tables for the demographic profile and purchasing intention
Gender Male 56 36.6%
Female 91 59.5%
Prefer not to say 6 3.9%
Age Less than 30 52 34.0%
30 to 34 53 34.6%
35 and over 48 31.4%
Occupation Student 50 32.7%
Employed 49 32.0%
Unemployed 54 35.3%
Marital_Status Single 56 36.6%
Married/Relationship 52 34.0%
Divorced/Widowed 45 29.4%
Intention No 61 39.9%
Yes 92 60.1%
5
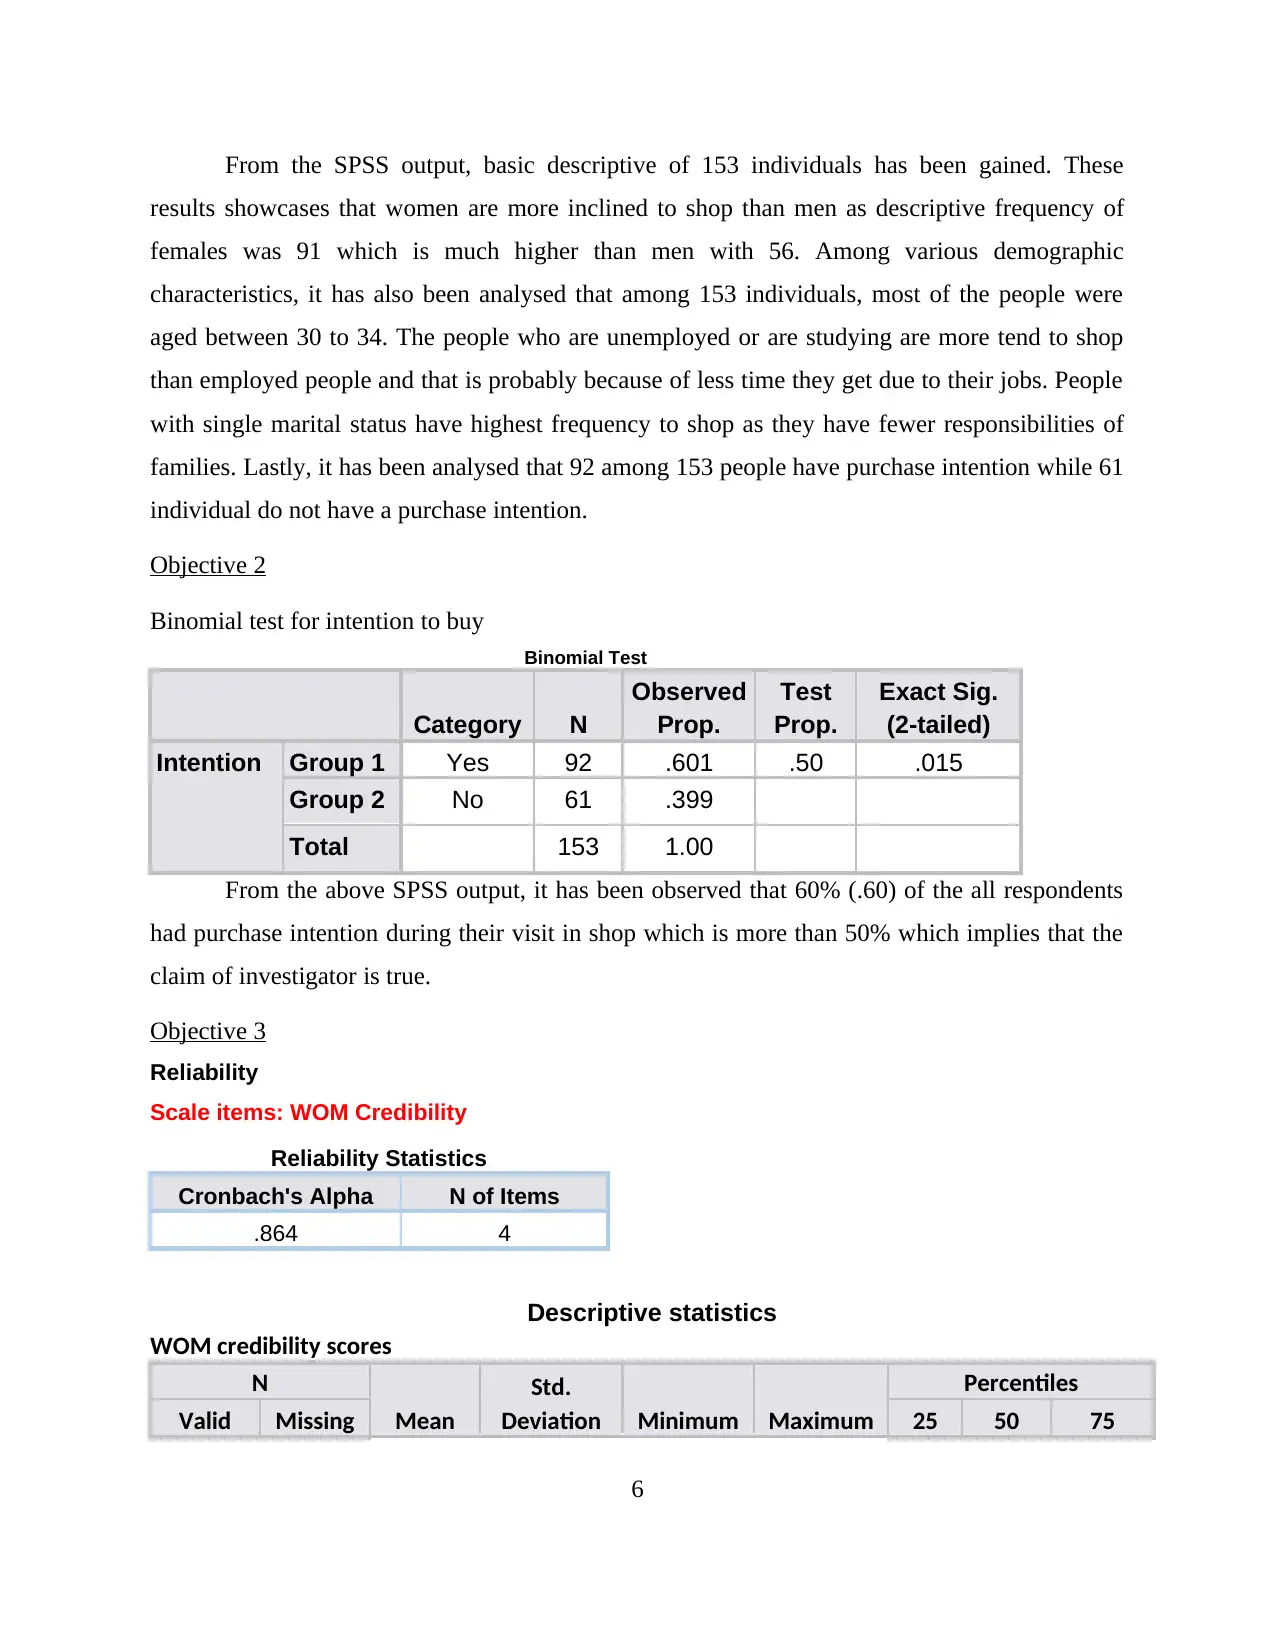
From the SPSS output, basic descriptive of 153 individuals has been gained. These
results showcases that women are more inclined to shop than men as descriptive frequency of
females was 91 which is much higher than men with 56. Among various demographic
characteristics, it has also been analysed that among 153 individuals, most of the people were
aged between 30 to 34. The people who are unemployed or are studying are more tend to shop
than employed people and that is probably because of less time they get due to their jobs. People
with single marital status have highest frequency to shop as they have fewer responsibilities of
families. Lastly, it has been analysed that 92 among 153 people have purchase intention while 61
individual do not have a purchase intention.
Objective 2
Binomial test for intention to buy
Binomial Test
Category N
Observed
Prop.
Test
Prop.
Exact Sig.
(2-tailed)
Intention Group 1 Yes 92 .601 .50 .015
Group 2 No 61 .399
Total 153 1.00
From the above SPSS output, it has been observed that 60% (.60) of the all respondents
had purchase intention during their visit in shop which is more than 50% which implies that the
claim of investigator is true.
Objective 3
Reliability
Scale items: WOM Credibility
Reliability Statistics
Cronbach's Alpha N of Items
.864 4
Descriptive statistics
WOM credibility scores
N
Mean
Std.
Deviation Minimum Maximum
Percentiles
Valid Missing 25 50 75
6
⊘ This is a preview!⊘
Do you want full access?
Subscribe today to unlock all pages.
Trusted by 1+ million students worldwide
153 0 12.5948 4.28651 4 20 9 13 17
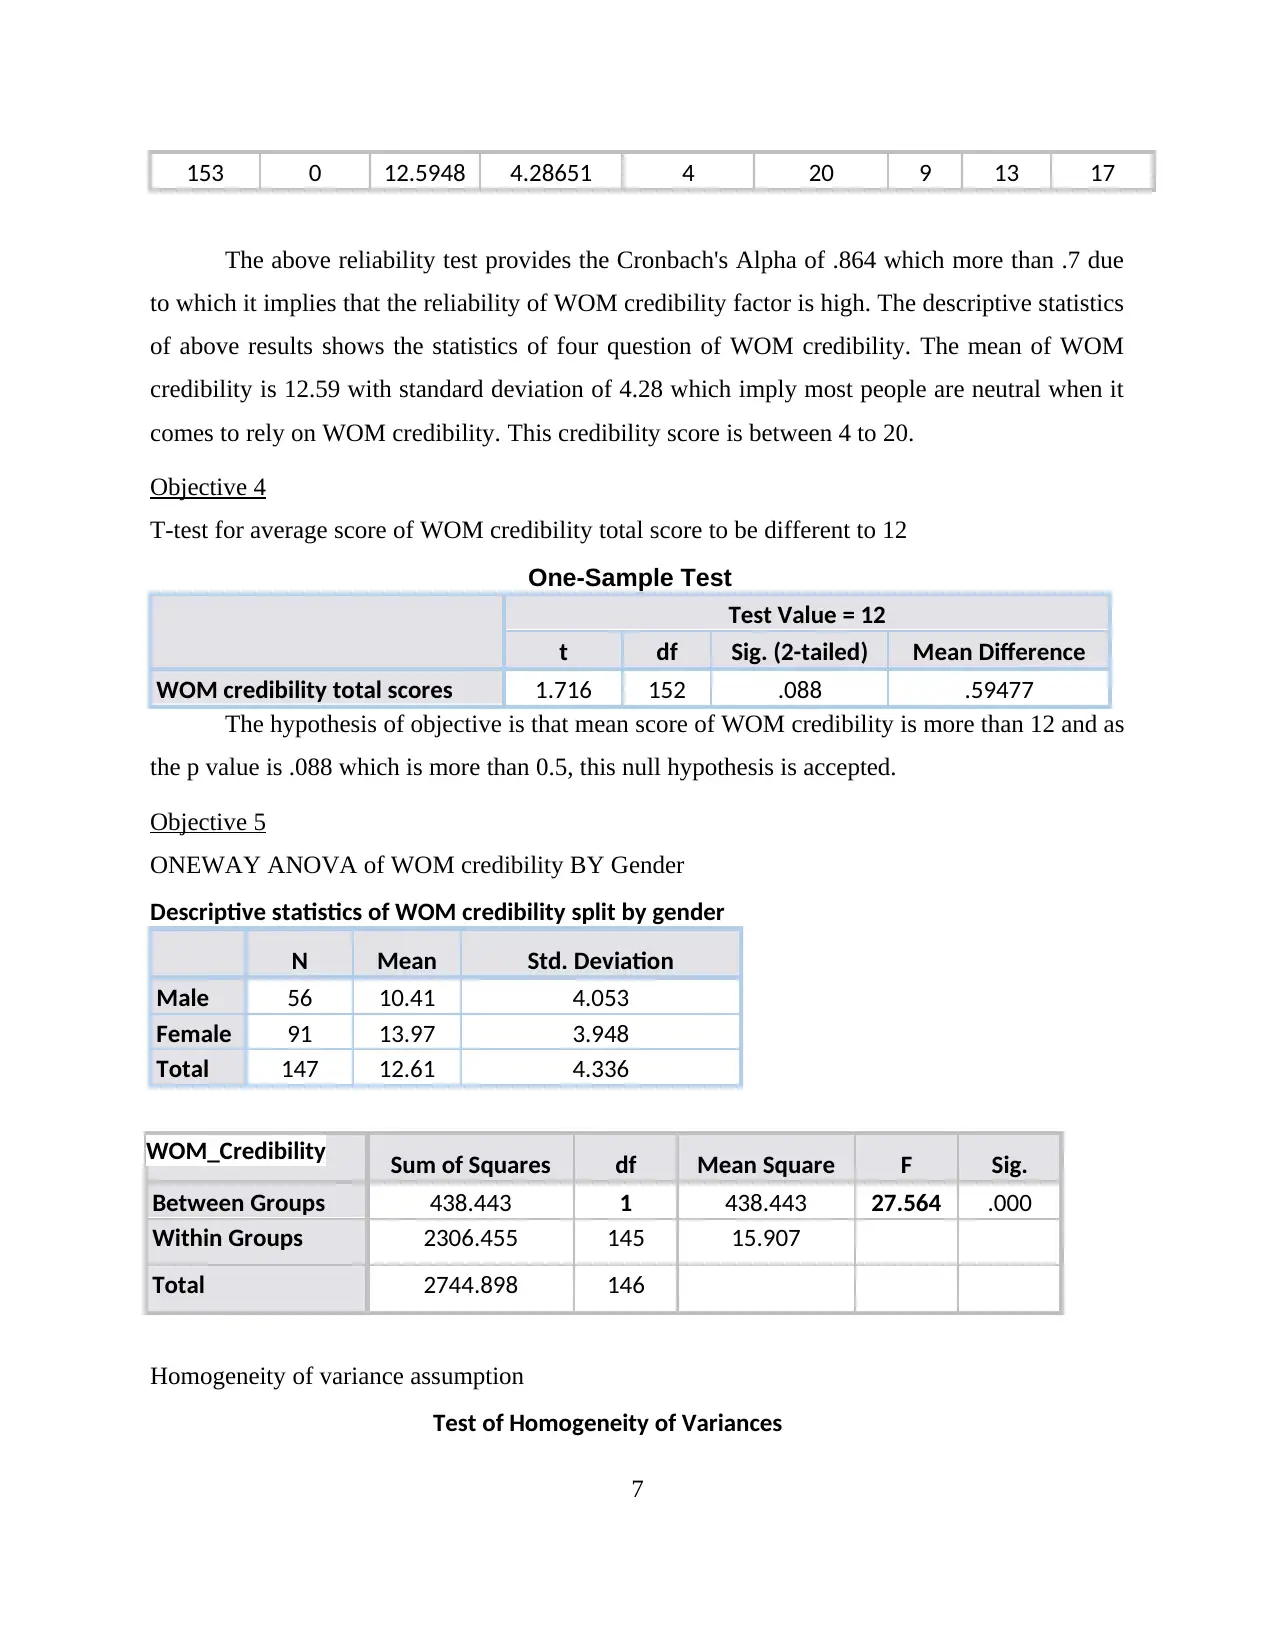
The above reliability test provides the Cronbach's Alpha of .864 which more than .7 due
to which it implies that the reliability of WOM credibility factor is high. The descriptive statistics
of above results shows the statistics of four question of WOM credibility. The mean of WOM
credibility is 12.59 with standard deviation of 4.28 which imply most people are neutral when it
comes to rely on WOM credibility. This credibility score is between 4 to 20.
Objective 4
T-test for average score of WOM credibility total score to be different to 12
One-Sample Test
Test Value = 12
t df Sig. (2-tailed) Mean Difference
WOM credibility total scores 1.716 152 .088 .59477
The hypothesis of objective is that mean score of WOM credibility is more than 12 and as
the p value is .088 which is more than 0.5, this null hypothesis is accepted.
Objective 5
ONEWAY ANOVA of WOM credibility BY Gender
Descriptive statistics of WOM credibility split by gender
N Mean Std. Deviation
Male 56 10.41 4.053
Female 91 13.97 3.948
Total 147 12.61 4.336
WOM_Credibility Sum of Squares df Mean Square F Sig.
Between Groups 438.443 1 438.443 27.564 .000
Within Groups 2306.455 145 15.907
Total 2744.898 146
Homogeneity of variance assumption
Test of Homogeneity of Variances
7
Paraphrase This Document
Need a fresh take? Get an instant paraphrase of this document with our AI Paraphraser

Levene Statistic df1 df2 Sig.
WOM_Credibility Based on Mean .006 1 145 .940
The hypothesis of this objective is that the WOM credibility score given by males and
females is different. As the p value of above result is less than 0.05, the difference between the
scores is significant.
Objective 6
ONEWAY ANOVA of WOM credibility BY Buying frequency
Descriptives statistics of WOM_Credibility split buying frequency
N Mean Std. Deviation
One 50 8.34 2.967
Two to three 47 11.85 2.284
Four or more 56 17.02 1.314
Total 153 12.59 4.287
Tests of Between-Subjects Effects
Dependent Variable: WOM
Source
Type III Sum
of Squares df
Mean
Square F Sig.
Partial Eta
Squared
Observed
Powerb
Buying_Freq 2026.716 2 1013.358 198.4 .000 .726 1.000
Error 766.160 150 5.108
Total 27063.000 153
Corrected Total 2792.876 152
Test of Homogeneity of Variances
Levene Statistic df1 df2 Sig.
WOM credibility Based on Mean 12.087 2 150 .000
Post Hoc Tests: LSD
Multiple Comparisons
Dependent Variable: Overall total score for WOM credibility
8
(I) Buying frequency
per year
(J) Buying frequency
per year
Mean Difference
(I-J)
Std.
Error Sig.
One Two to three -3.511* .459 .000
Four or more -8.678* .440 .000
Two to three One 3.511* .459 .000
Four or more -5.167* .447 .000
Four or more One 8.678* .440 .000
Two to three 5.167* .447 .000
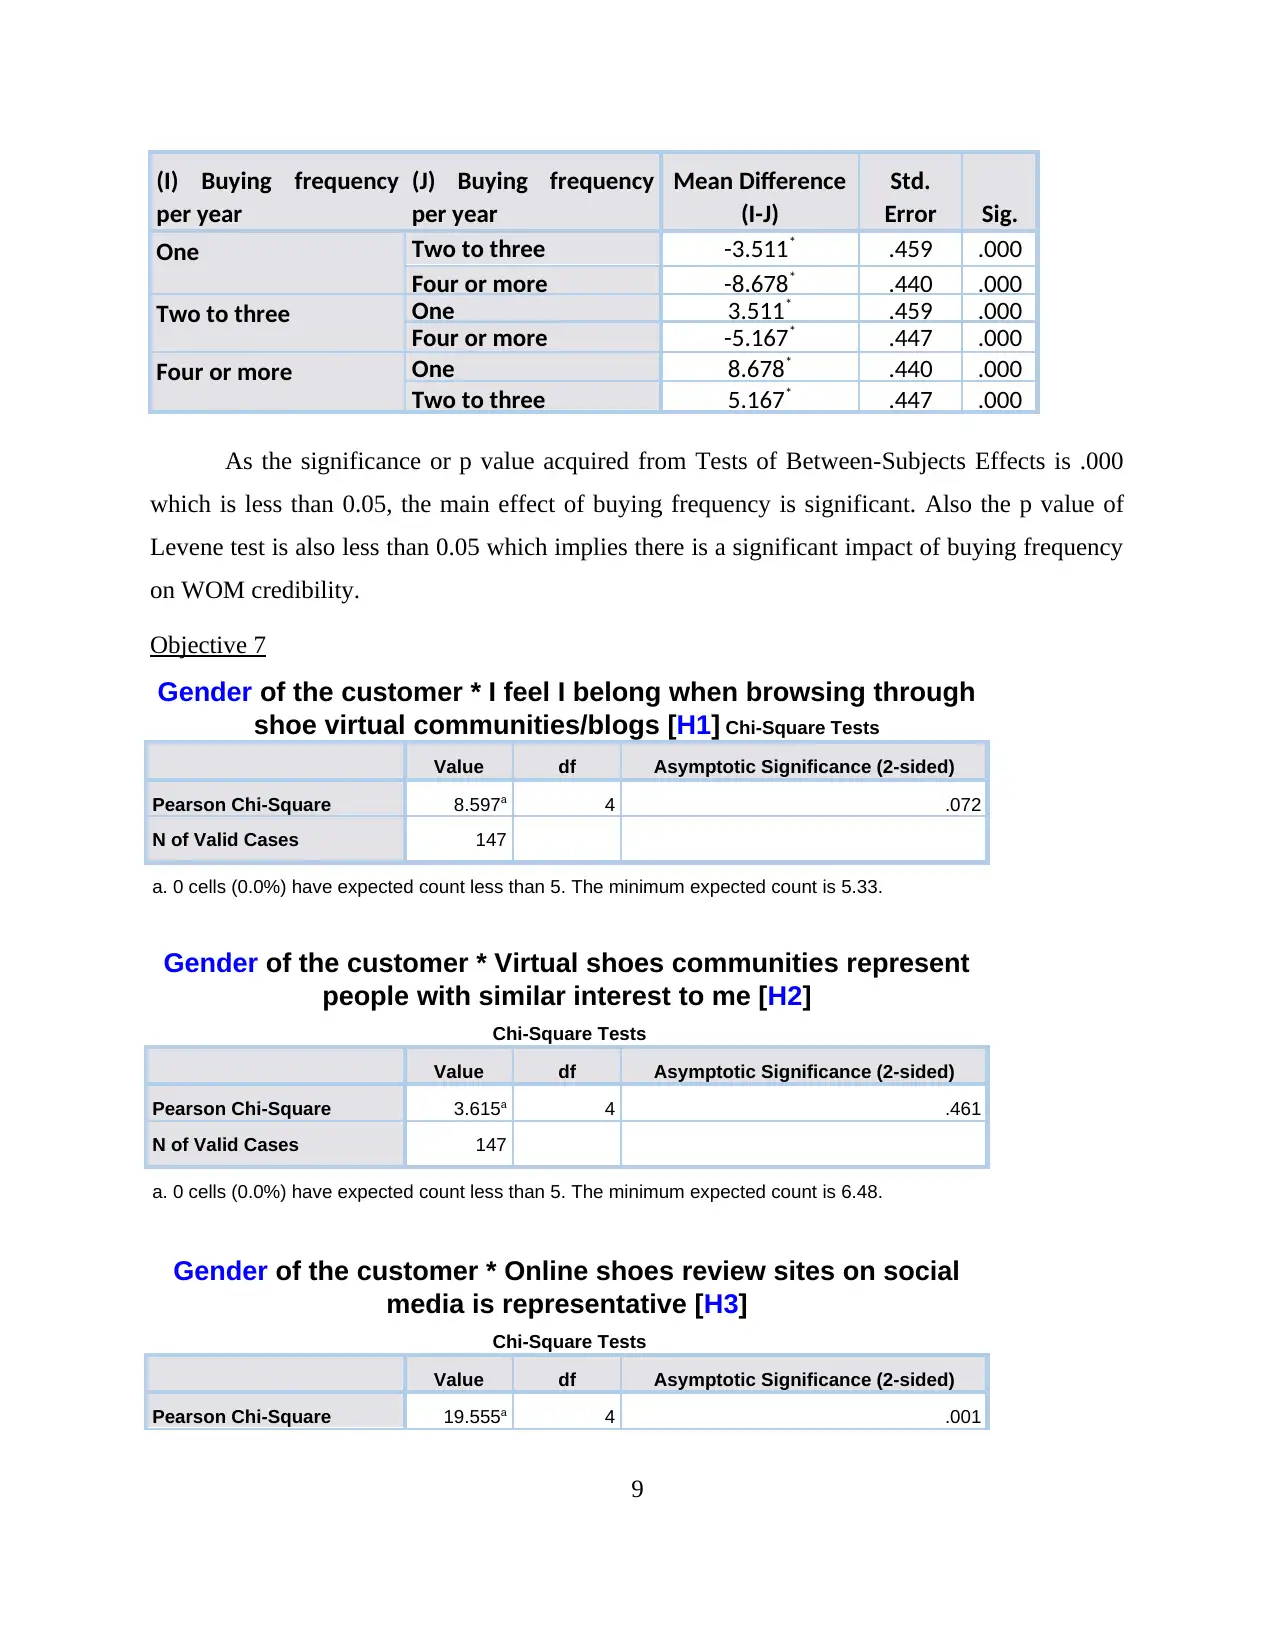
As the significance or p value acquired from Tests of Between-Subjects Effects is .000
which is less than 0.05, the main effect of buying frequency is significant. Also the p value of
Levene test is also less than 0.05 which implies there is a significant impact of buying frequency
on WOM credibility.
Objective 7
Gender of the customer * I feel I belong when browsing through
shoe virtual communities/blogs [H1] Chi-Square Tests
Value df Asymptotic Significance (2-sided)
Pearson Chi-Square 8.597a 4 .072
N of Valid Cases 147
a. 0 cells (0.0%) have expected count less than 5. The minimum expected count is 5.33.
Gender of the customer * Virtual shoes communities represent
people with similar interest to me [H2]
Chi-Square Tests
Value df Asymptotic Significance (2-sided)
Pearson Chi-Square 3.615a 4 .461
N of Valid Cases 147
a. 0 cells (0.0%) have expected count less than 5. The minimum expected count is 6.48.
Gender of the customer * Online shoes review sites on social
media is representative [H3]
Chi-Square Tests
Value df Asymptotic Significance (2-sided)
Pearson Chi-Square 19.555a 4 .001
9
per year
(J) Buying frequency
per year
Mean Difference
(I-J)
Std.
Error Sig.
One Two to three -3.511* .459 .000
Four or more -8.678* .440 .000
Two to three One 3.511* .459 .000
Four or more -5.167* .447 .000
Four or more One 8.678* .440 .000
Two to three 5.167* .447 .000
As the significance or p value acquired from Tests of Between-Subjects Effects is .000
which is less than 0.05, the main effect of buying frequency is significant. Also the p value of
Levene test is also less than 0.05 which implies there is a significant impact of buying frequency
on WOM credibility.
Objective 7
Gender of the customer * I feel I belong when browsing through
shoe virtual communities/blogs [H1] Chi-Square Tests
Value df Asymptotic Significance (2-sided)
Pearson Chi-Square 8.597a 4 .072
N of Valid Cases 147
a. 0 cells (0.0%) have expected count less than 5. The minimum expected count is 5.33.
Gender of the customer * Virtual shoes communities represent
people with similar interest to me [H2]
Chi-Square Tests
Value df Asymptotic Significance (2-sided)
Pearson Chi-Square 3.615a 4 .461
N of Valid Cases 147
a. 0 cells (0.0%) have expected count less than 5. The minimum expected count is 6.48.
Gender of the customer * Online shoes review sites on social
media is representative [H3]
Chi-Square Tests
Value df Asymptotic Significance (2-sided)
Pearson Chi-Square 19.555a 4 .001
9
⊘ This is a preview!⊘
Do you want full access?
Subscribe today to unlock all pages.
Trusted by 1+ million students worldwide
N of Valid Cases 147
a. 0 cells (0.0%) have expected count less than 5. The minimum expected count is 6.10.
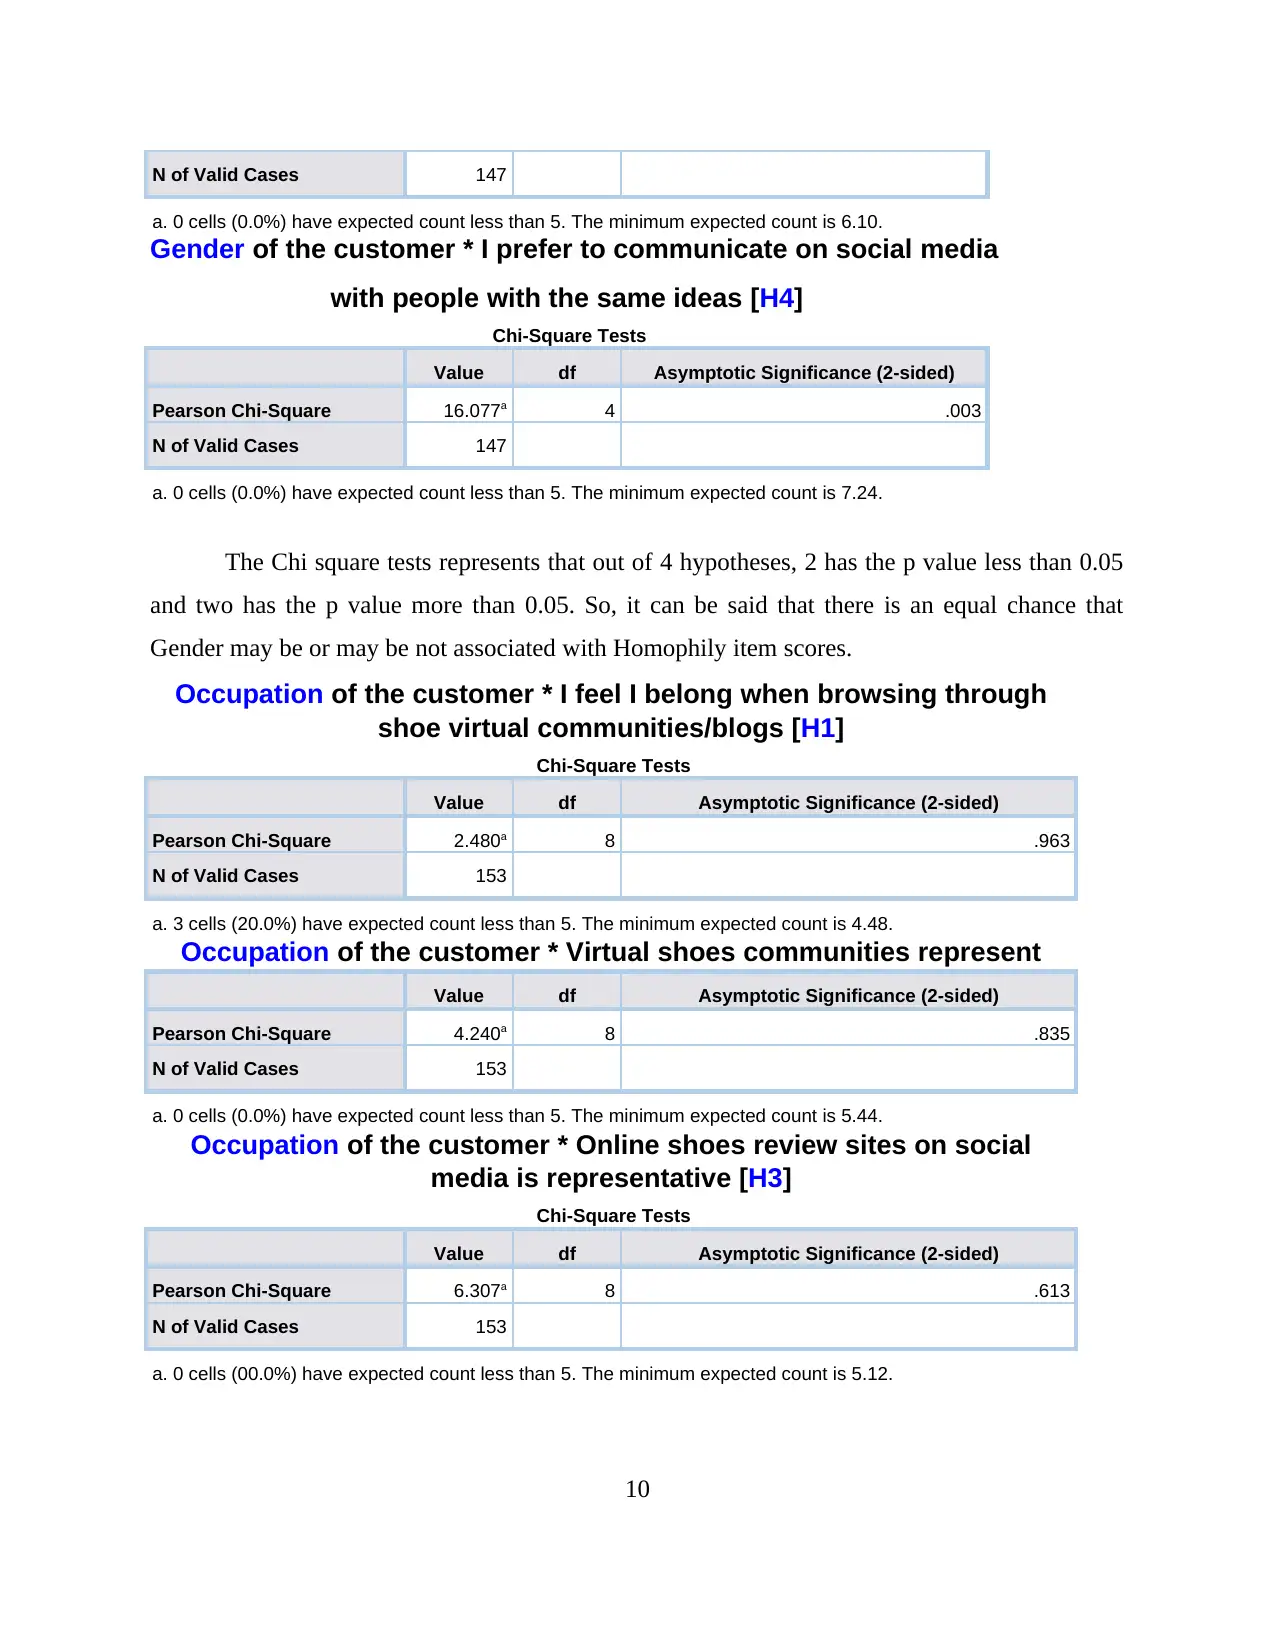
Gender of the customer * I prefer to communicate on social media
with people with the same ideas [H4]
Chi-Square Tests
Value df Asymptotic Significance (2-sided)
Pearson Chi-Square 16.077a 4 .003
N of Valid Cases 147
a. 0 cells (0.0%) have expected count less than 5. The minimum expected count is 7.24.
The Chi square tests represents that out of 4 hypotheses, 2 has the p value less than 0.05
and two has the p value more than 0.05. So, it can be said that there is an equal chance that
Gender may be or may be not associated with Homophily item scores.
Occupation of the customer * I feel I belong when browsing through
shoe virtual communities/blogs [H1]
Chi-Square Tests
Value df Asymptotic Significance (2-sided)
Pearson Chi-Square 2.480a 8 .963
N of Valid Cases 153
a. 3 cells (20.0%) have expected count less than 5. The minimum expected count is 4.48.
Occupation of the customer * Virtual shoes communities represent
people with similar interest to me [H2]Value df Asymptotic Significance (2-sided)
Pearson Chi-Square 4.240a 8 .835
N of Valid Cases 153
a. 0 cells (0.0%) have expected count less than 5. The minimum expected count is 5.44.
Occupation of the customer * Online shoes review sites on social
media is representative [H3]
Chi-Square Tests
Value df Asymptotic Significance (2-sided)
Pearson Chi-Square 6.307a 8 .613
N of Valid Cases 153
a. 0 cells (00.0%) have expected count less than 5. The minimum expected count is 5.12.
10
a. 0 cells (0.0%) have expected count less than 5. The minimum expected count is 6.10.
Gender of the customer * I prefer to communicate on social media
with people with the same ideas [H4]
Chi-Square Tests
Value df Asymptotic Significance (2-sided)
Pearson Chi-Square 16.077a 4 .003
N of Valid Cases 147
a. 0 cells (0.0%) have expected count less than 5. The minimum expected count is 7.24.
The Chi square tests represents that out of 4 hypotheses, 2 has the p value less than 0.05
and two has the p value more than 0.05. So, it can be said that there is an equal chance that
Gender may be or may be not associated with Homophily item scores.
Occupation of the customer * I feel I belong when browsing through
shoe virtual communities/blogs [H1]
Chi-Square Tests
Value df Asymptotic Significance (2-sided)
Pearson Chi-Square 2.480a 8 .963
N of Valid Cases 153
a. 3 cells (20.0%) have expected count less than 5. The minimum expected count is 4.48.
Occupation of the customer * Virtual shoes communities represent
people with similar interest to me [H2]Value df Asymptotic Significance (2-sided)
Pearson Chi-Square 4.240a 8 .835
N of Valid Cases 153
a. 0 cells (0.0%) have expected count less than 5. The minimum expected count is 5.44.
Occupation of the customer * Online shoes review sites on social
media is representative [H3]
Chi-Square Tests
Value df Asymptotic Significance (2-sided)
Pearson Chi-Square 6.307a 8 .613
N of Valid Cases 153
a. 0 cells (00.0%) have expected count less than 5. The minimum expected count is 5.12.
10
Paraphrase This Document
Need a fresh take? Get an instant paraphrase of this document with our AI Paraphraser
Occupation of the customer * I prefer to communicate on social media
with people with the same ideas [H4]
Chi-Square Tests
Value df Asymptotic Significance (2-sided)
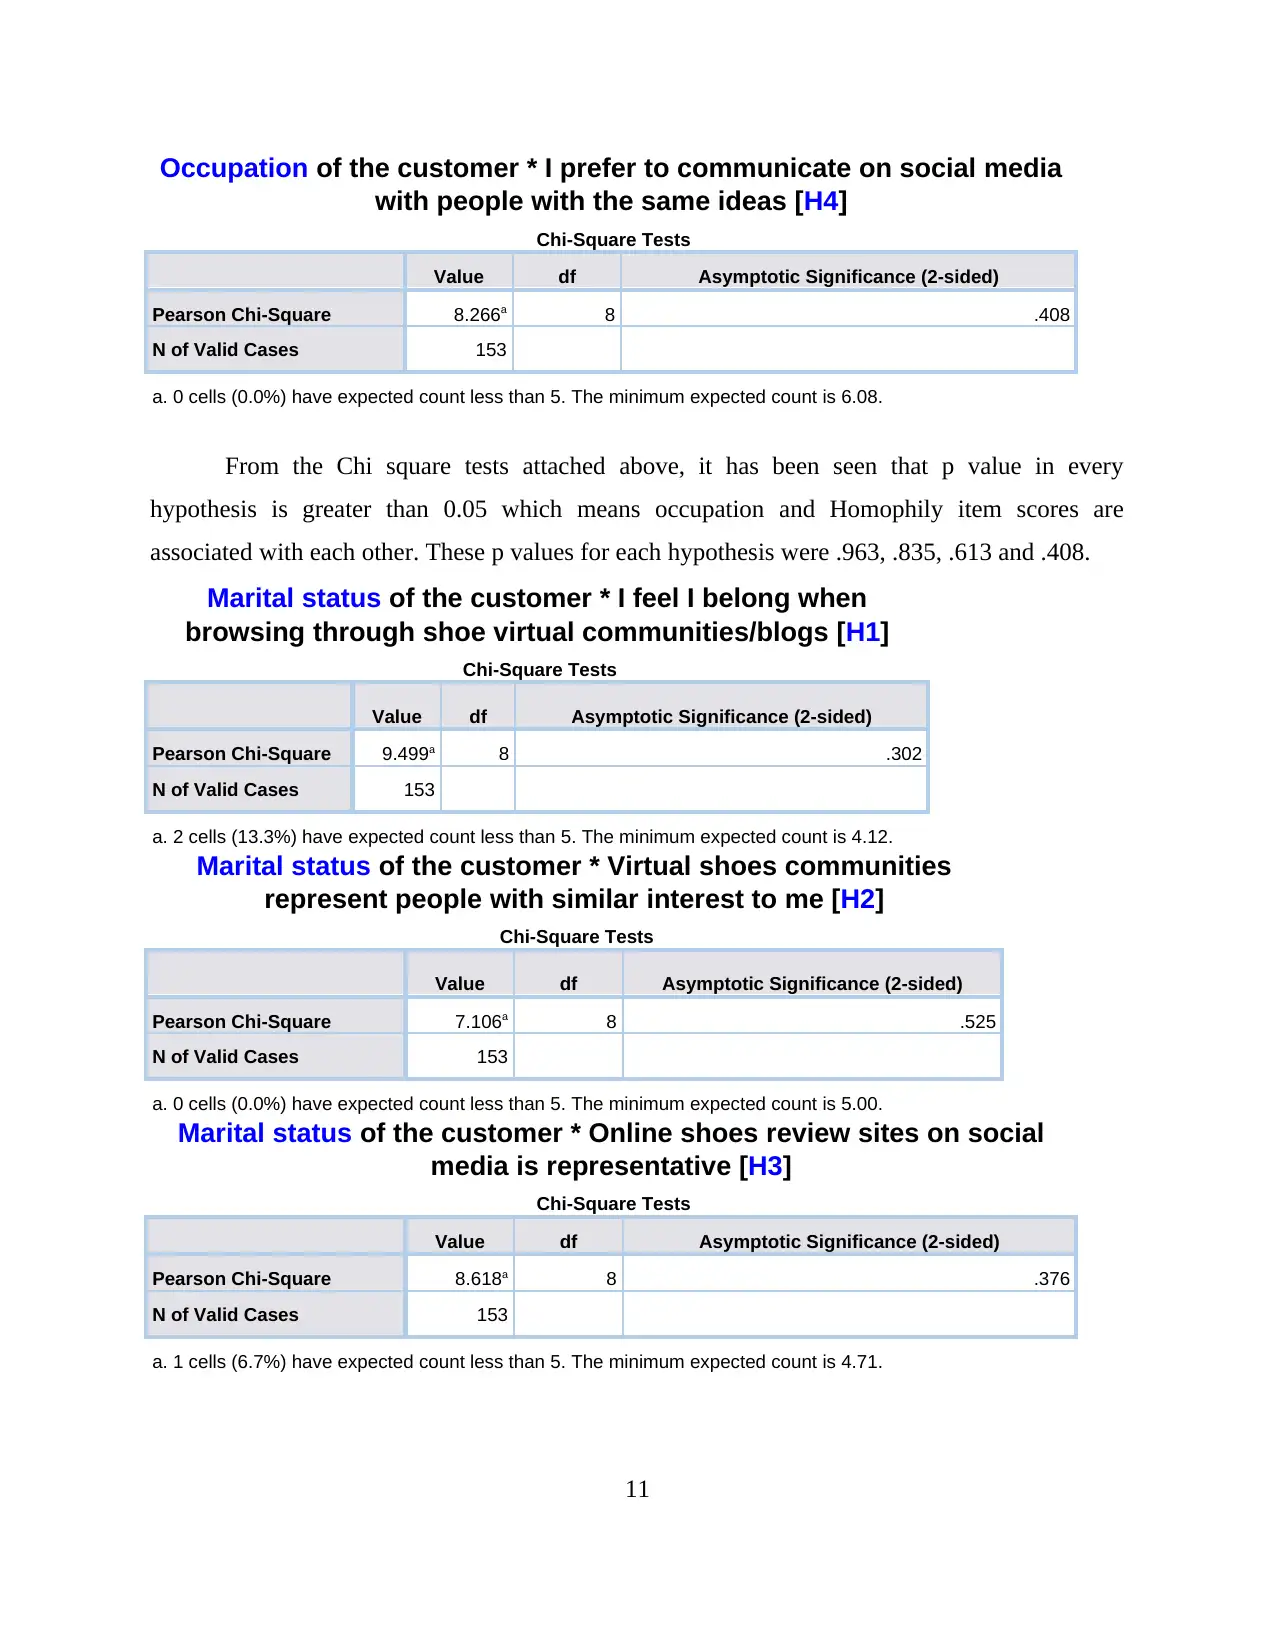
Pearson Chi-Square 8.266a 8 .408
N of Valid Cases 153
a. 0 cells (0.0%) have expected count less than 5. The minimum expected count is 6.08.
From the Chi square tests attached above, it has been seen that p value in every
hypothesis is greater than 0.05 which means occupation and Homophily item scores are
associated with each other. These p values for each hypothesis were .963, .835, .613 and .408.
Marital status of the customer * I feel I belong when
browsing through shoe virtual communities/blogs [H1]
Chi-Square Tests
Value df Asymptotic Significance (2-sided)
Pearson Chi-Square 9.499a 8 .302
N of Valid Cases 153
a. 2 cells (13.3%) have expected count less than 5. The minimum expected count is 4.12.
Marital status of the customer * Virtual shoes communities
represent people with similar interest to me [H2]
Chi-Square Tests
Value df Asymptotic Significance (2-sided)
Pearson Chi-Square 7.106a 8 .525
N of Valid Cases 153
a. 0 cells (0.0%) have expected count less than 5. The minimum expected count is 5.00.
Marital status of the customer * Online shoes review sites on social
media is representative [H3]
Chi-Square Tests
Value df Asymptotic Significance (2-sided)
Pearson Chi-Square 8.618a 8 .376
N of Valid Cases 153
a. 1 cells (6.7%) have expected count less than 5. The minimum expected count is 4.71.
11
with people with the same ideas [H4]
Chi-Square Tests
Value df Asymptotic Significance (2-sided)
Pearson Chi-Square 8.266a 8 .408
N of Valid Cases 153
a. 0 cells (0.0%) have expected count less than 5. The minimum expected count is 6.08.
From the Chi square tests attached above, it has been seen that p value in every
hypothesis is greater than 0.05 which means occupation and Homophily item scores are
associated with each other. These p values for each hypothesis were .963, .835, .613 and .408.
Marital status of the customer * I feel I belong when
browsing through shoe virtual communities/blogs [H1]
Chi-Square Tests
Value df Asymptotic Significance (2-sided)
Pearson Chi-Square 9.499a 8 .302
N of Valid Cases 153
a. 2 cells (13.3%) have expected count less than 5. The minimum expected count is 4.12.
Marital status of the customer * Virtual shoes communities
represent people with similar interest to me [H2]
Chi-Square Tests
Value df Asymptotic Significance (2-sided)
Pearson Chi-Square 7.106a 8 .525
N of Valid Cases 153
a. 0 cells (0.0%) have expected count less than 5. The minimum expected count is 5.00.
Marital status of the customer * Online shoes review sites on social
media is representative [H3]
Chi-Square Tests
Value df Asymptotic Significance (2-sided)
Pearson Chi-Square 8.618a 8 .376
N of Valid Cases 153
a. 1 cells (6.7%) have expected count less than 5. The minimum expected count is 4.71.
11
Marital status of the customer * I prefer to communicate on social
media with people with the same ideas [H4]
Chi-Square Tests
Value df Asymptotic Significance (2-sided)
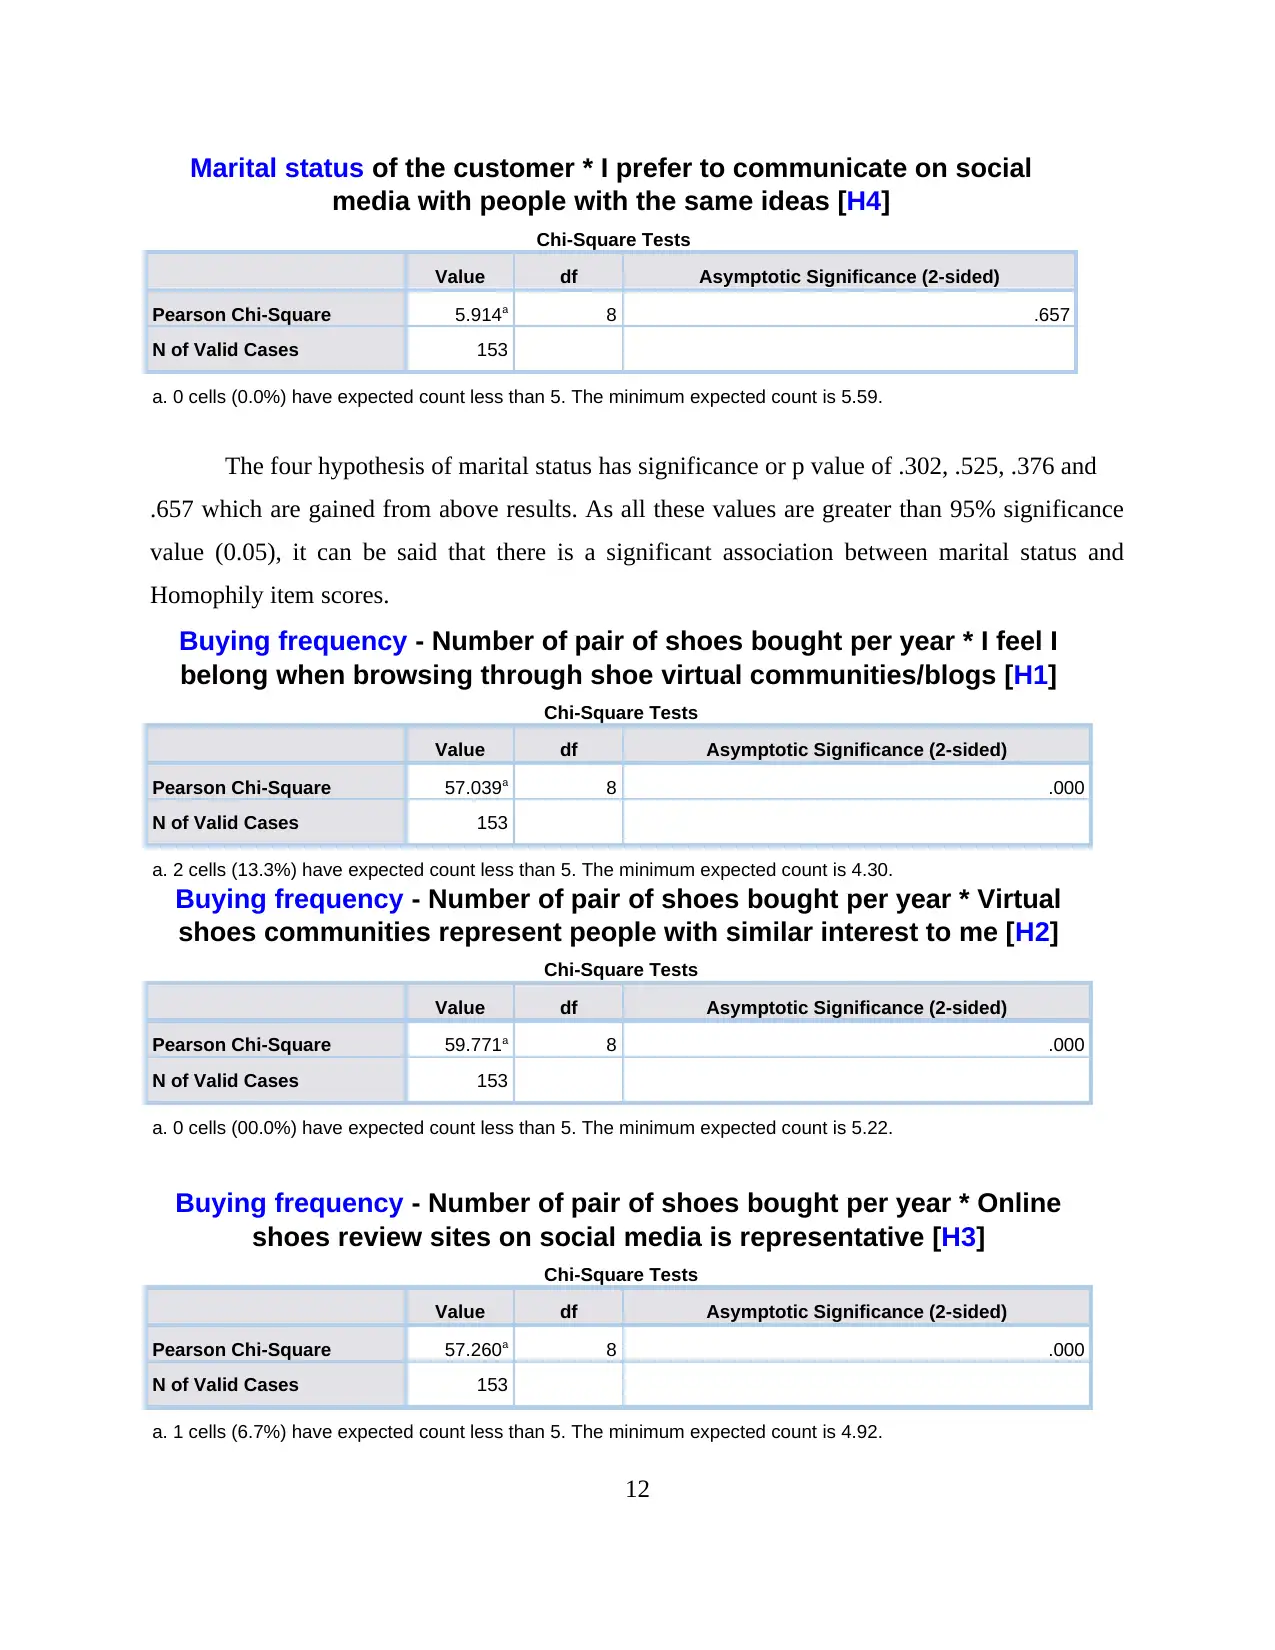
Pearson Chi-Square 5.914a 8 .657
N of Valid Cases 153
a. 0 cells (0.0%) have expected count less than 5. The minimum expected count is 5.59.
The four hypothesis of marital status has significance or p value of .302, .525, .376 and
.657 which are gained from above results. As all these values are greater than 95% significance
value (0.05), it can be said that there is a significant association between marital status and
Homophily item scores.
Buying frequency - Number of pair of shoes bought per year * I feel I
belong when browsing through shoe virtual communities/blogs [H1]
Chi-Square Tests
Value df Asymptotic Significance (2-sided)
Pearson Chi-Square 57.039a 8 .000
N of Valid Cases 153
a. 2 cells (13.3%) have expected count less than 5. The minimum expected count is 4.30.
Buying frequency - Number of pair of shoes bought per year * Virtual
shoes communities represent people with similar interest to me [H2]
Chi-Square Tests
Value df Asymptotic Significance (2-sided)
Pearson Chi-Square 59.771a 8 .000
N of Valid Cases 153
a. 0 cells (00.0%) have expected count less than 5. The minimum expected count is 5.22.
Buying frequency - Number of pair of shoes bought per year * Online
shoes review sites on social media is representative [H3]
Chi-Square Tests
Value df Asymptotic Significance (2-sided)
Pearson Chi-Square 57.260a 8 .000
N of Valid Cases 153
a. 1 cells (6.7%) have expected count less than 5. The minimum expected count is 4.92.
12
media with people with the same ideas [H4]
Chi-Square Tests
Value df Asymptotic Significance (2-sided)
Pearson Chi-Square 5.914a 8 .657
N of Valid Cases 153
a. 0 cells (0.0%) have expected count less than 5. The minimum expected count is 5.59.
The four hypothesis of marital status has significance or p value of .302, .525, .376 and
.657 which are gained from above results. As all these values are greater than 95% significance
value (0.05), it can be said that there is a significant association between marital status and
Homophily item scores.
Buying frequency - Number of pair of shoes bought per year * I feel I
belong when browsing through shoe virtual communities/blogs [H1]
Chi-Square Tests
Value df Asymptotic Significance (2-sided)
Pearson Chi-Square 57.039a 8 .000
N of Valid Cases 153
a. 2 cells (13.3%) have expected count less than 5. The minimum expected count is 4.30.
Buying frequency - Number of pair of shoes bought per year * Virtual
shoes communities represent people with similar interest to me [H2]
Chi-Square Tests
Value df Asymptotic Significance (2-sided)
Pearson Chi-Square 59.771a 8 .000
N of Valid Cases 153
a. 0 cells (00.0%) have expected count less than 5. The minimum expected count is 5.22.
Buying frequency - Number of pair of shoes bought per year * Online
shoes review sites on social media is representative [H3]
Chi-Square Tests
Value df Asymptotic Significance (2-sided)
Pearson Chi-Square 57.260a 8 .000
N of Valid Cases 153
a. 1 cells (6.7%) have expected count less than 5. The minimum expected count is 4.92.
12
⊘ This is a preview!⊘
Do you want full access?
Subscribe today to unlock all pages.
Trusted by 1+ million students worldwide
1 out of 16
Related Documents


Your All-in-One AI-Powered Toolkit for Academic Success.
+13062052269
info@desklib.com
Available 24*7 on WhatsApp / Email
![[object Object]](/_next/static/media/star-bottom.7253800d.svg)
Unlock your academic potential
Copyright © 2020–2026 A2Z Services. All Rights Reserved. Developed and managed by ZUCOL.