Statistical Analysis: SPSS T-test on Mean Heights and Interpretation

Verified

Added on  2022/12/28

|2
|359
|72
Homework Assignment
AI Summary
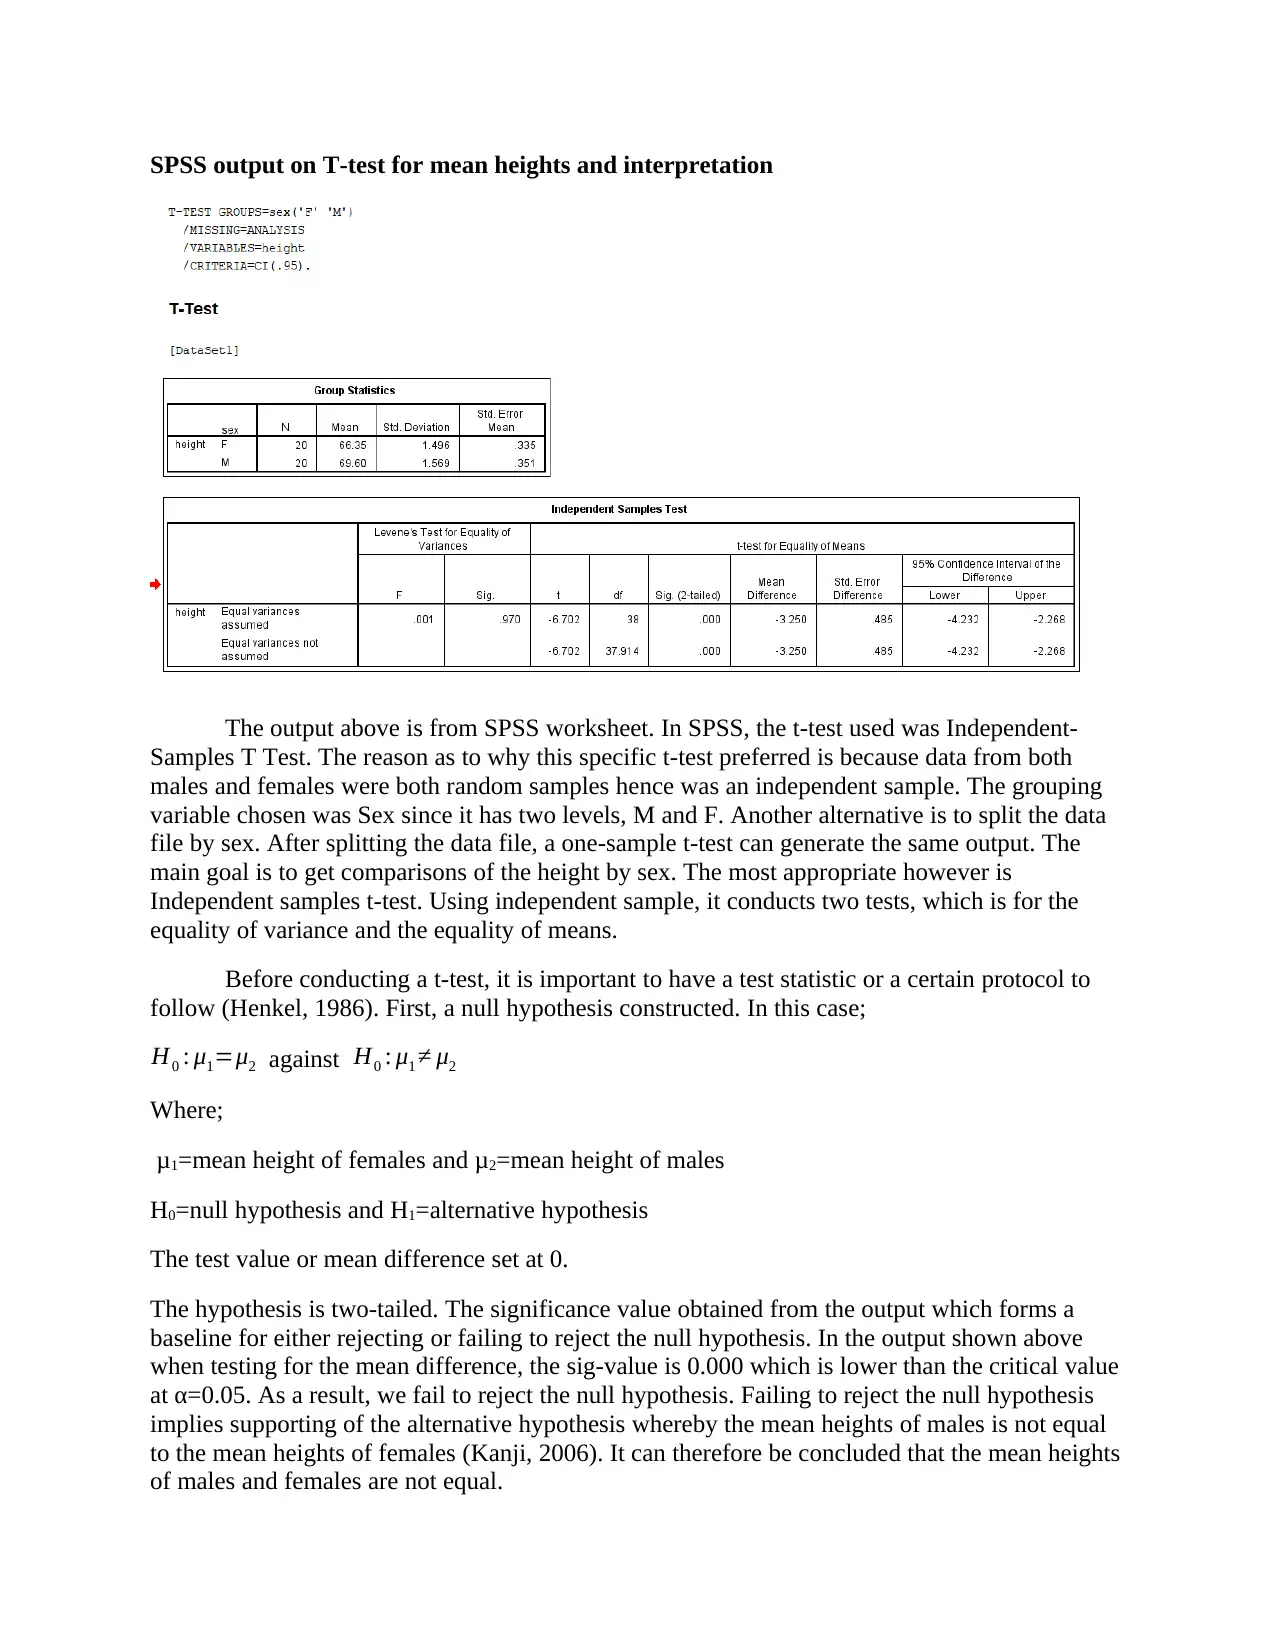
This assignment presents an analysis of SPSS output derived from an independent samples t-test, focusing on the comparison of mean heights between males and females. The solution explains the rationale for choosing this specific t-test, highlighting the independent nature of the data samples from both groups. It details the construction of the null and alternative hypotheses, setting the test value and specifying a two-tailed test. The assignment then interprets the significance value obtained from the output, comparing it to a critical value to either reject or fail to reject the null hypothesis. Ultimately, the analysis concludes whether the mean heights of males and females are statistically equal or different, supporting the alternative hypothesis based on the provided statistical evidence. The solution references relevant statistical literature to support the analysis.
Document Page
SPSS output on T-test for mean heights and interpretation
The output above is from SPSS worksheet. In SPSS, the t-test used was Independent-
Samples T Test. The reason as to why this specific t-test preferred is because data from both
males and females were both random samples hence was an independent sample. The grouping
variable chosen was Sex since it has two levels, M and F. Another alternative is to split the data
file by sex. After splitting the data file, a one-sample t-test can generate the same output. The
main goal is to get comparisons of the height by sex. The most appropriate however is
Independent samples t-test. Using independent sample, it conducts two tests, which is for the
equality of variance and the equality of means.
Before conducting a t-test, it is important to have a test statistic or a certain protocol to
follow (Henkel, 1986). First, a null hypothesis constructed. In this case;
H0 : μ1=μ2 against H0 : μ1 μ2
Where;
μ1=mean height of females and μ2=mean height of males
H0=null hypothesis and H1=alternative hypothesis
The test value or mean difference set at 0.
The hypothesis is two-tailed. The significance value obtained from the output which forms a
baseline for either rejecting or failing to reject the null hypothesis. In the output shown above
when testing for the mean difference, the sig-value is 0.000 which is lower than the critical value
at α=0.05. As a result, we fail to reject the null hypothesis. Failing to reject the null hypothesis
implies supporting of the alternative hypothesis whereby the mean heights of males is not equal
to the mean heights of females (Kanji, 2006). It can therefore be concluded that the mean heights
of males and females are not equal.
tabler-icon-diamond-filled.svg

Paraphrase This Document

Need a fresh take? Get an instant paraphrase of this document with our AI Paraphraser
Document Page
References
Henkel, R. E. (1986). Tests of significance. Beverly Hills: Sage Publications.
Kanji, G. K. (2006). 100 statistical tests.
chevron_up_icon
1 out of 2
circle_padding
hide_on_mobile
zoom_out_icon
[object Object]