SPSS Project: Analyzing Student Performance in Pretest, Midterm, Final
VerifiedAdded on  2023/01/12
|10
|1167
|63
Project
AI Summary
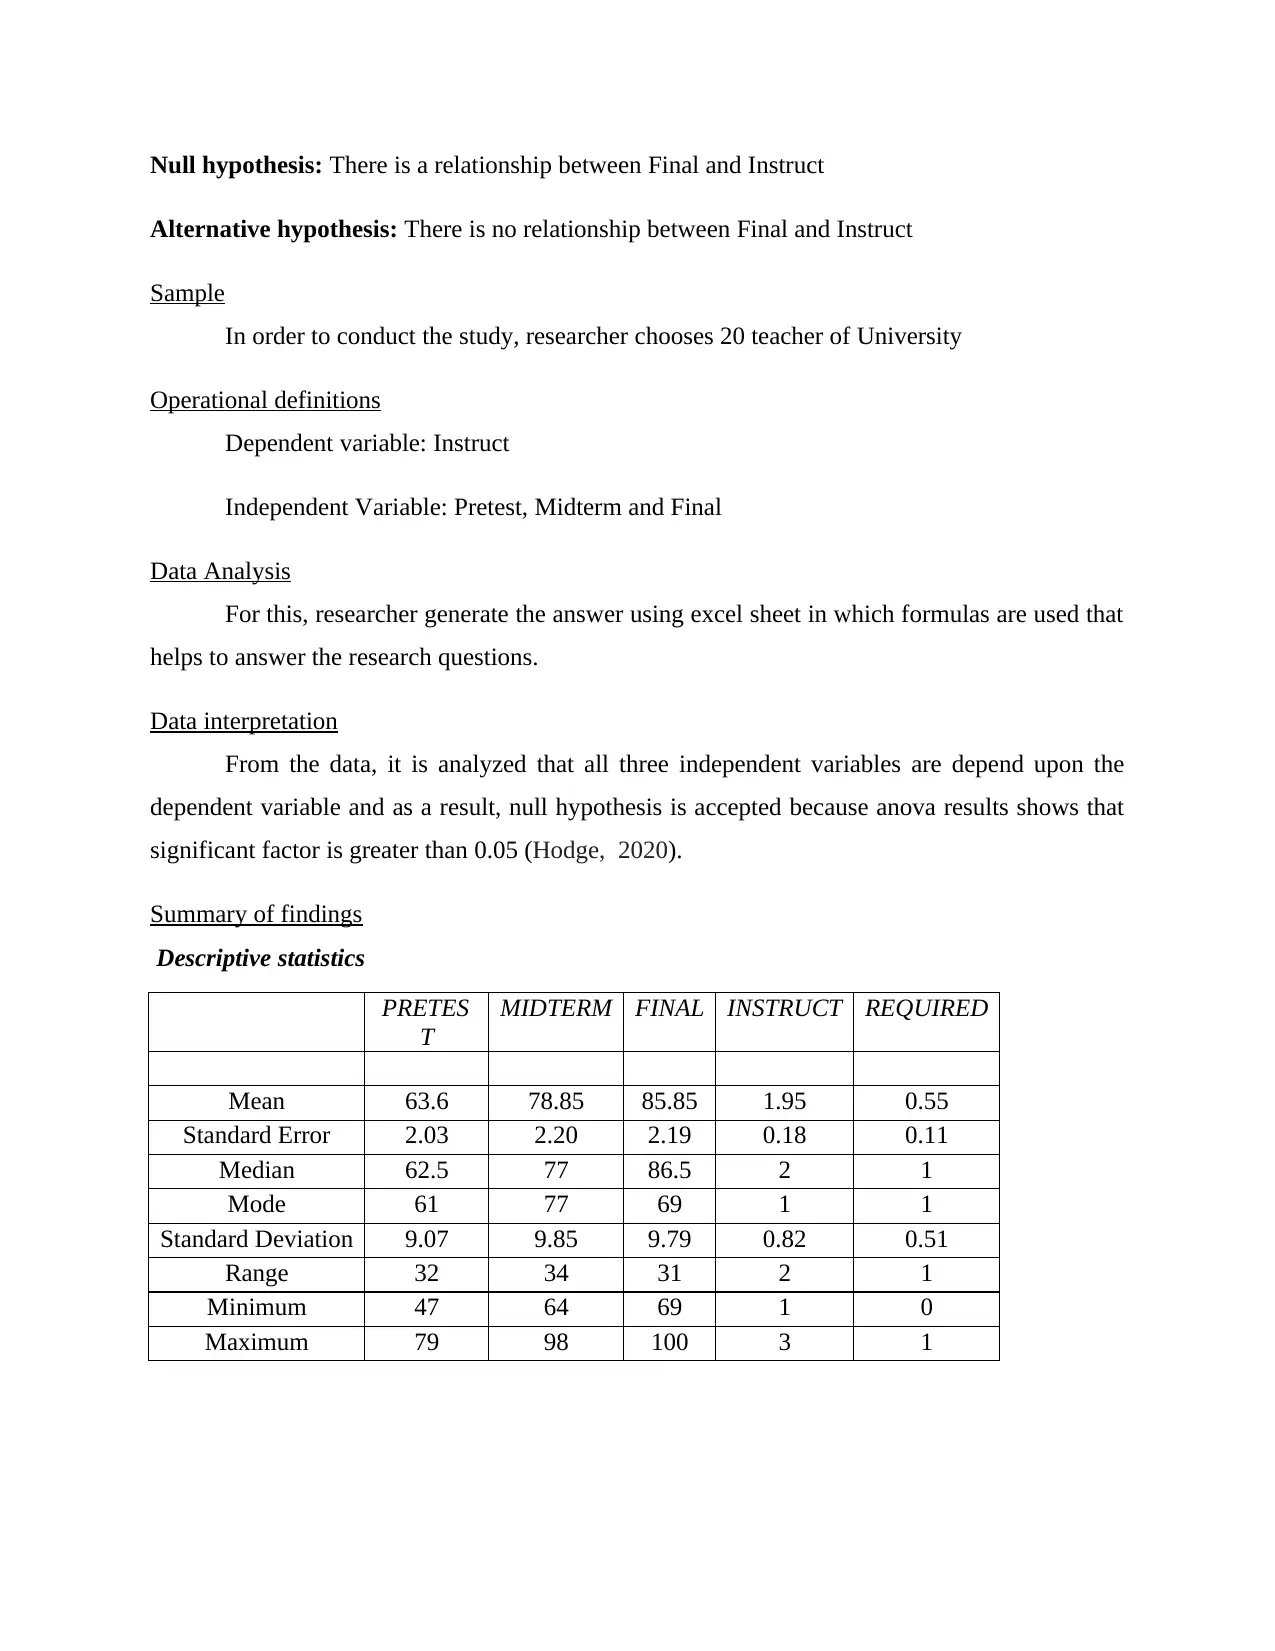
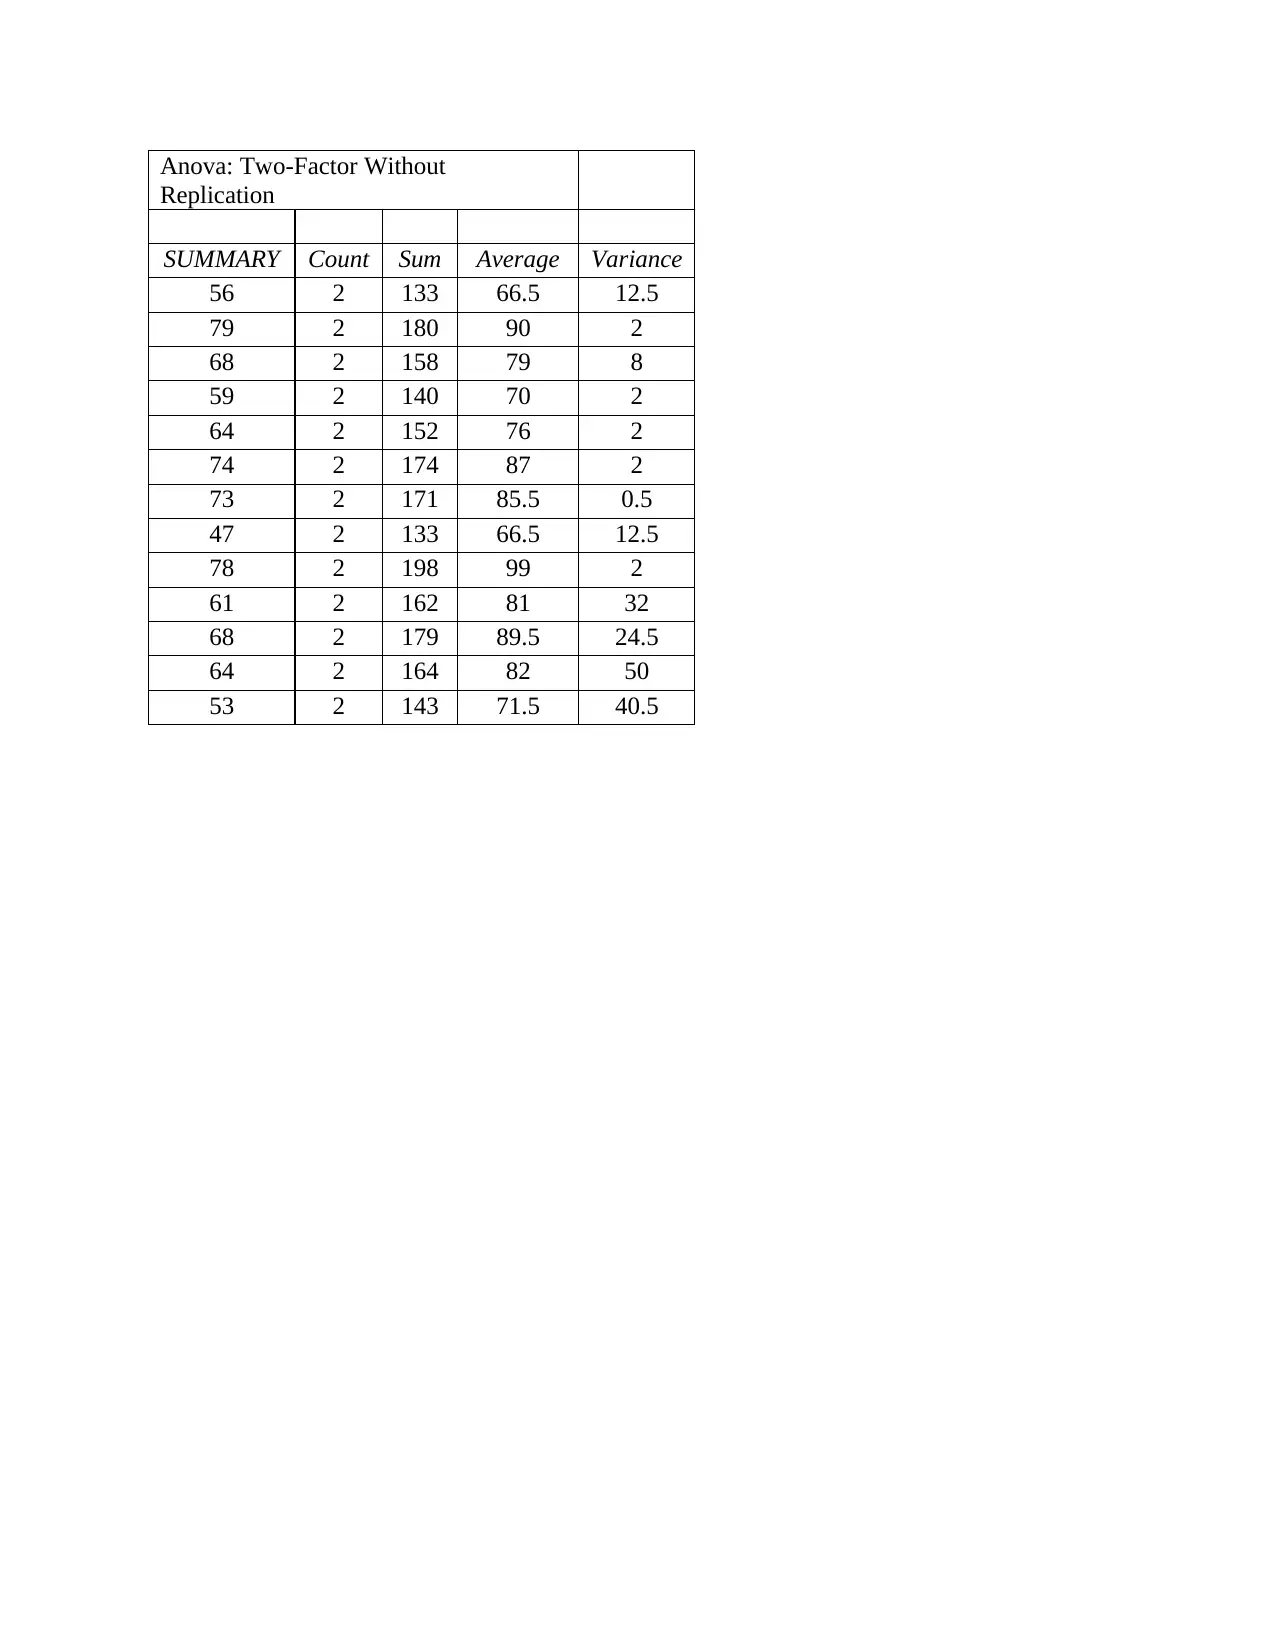
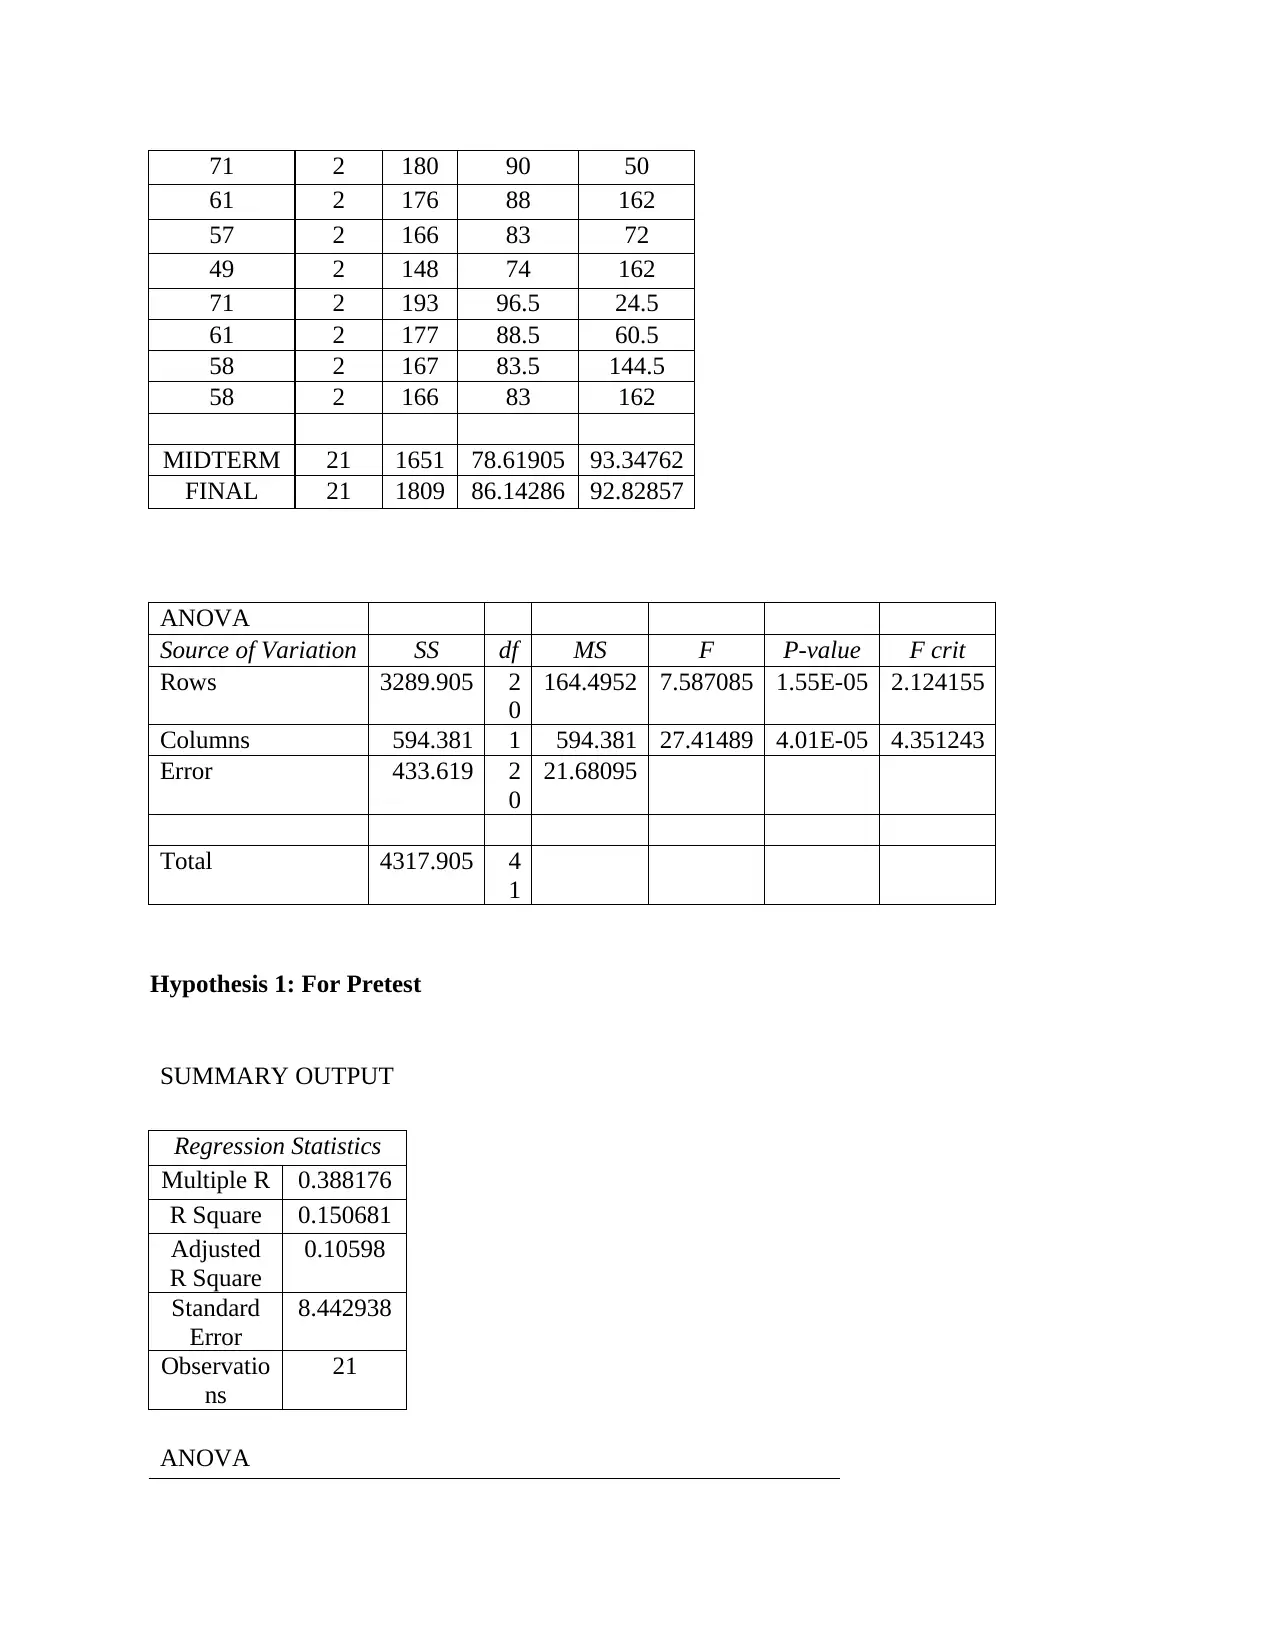
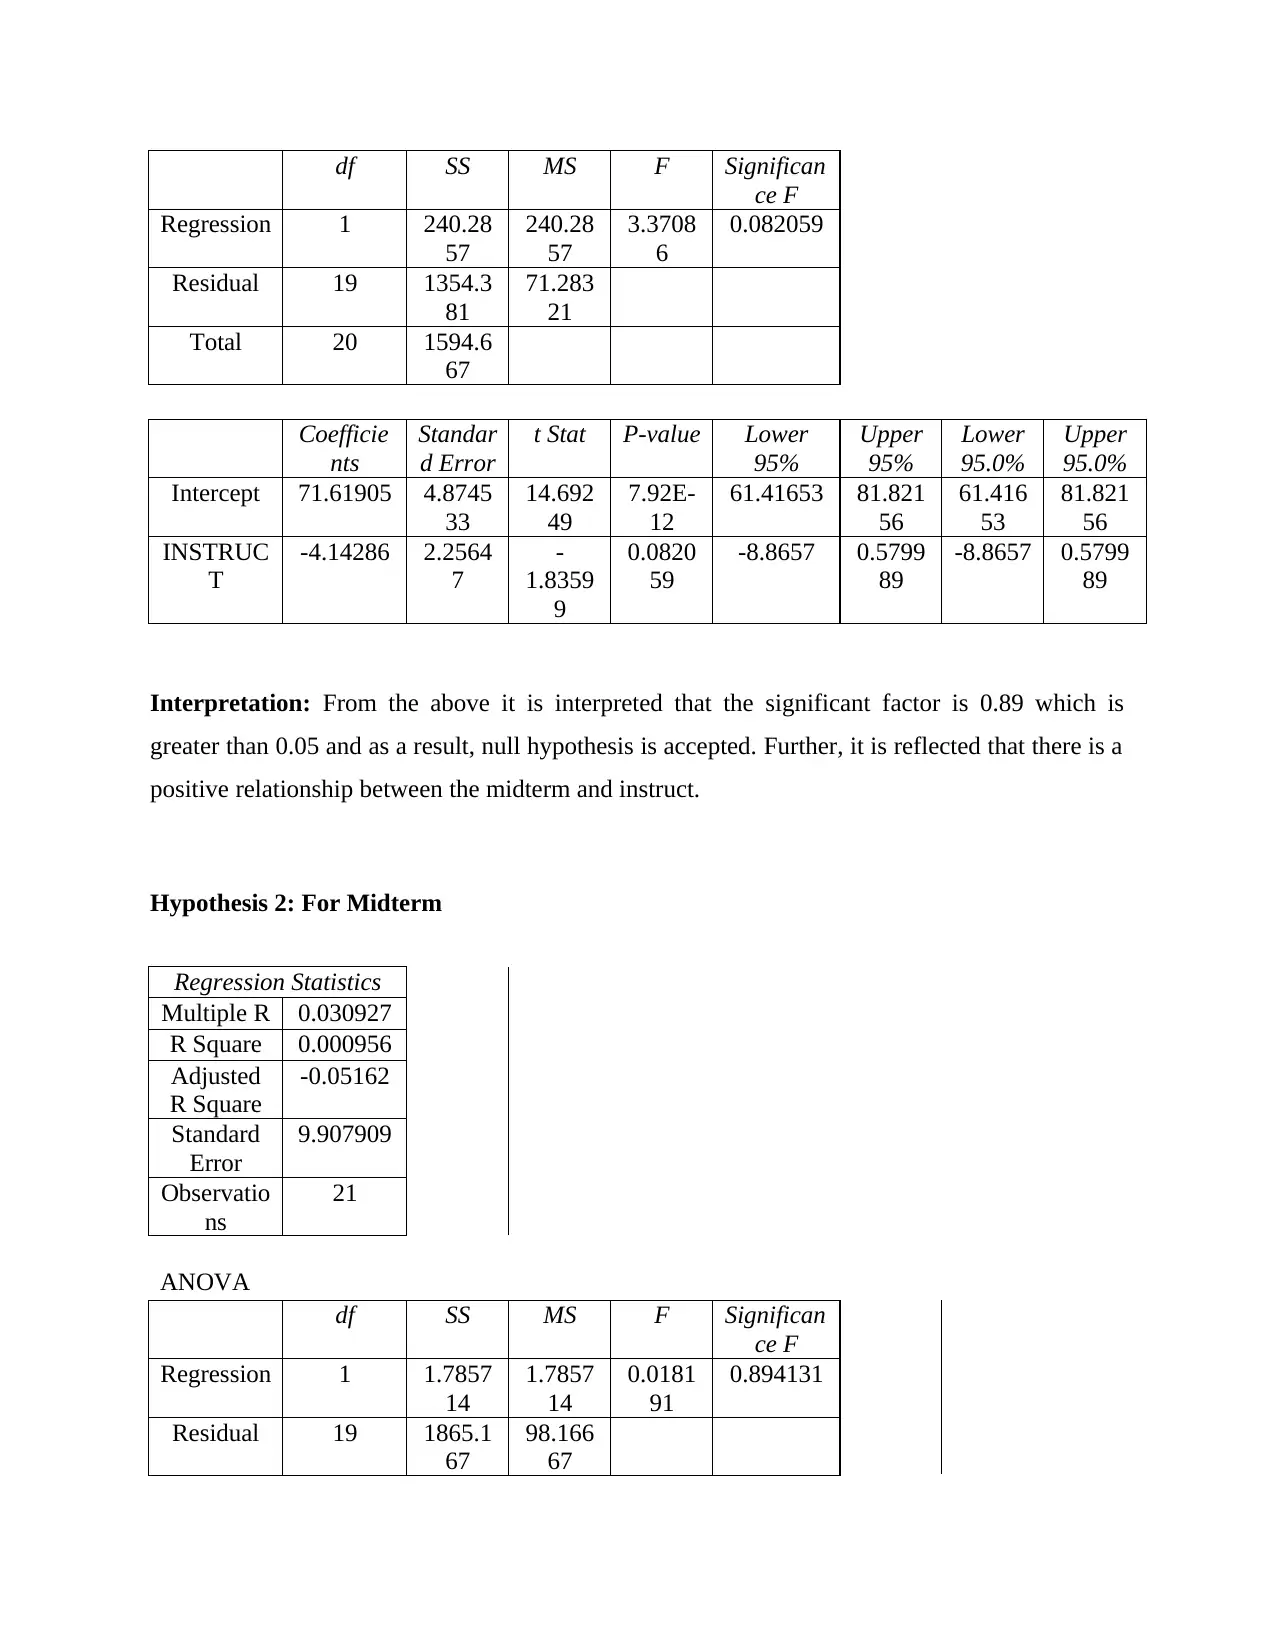
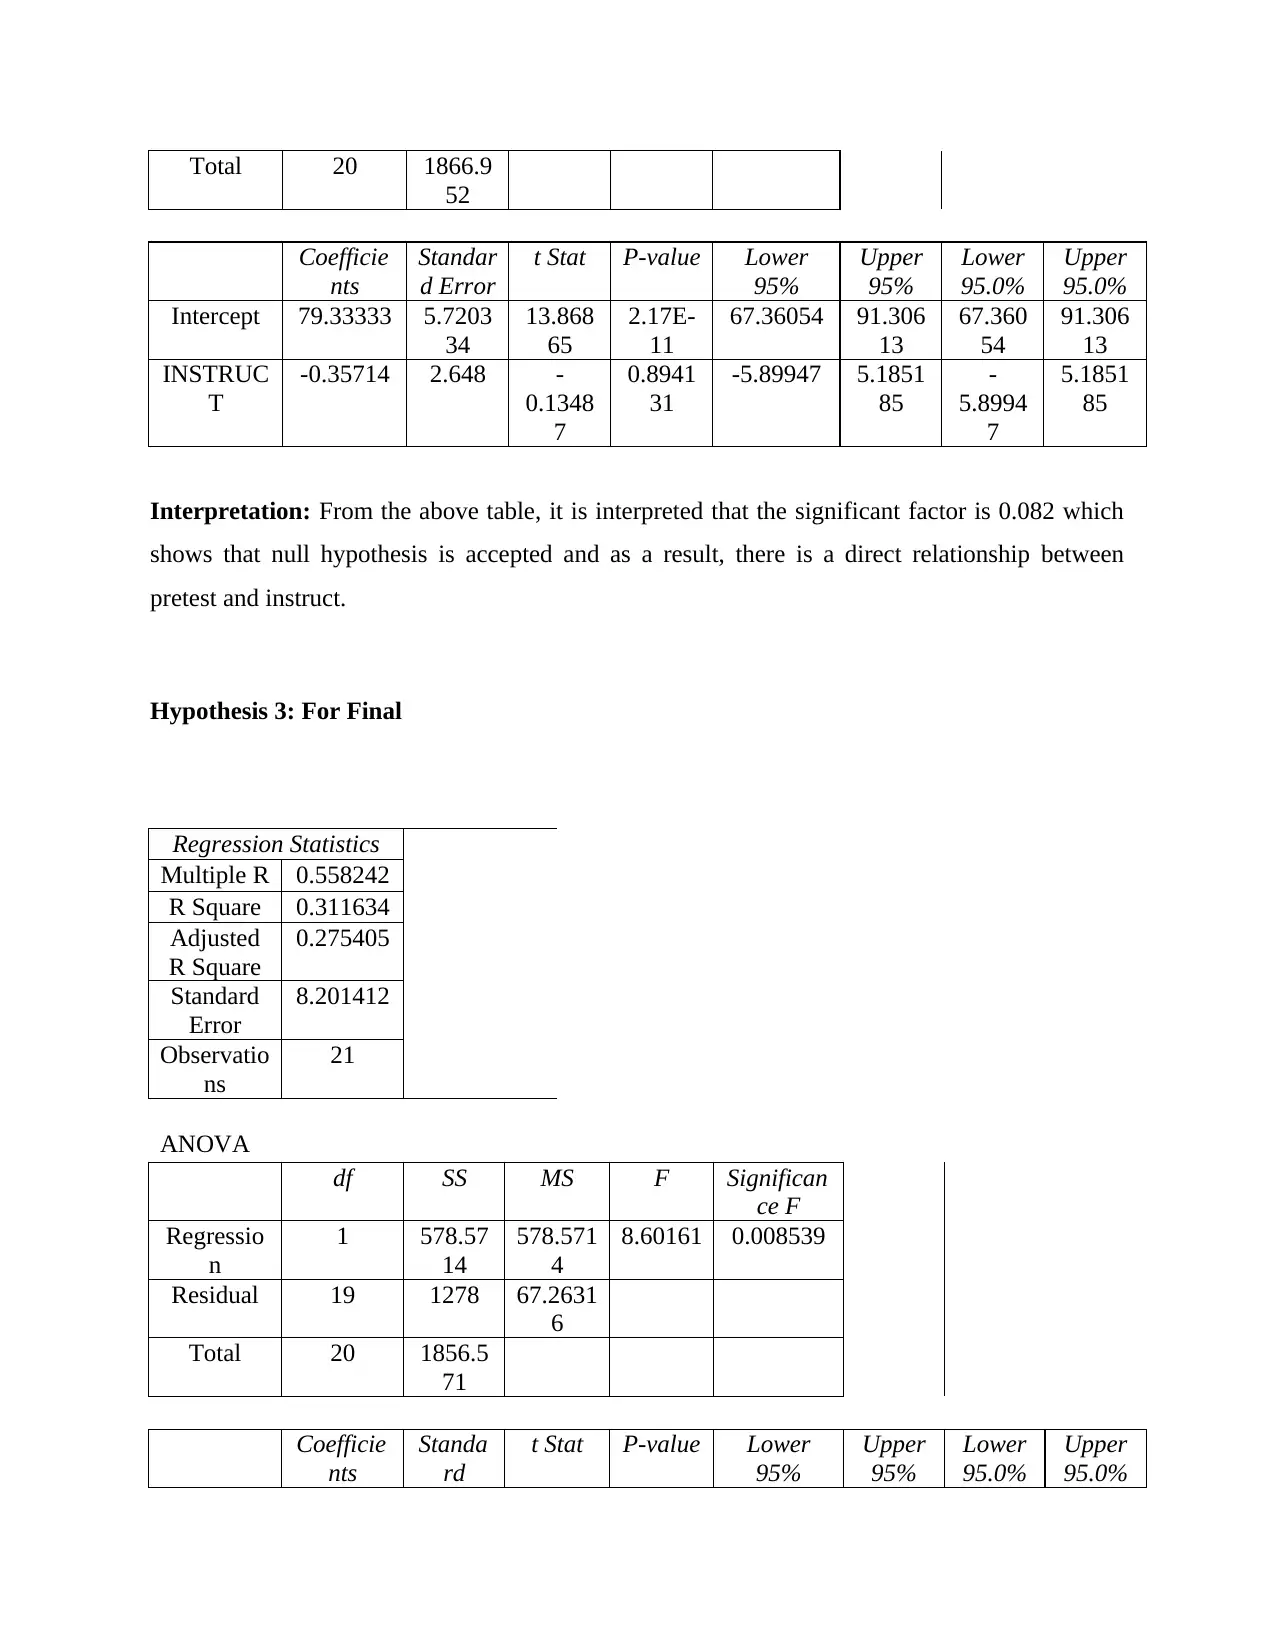
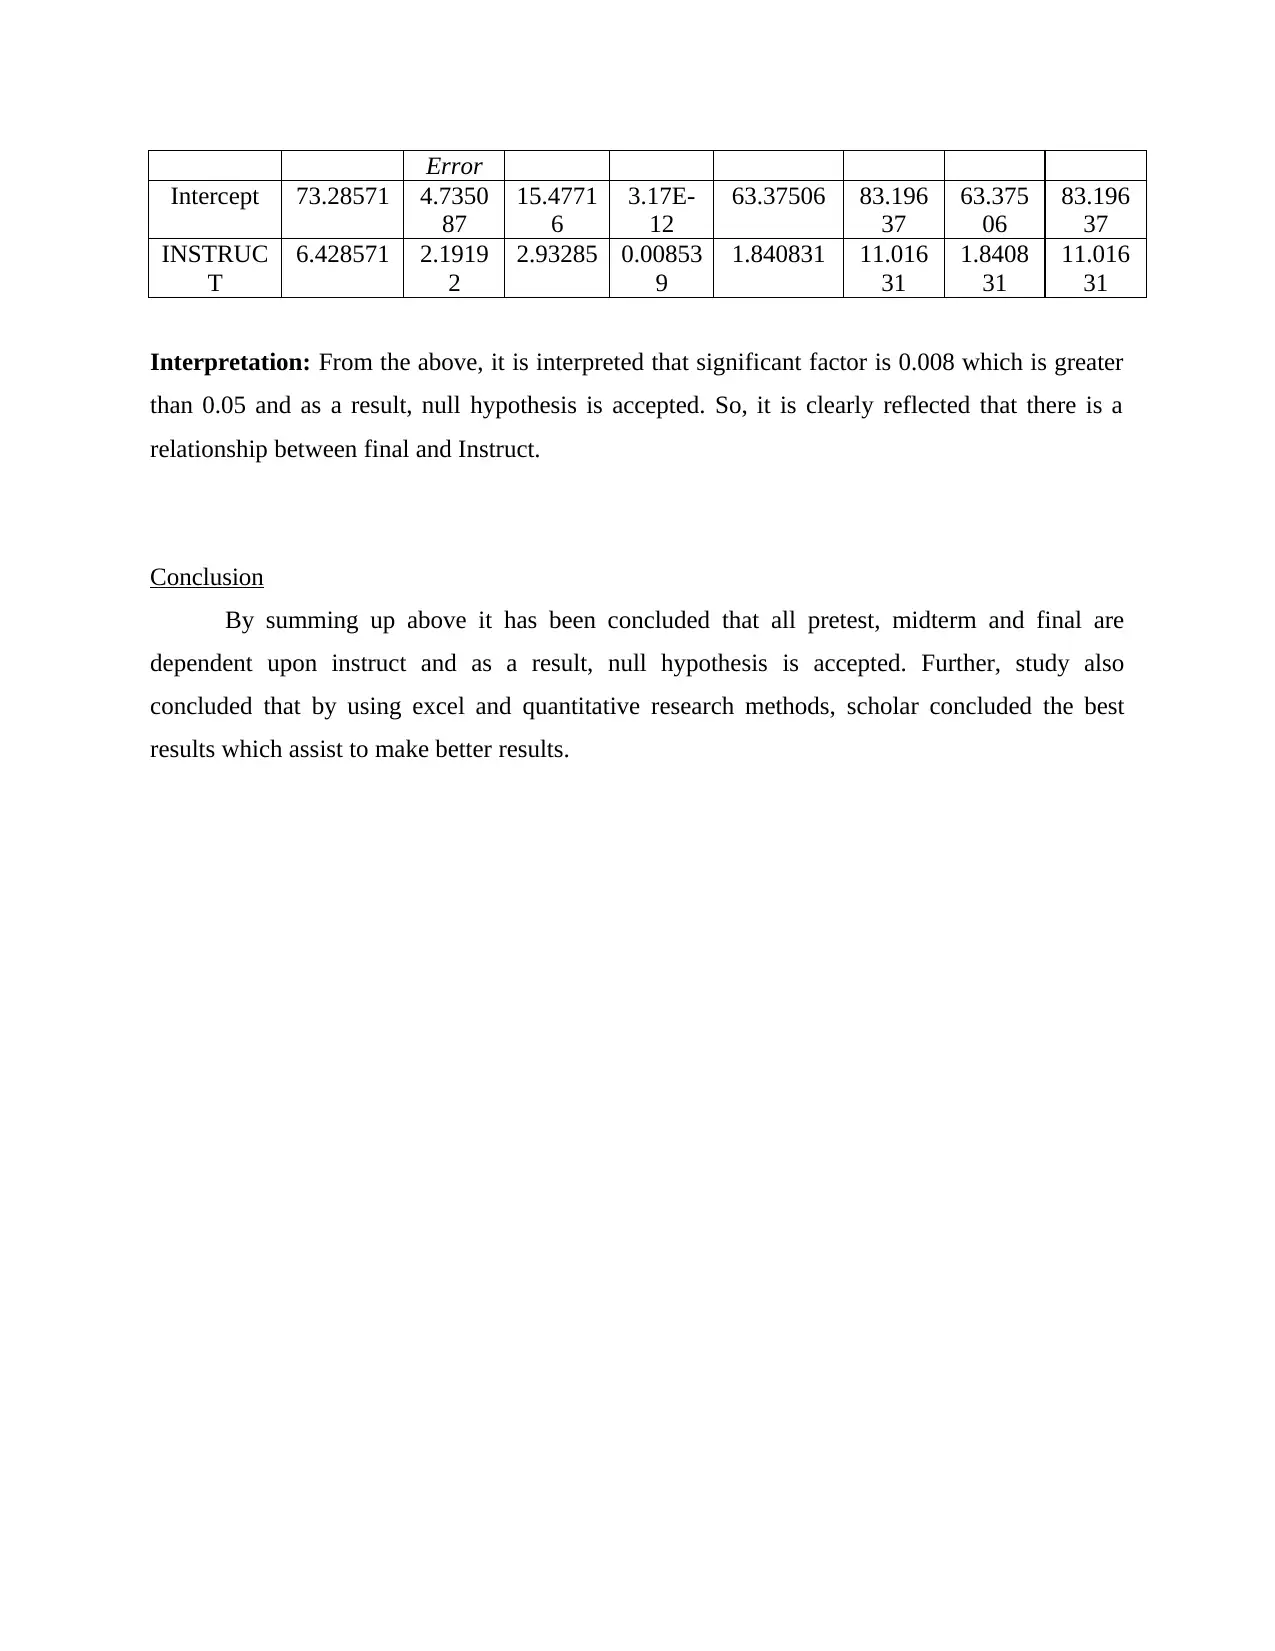
This SPSS project analyzes student performance data, focusing on the relationships between pretest, midterm, and final exam scores and an 'Instruct' variable. The project begins with an introduction, data source description, and verification of statistical assumptions, followed by the formulation of research questions and statistical hypotheses. The study utilizes a sample of 20 teachers and employs Excel for data analysis and SPSS for statistical tests, including descriptive statistics, ANOVA, and regression analysis. The findings reveal the acceptance of null hypotheses for pretest, midterm, and final, indicating a relationship between these variables and 'Instruct'. The report includes descriptive statistics, ANOVA tables, and regression outputs, along with interpretations of the results. The conclusion summarizes the findings and emphasizes the use of quantitative research methods and Excel for data analysis, highlighting the dependencies among the variables. The document also includes a detailed table of contents, references to relevant literature, and comprehensive data interpretation.

SPSS Project
Paraphrase This Document
Need a fresh take? Get an instant paraphrase of this document with our AI Paraphraser

Table of Contents
Introduction..................................................................................................................................2
Data source..................................................................................................................................2
Verification of statistical assumption..........................................................................................2
Research questions.......................................................................................................................2
Statistical hypothesis...................................................................................................................2
Sample.........................................................................................................................................3
Operational definitions................................................................................................................3
Data Analysis...............................................................................................................................3
Data interpretation.......................................................................................................................3
Summary of findings...................................................................................................................3
Conclusion...................................................................................................................................7
REFERENCES................................................................................................................................8

Introduction
The current study is based upon the data that is used to determine the test for the students
i.e. Pretest, midterm and final. For that, researcher describe the data resources which are used to
analyze the dependencies of two different factors. Also, the researcher present hypothesis and
for that researcher analyze the results as well.
Data source
The data sources are actually collected and this will help to determine the relationship
between dependent variable and independent variables (O'Cathain, 2020).
Verification of statistical assumption
In order to verify the assumption, researcher develop three hypothesis which assist to
examine whether the instruct is depend upon midterm, pretest and final (Ghauri, Grønhaug and
Strange, 2020).
Research questions
ï‚· What is relationship between pretest and instruct?
ï‚· What is relationship between midterm and instruct?
ï‚· What is relationship between final and instruct?
Statistical hypothesis
There are three statistical hypothesis used to the research
Hypothesis 1:
Null hypothesis: There is a statistical relationship between Pretest and Instruct
Alternative hypothesis: There is no statistical relationship between Pretest and Instruct
Hypothesis 2:
Null hypothesis: There is a statistical relationship between Midterm and Instruct
Alternative hypothesis: There is no statistical relationship between Midterm and Instruct
Hypothesis 3:
⊘ This is a preview!⊘
Do you want full access?
Subscribe today to unlock all pages.

Trusted by 1+ million students worldwide

Null hypothesis: There is a relationship between Final and Instruct
Alternative hypothesis: There is no relationship between Final and Instruct
Sample
In order to conduct the study, researcher chooses 20 teacher of University
Operational definitions
Dependent variable: Instruct
Independent Variable: Pretest, Midterm and Final
Data Analysis
For this, researcher generate the answer using excel sheet in which formulas are used that
helps to answer the research questions.
Data interpretation
From the data, it is analyzed that all three independent variables are depend upon the
dependent variable and as a result, null hypothesis is accepted because anova results shows that
significant factor is greater than 0.05 (Hodge, 2020).
Summary of findings
Descriptive statistics
PRETES
T
MIDTERM FINAL INSTRUCT REQUIRED
Mean 63.6 78.85 85.85 1.95 0.55
Standard Error 2.03 2.20 2.19 0.18 0.11
Median 62.5 77 86.5 2 1
Mode 61 77 69 1 1
Standard Deviation 9.07 9.85 9.79 0.82 0.51
Range 32 34 31 2 1
Minimum 47 64 69 1 0
Maximum 79 98 100 3 1
Paraphrase This Document
Need a fresh take? Get an instant paraphrase of this document with our AI Paraphraser

Anova: Two-Factor Without
Replication
SUMMARY Count Sum Average Variance
56 2 133 66.5 12.5
79 2 180 90 2
68 2 158 79 8
59 2 140 70 2
64 2 152 76 2
74 2 174 87 2
73 2 171 85.5 0.5
47 2 133 66.5 12.5
78 2 198 99 2
61 2 162 81 32
68 2 179 89.5 24.5
64 2 164 82 50
53 2 143 71.5 40.5
Replication
SUMMARY Count Sum Average Variance
56 2 133 66.5 12.5
79 2 180 90 2
68 2 158 79 8
59 2 140 70 2
64 2 152 76 2
74 2 174 87 2
73 2 171 85.5 0.5
47 2 133 66.5 12.5
78 2 198 99 2
61 2 162 81 32
68 2 179 89.5 24.5
64 2 164 82 50
53 2 143 71.5 40.5

71 2 180 90 50
61 2 176 88 162
57 2 166 83 72
49 2 148 74 162
71 2 193 96.5 24.5
61 2 177 88.5 60.5
58 2 167 83.5 144.5
58 2 166 83 162
MIDTERM 21 1651 78.61905 93.34762
FINAL 21 1809 86.14286 92.82857
ANOVA
Source of Variation SS df MS F P-value F crit
Rows 3289.905 2
0
164.4952 7.587085 1.55E-05 2.124155
Columns 594.381 1 594.381 27.41489 4.01E-05 4.351243
Error 433.619 2
0
21.68095
Total 4317.905 4
1
Hypothesis 1: For Pretest
SUMMARY OUTPUT
Regression Statistics
Multiple R 0.388176
R Square 0.150681
Adjusted
R Square
0.10598
Standard
Error
8.442938
Observatio
ns
21
ANOVA
⊘ This is a preview!⊘
Do you want full access?
Subscribe today to unlock all pages.

Trusted by 1+ million students worldwide

df SS MS F Significan
ce F
Regression 1 240.28
57
240.28
57
3.3708
6
0.082059
Residual 19 1354.3
81
71.283
21
Total 20 1594.6
67
Coefficie
nts
Standar
d Error
t Stat P-value Lower
95%
Upper
95%
Lower
95.0%
Upper
95.0%
Intercept 71.61905 4.8745
33
14.692
49
7.92E-
12
61.41653 81.821
56
61.416
53
81.821
56
INSTRUC
T
-4.14286 2.2564
7
-
1.8359
9
0.0820
59
-8.8657 0.5799
89
-8.8657 0.5799
89
Interpretation: From the above it is interpreted that the significant factor is 0.89 which is
greater than 0.05 and as a result, null hypothesis is accepted. Further, it is reflected that there is a
positive relationship between the midterm and instruct.
Hypothesis 2: For Midterm
Regression Statistics
Multiple R 0.030927
R Square 0.000956
Adjusted
R Square
-0.05162
Standard
Error
9.907909
Observatio
ns
21
ANOVA
df SS MS F Significan
ce F
Regression 1 1.7857
14
1.7857
14
0.0181
91
0.894131
Residual 19 1865.1
67
98.166
67
ce F
Regression 1 240.28
57
240.28
57
3.3708
6
0.082059
Residual 19 1354.3
81
71.283
21
Total 20 1594.6
67
Coefficie
nts
Standar
d Error
t Stat P-value Lower
95%
Upper
95%
Lower
95.0%
Upper
95.0%
Intercept 71.61905 4.8745
33
14.692
49
7.92E-
12
61.41653 81.821
56
61.416
53
81.821
56
INSTRUC
T
-4.14286 2.2564
7
-
1.8359
9
0.0820
59
-8.8657 0.5799
89
-8.8657 0.5799
89
Interpretation: From the above it is interpreted that the significant factor is 0.89 which is
greater than 0.05 and as a result, null hypothesis is accepted. Further, it is reflected that there is a
positive relationship between the midterm and instruct.
Hypothesis 2: For Midterm
Regression Statistics
Multiple R 0.030927
R Square 0.000956
Adjusted
R Square
-0.05162
Standard
Error
9.907909
Observatio
ns
21
ANOVA
df SS MS F Significan
ce F
Regression 1 1.7857
14
1.7857
14
0.0181
91
0.894131
Residual 19 1865.1
67
98.166
67
Paraphrase This Document
Need a fresh take? Get an instant paraphrase of this document with our AI Paraphraser

Total 20 1866.9
52
Coefficie
nts
Standar
d Error
t Stat P-value Lower
95%
Upper
95%
Lower
95.0%
Upper
95.0%
Intercept 79.33333 5.7203
34
13.868
65
2.17E-
11
67.36054 91.306
13
67.360
54
91.306
13
INSTRUC
T
-0.35714 2.648 -
0.1348
7
0.8941
31
-5.89947 5.1851
85
-
5.8994
7
5.1851
85
Interpretation: From the above table, it is interpreted that the significant factor is 0.082 which
shows that null hypothesis is accepted and as a result, there is a direct relationship between
pretest and instruct.
Hypothesis 3: For Final
Regression Statistics
Multiple R 0.558242
R Square 0.311634
Adjusted
R Square
0.275405
Standard
Error
8.201412
Observatio
ns
21
ANOVA
df SS MS F Significan
ce F
Regressio
n
1 578.57
14
578.571
4
8.60161 0.008539
Residual 19 1278 67.2631
6
Total 20 1856.5
71
Coefficie
nts
Standa
rd
t Stat P-value Lower
95%
Upper
95%
Lower
95.0%
Upper
95.0%

Error
Intercept 73.28571 4.7350
87
15.4771
6
3.17E-
12
63.37506 83.196
37
63.375
06
83.196
37
INSTRUC
T
6.428571 2.1919
2
2.93285 0.00853
9
1.840831 11.016
31
1.8408
31
11.016
31
Interpretation: From the above, it is interpreted that significant factor is 0.008 which is greater
than 0.05 and as a result, null hypothesis is accepted. So, it is clearly reflected that there is a
relationship between final and Instruct.
Conclusion
By summing up above it has been concluded that all pretest, midterm and final are
dependent upon instruct and as a result, null hypothesis is accepted. Further, study also
concluded that by using excel and quantitative research methods, scholar concluded the best
results which assist to make better results.
⊘ This is a preview!⊘
Do you want full access?
Subscribe today to unlock all pages.

Trusted by 1+ million students worldwide

REFERENCES
Books and Journals
Ghauri, P., Grønhaug, K. and Strange, R., 2020. Research methods in business studies.
Cambridge University Press.
Hodge, S.R., 2020. Quantitative research. Routledge Handbook of Adapted Physical Education.
O'Cathain, A., 2020. Mixed Methods Research. Qualitative Research in Health Care, pp.169-
180.
1 out of 10
Related Documents
Your All-in-One AI-Powered Toolkit for Academic Success.
 +13062052269
info@desklib.com
Available 24*7 on WhatsApp / Email
Unlock your academic potential
Copyright © 2020–2025 A2Z Services. All Rights Reserved. Developed and managed by ZUCOL.


