SPSS Coursework: Statistical Analysis and Interpretation

Verified

Added on  2023/01/03

|7
|741
|63
Homework Assignment
AI Summary
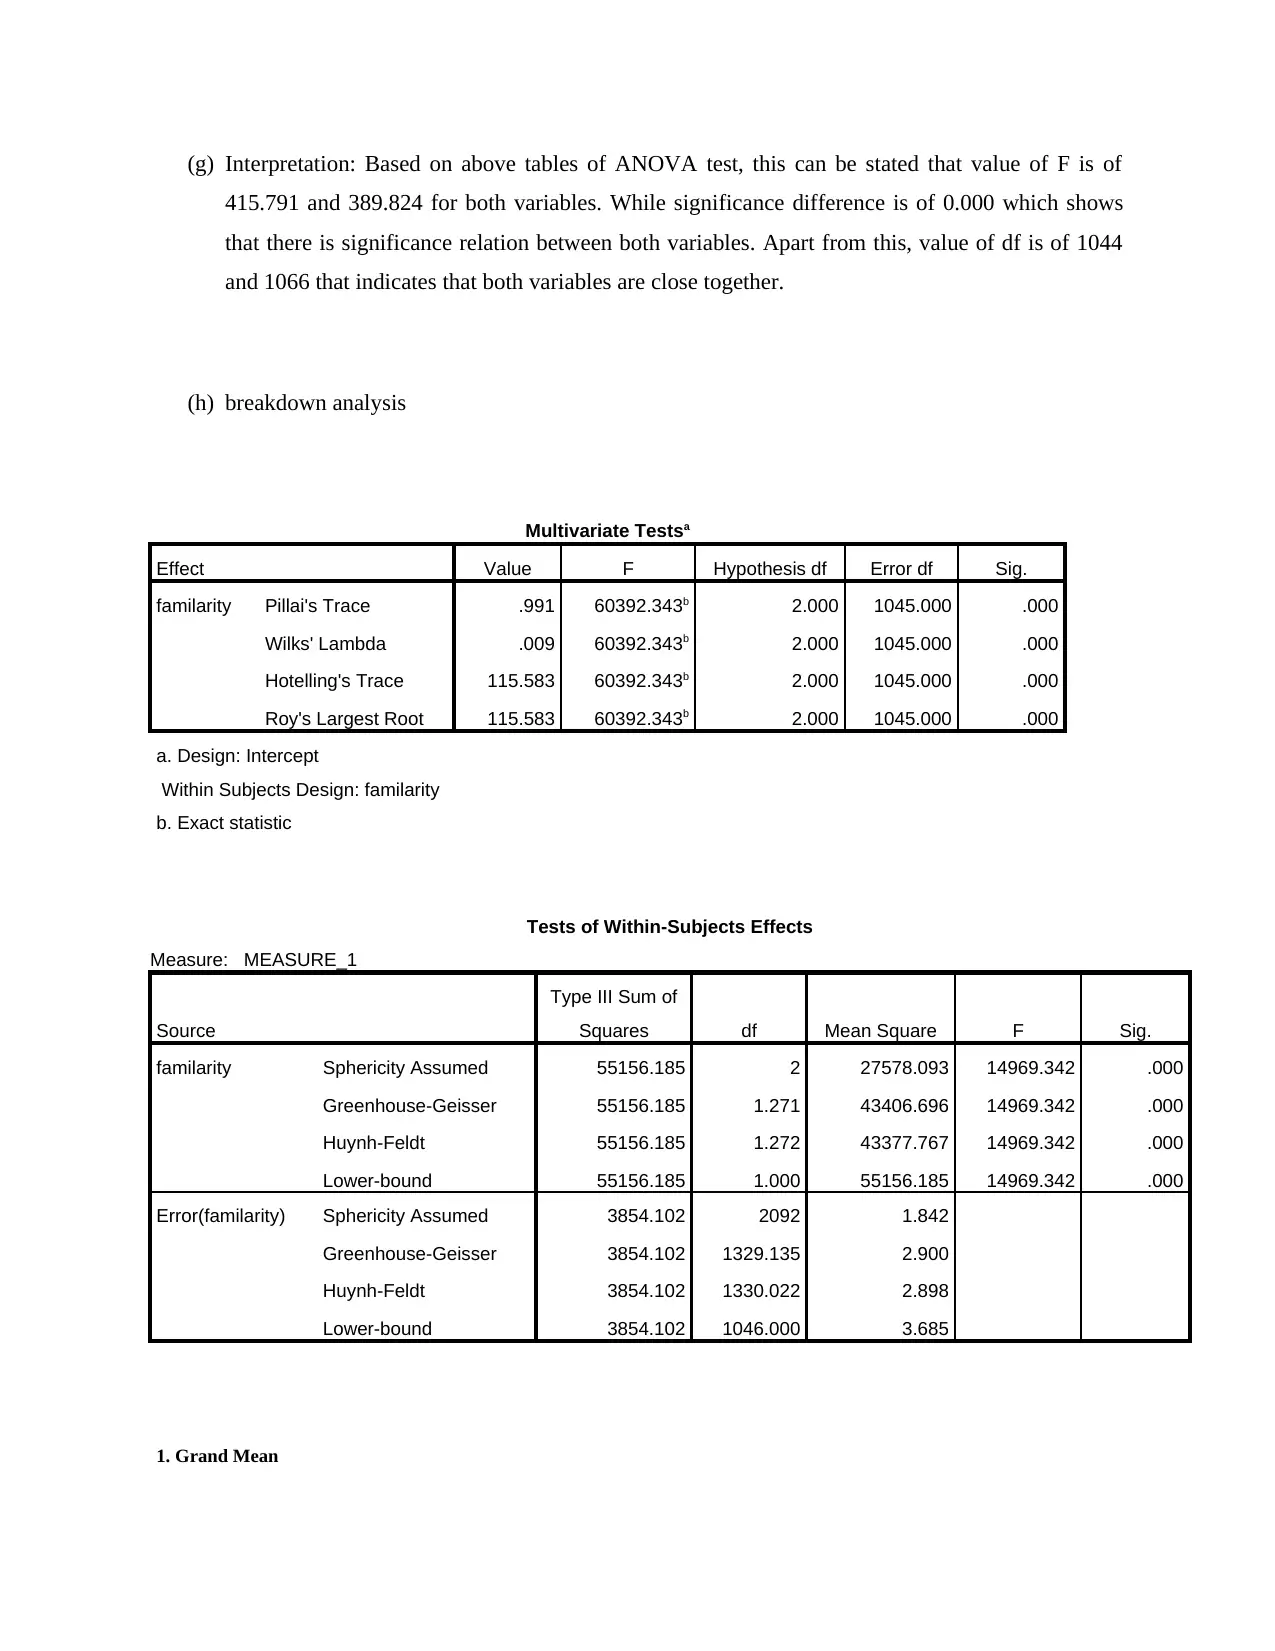
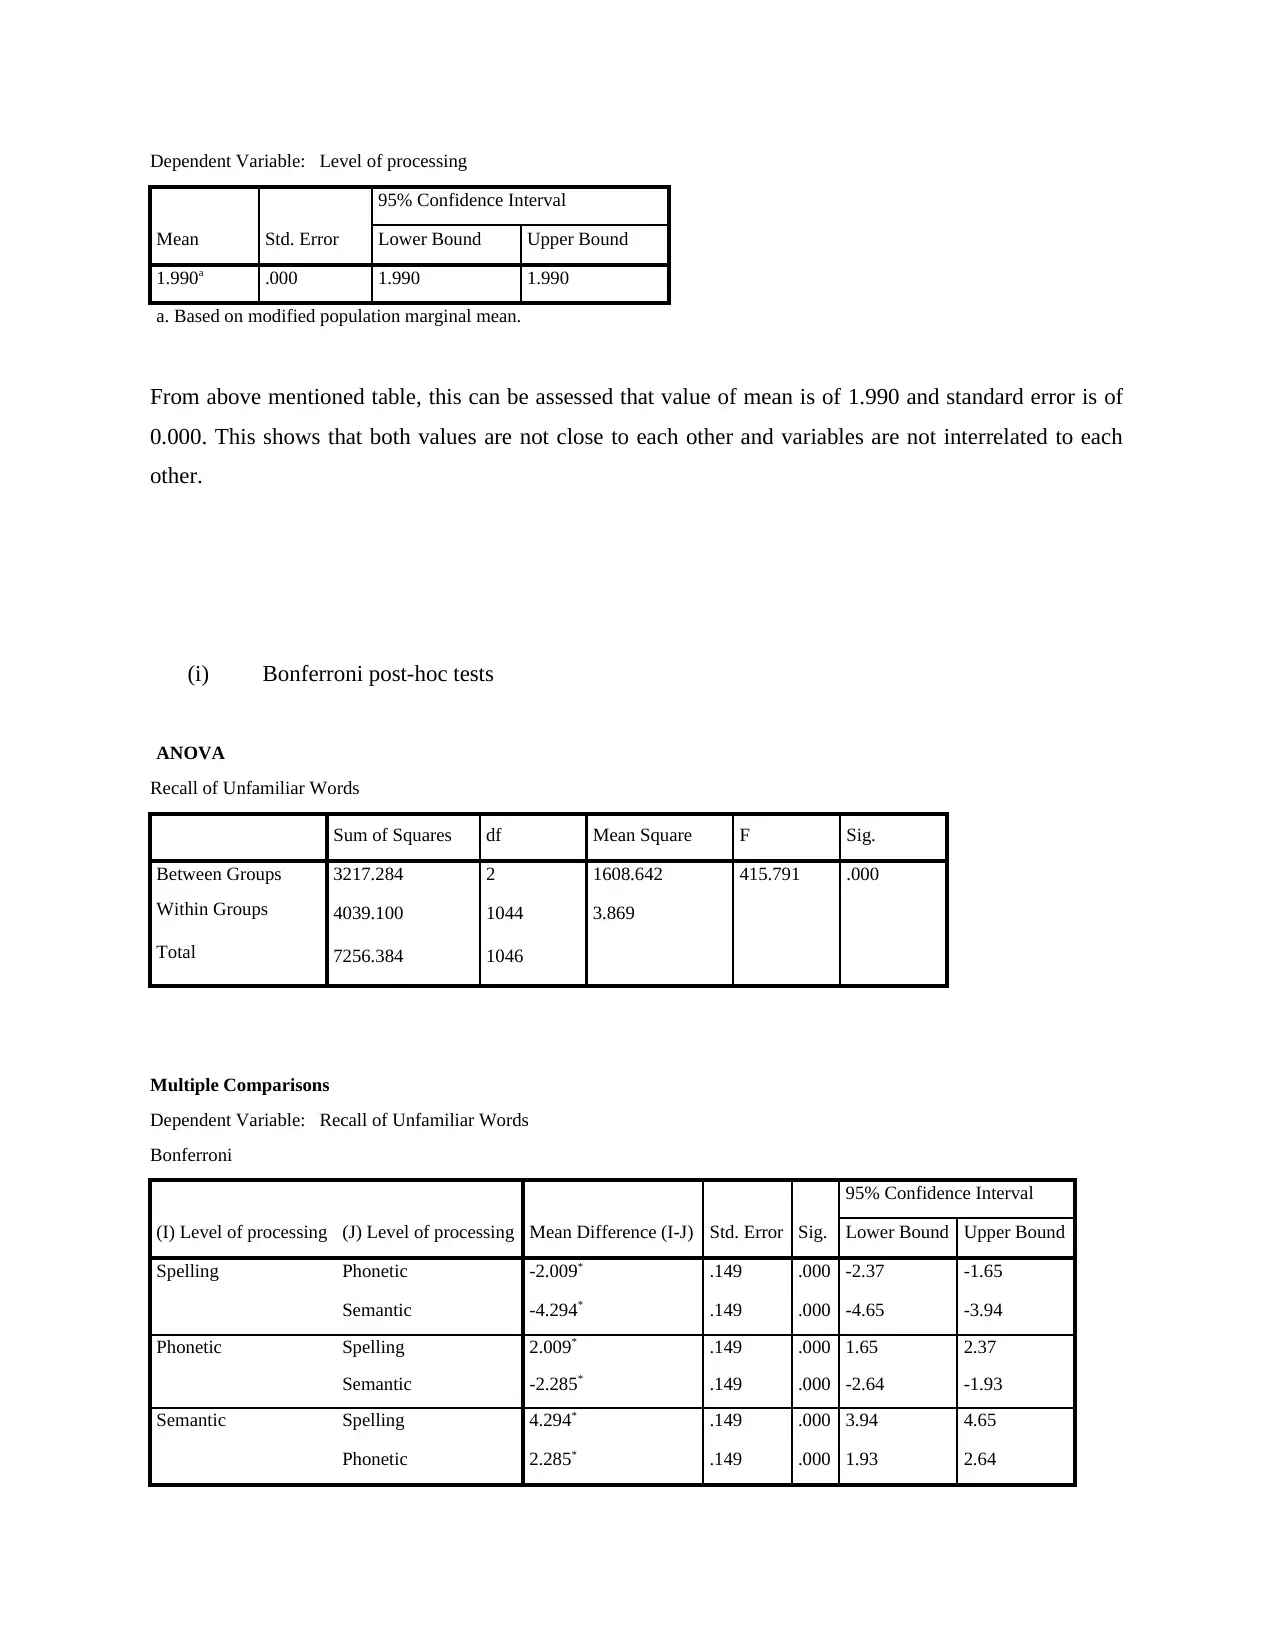
This SPSS coursework assignment solution provides a comprehensive analysis of data, including editing variables, outlining the experimental design, and considering relevant assumptions. It presents correlation analysis results, descriptive statistics, and a bar chart visualization. The solution includes ANOVA test results, multivariate tests, and Bonferroni post-hoc tests to determine the significance of relationships between variables. The interpretation of the results is also provided, highlighting key findings such as the F-values, significance levels, and mean differences, offering a thorough understanding of the statistical analysis and its implications. The document includes a detailed breakdown of the statistical findings, enabling students to grasp the core concepts of data analysis using SPSS.
Document Page
SPSS coursework
tabler-icon-diamond-filled.svg

Paraphrase This Document

Need a fresh take? Get an instant paraphrase of this document with our AI Paraphraser
Document Page
(a) Edit the variable LoP to give it a label “Level of Processing”.
(b) The design of the experiment in terms of factors, levels and between vs. within design.
Design of analysis between objects (or between factions): separate individuals assess each
situation, such that each participant is only subjected to a single user interface. Design of analysis
inside subjects (or repetitive indicators): the same individual checks all the criteria (i.e., the entire
user interfaces).
(c) In accordance of design, assumption which need to considered are that all data are normally
distributed as well as there is significance relation among variables. In order to assess this
assumption below a SPSS test has been applied in such manner:
Correlations
Recall of Familiar
Words
Recall of
Unfamiliar Words
Document Page
Recall of Familiar Words Pearson Correlation 1 .472**
Sig. (2-tailed) .000
N 1047 1047
Recall of Unfamiliar Words Pearson Correlation .472** 1
Sig. (2-tailed) .000
N 1047 1047
**. Correlation is significant at the 0.01 level (2-tailed).
The above table shows that there is significant relation both variables as value of correlation is of
0.472 that is more than 0.3.
(d) Descriptive statistics.
(e) Bar chart in SPSS showing 95%
Confidence Intervals as Error Bars.
Statistics
Recall of Familiar
Words
Recall of
Unfamiliar Words
N Valid 1047 1047
Missing 0 0
Mean 12.00 8.98
Median 12.05 8.97
Mode 8a 2a
Std. Deviation 1.266 2.634
a. Multiple modes exist. The smallest value is shown
Document Page
(f) ANOVA test
tabler-icon-diamond-filled.svg

Paraphrase This Document

Need a fresh take? Get an instant paraphrase of this document with our AI Paraphraser
Document Page
(g) Interpretation: Based on above tables of ANOVA test, this can be stated that value of F is of
415.791 and 389.824 for both variables. While significance difference is of 0.000 which shows
that there is significance relation between both variables. Apart from this, value of df is of 1044
and 1066 that indicates that both variables are close together.
(h) breakdown analysis
Multivariate Testsa
Effect Value F Hypothesis df Error df Sig.
familarity Pillai's Trace .991 60392.343b 2.000 1045.000 .000
Wilks' Lambda .009 60392.343b 2.000 1045.000 .000
Hotelling's Trace 115.583 60392.343b 2.000 1045.000 .000
Roy's Largest Root 115.583 60392.343b 2.000 1045.000 .000
a. Design: Intercept
Within Subjects Design: familarity
b. Exact statistic
Tests of Within-Subjects Effects
Measure: MEASURE_1
Source
Type III Sum of
Squares df Mean Square F Sig.
familarity Sphericity Assumed 55156.185 2 27578.093 14969.342 .000
Greenhouse-Geisser 55156.185 1.271 43406.696 14969.342 .000
Huynh-Feldt 55156.185 1.272 43377.767 14969.342 .000
Lower-bound 55156.185 1.000 55156.185 14969.342 .000
Error(familarity) Sphericity Assumed 3854.102 2092 1.842
Greenhouse-Geisser 3854.102 1329.135 2.900
Huynh-Feldt 3854.102 1330.022 2.898
Lower-bound 3854.102 1046.000 3.685
1. Grand Mean
Document Page
Dependent Variable: Level of processing
Mean Std. Error
95% Confidence Interval
Lower Bound Upper Bound
1.990a .000 1.990 1.990
a. Based on modified population marginal mean.
From above mentioned table, this can be assessed that value of mean is of 1.990 and standard error is of
0.000. This shows that both values are not close to each other and variables are not interrelated to each
other.
(i) Bonferroni post-hoc tests
ANOVA
Recall of Unfamiliar Words
Sum of Squares df Mean Square F Sig.
Between Groups 3217.284 2 1608.642 415.791 .000
Within Groups 4039.100 1044 3.869
Total 7256.384 1046
Multiple Comparisons
Dependent Variable: Recall of Unfamiliar Words
Bonferroni
(I) Level of processing (J) Level of processing Mean Difference (I-J) Std. Error Sig.
95% Confidence Interval
Lower Bound Upper Bound
Spelling Phonetic -2.009* .149 .000 -2.37 -1.65
Semantic -4.294* .149 .000 -4.65 -3.94
Phonetic Spelling 2.009* .149 .000 1.65 2.37
Semantic -2.285* .149 .000 -2.64 -1.93
Semantic Spelling 4.294* .149 .000 3.94 4.65
Phonetic 2.285* .149 .000 1.93 2.64
Document Page
*. The mean difference is significant at the 0.05 level.
On the basis of above table, this can be stated that there is significant relation between both variables
because value of significance difference is of 0.00 which is less than 0.05.
chevron_up_icon
1 out of 7
circle_padding
hide_on_mobile
zoom_out_icon
[object Object]