Statistics and Probability Homework: SPSS Analysis and Interpretation
VerifiedAdded on  2023/02/03
|16
|1866
|25
Homework Assignment
AI Summary
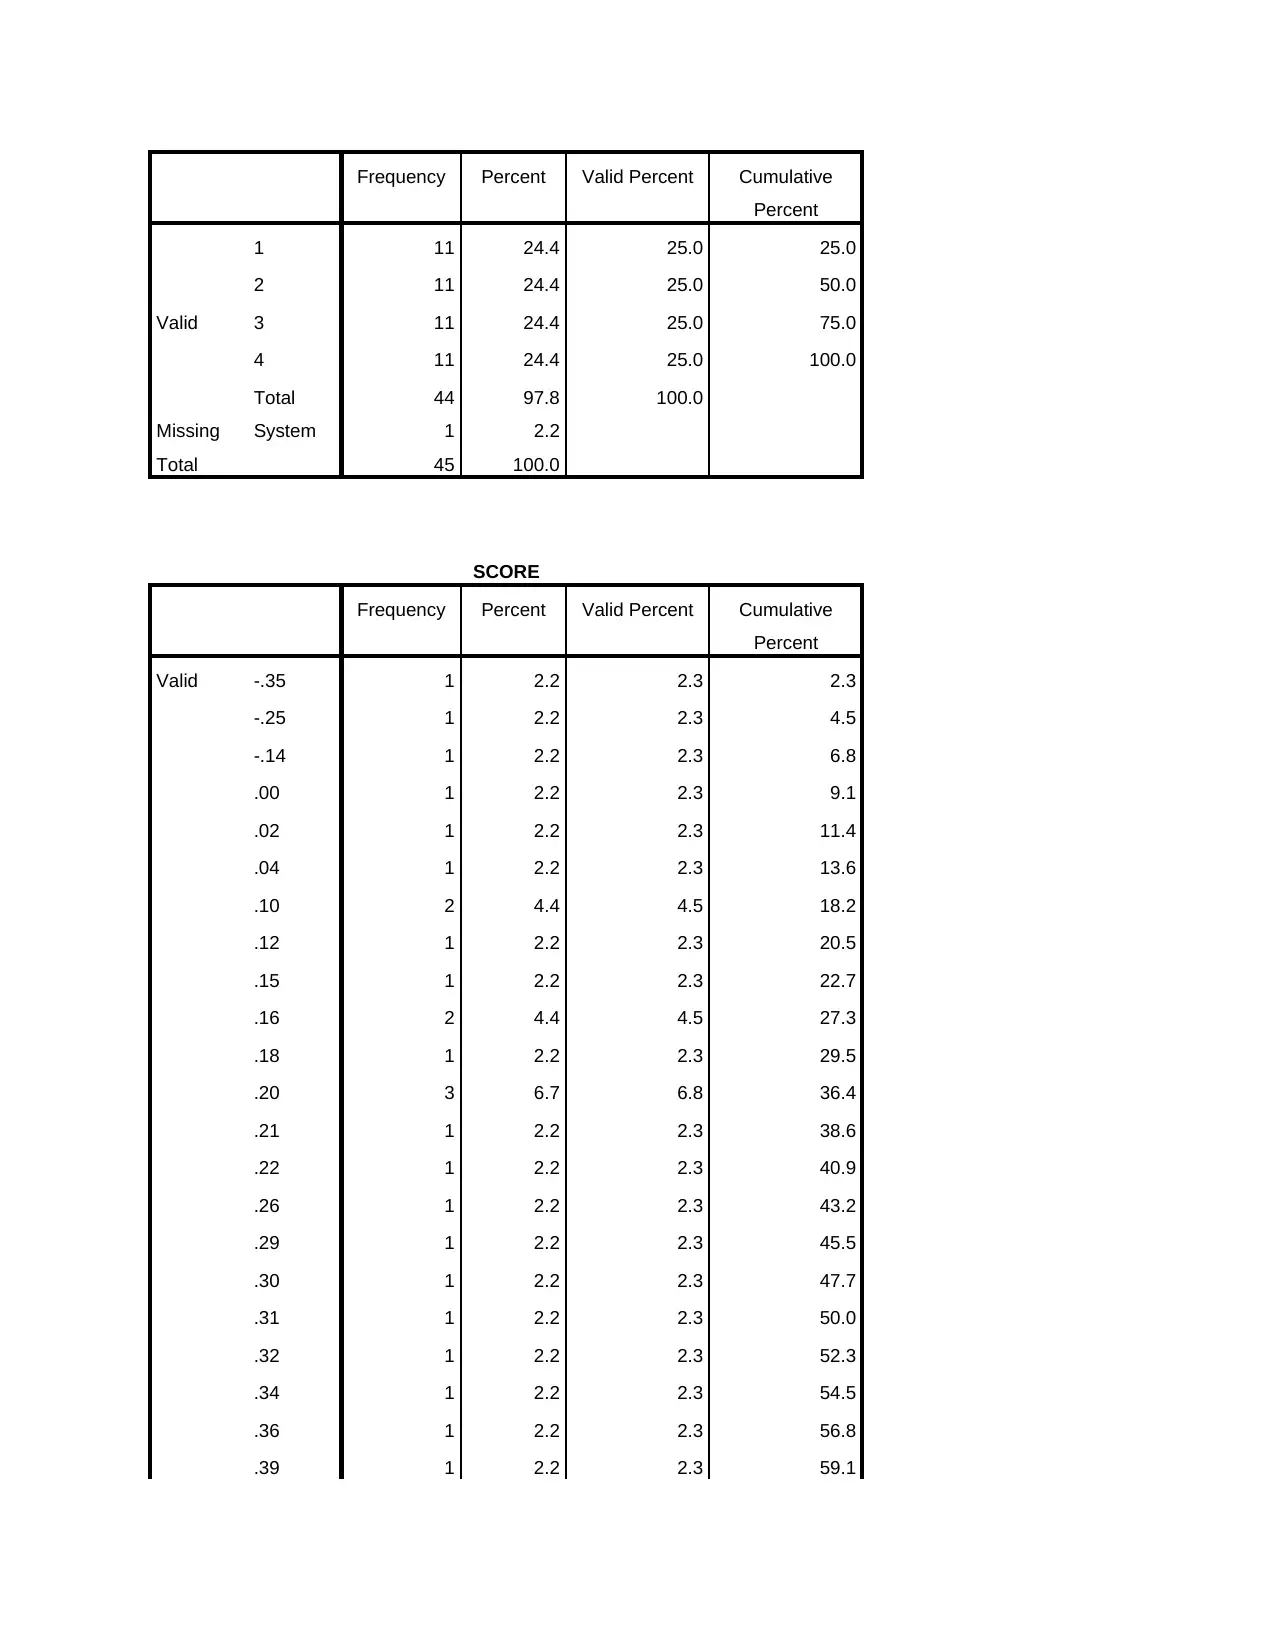
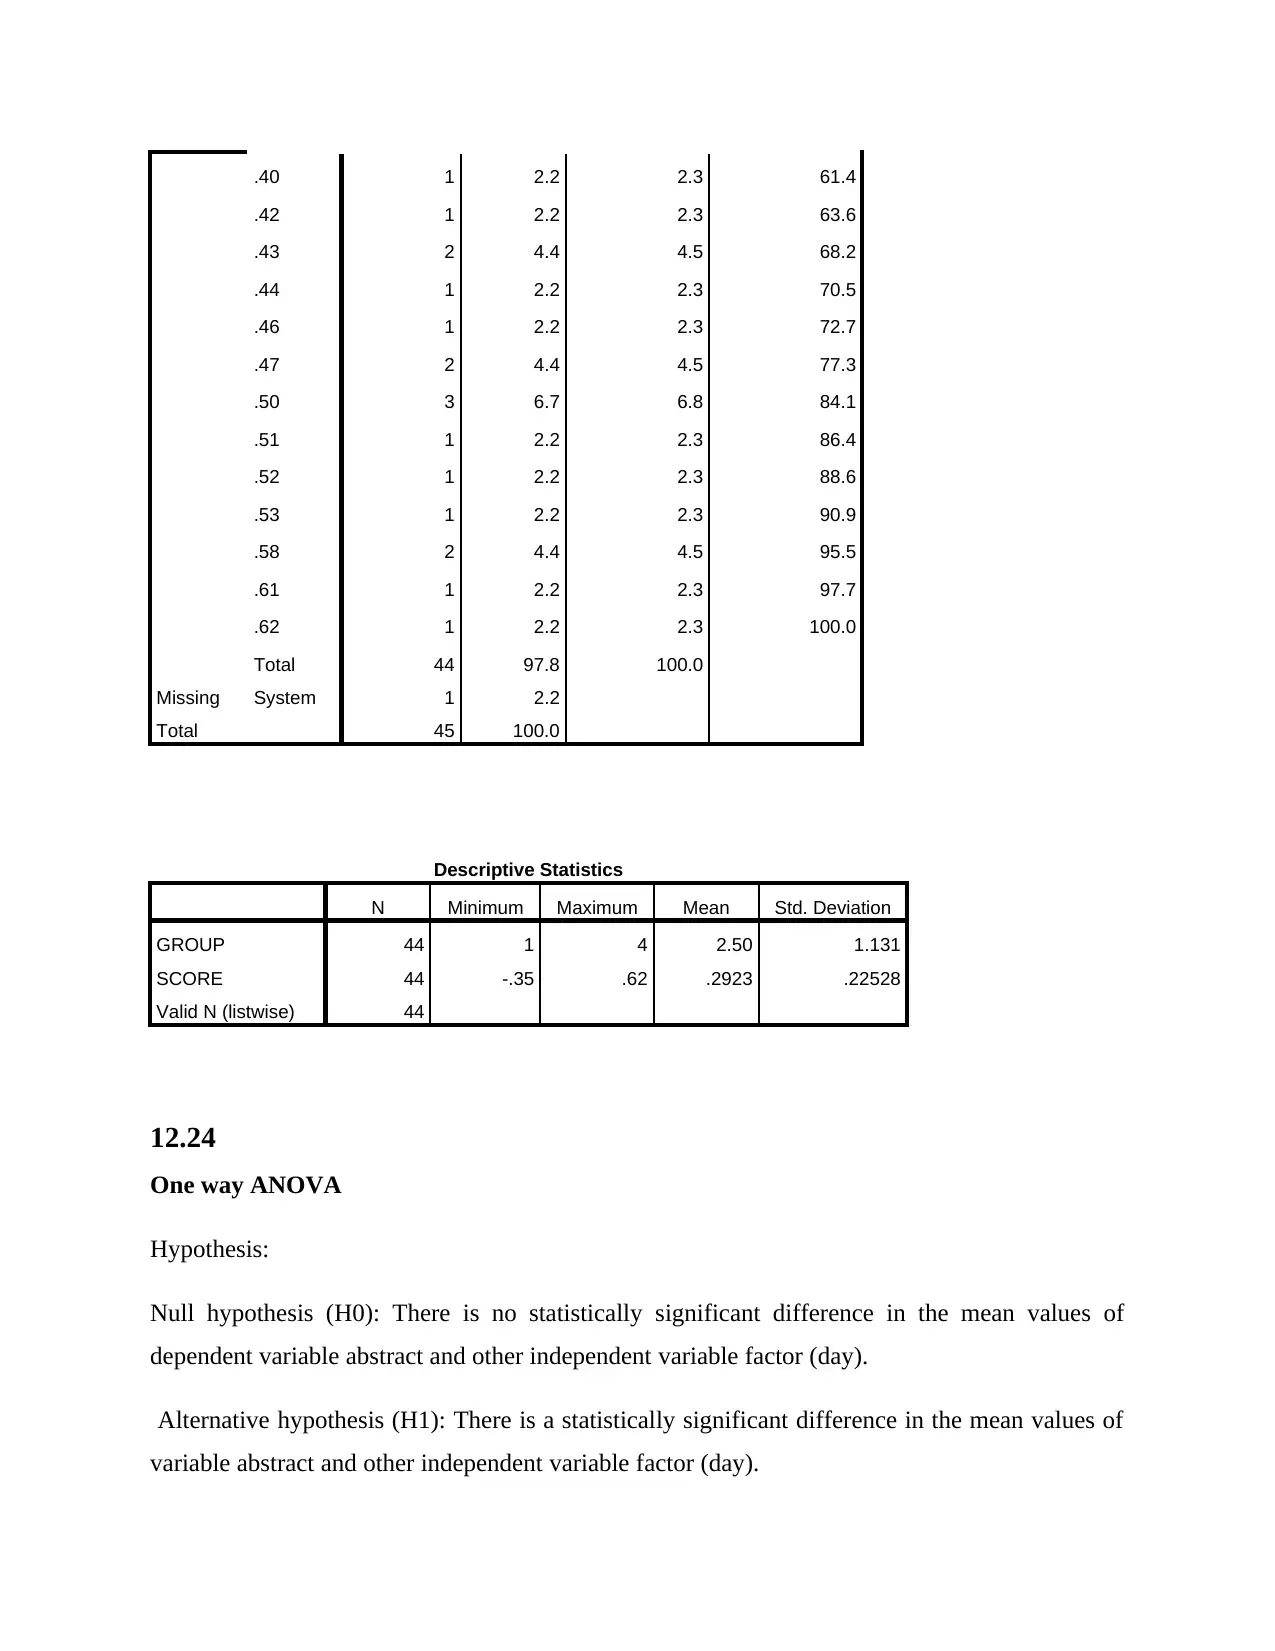
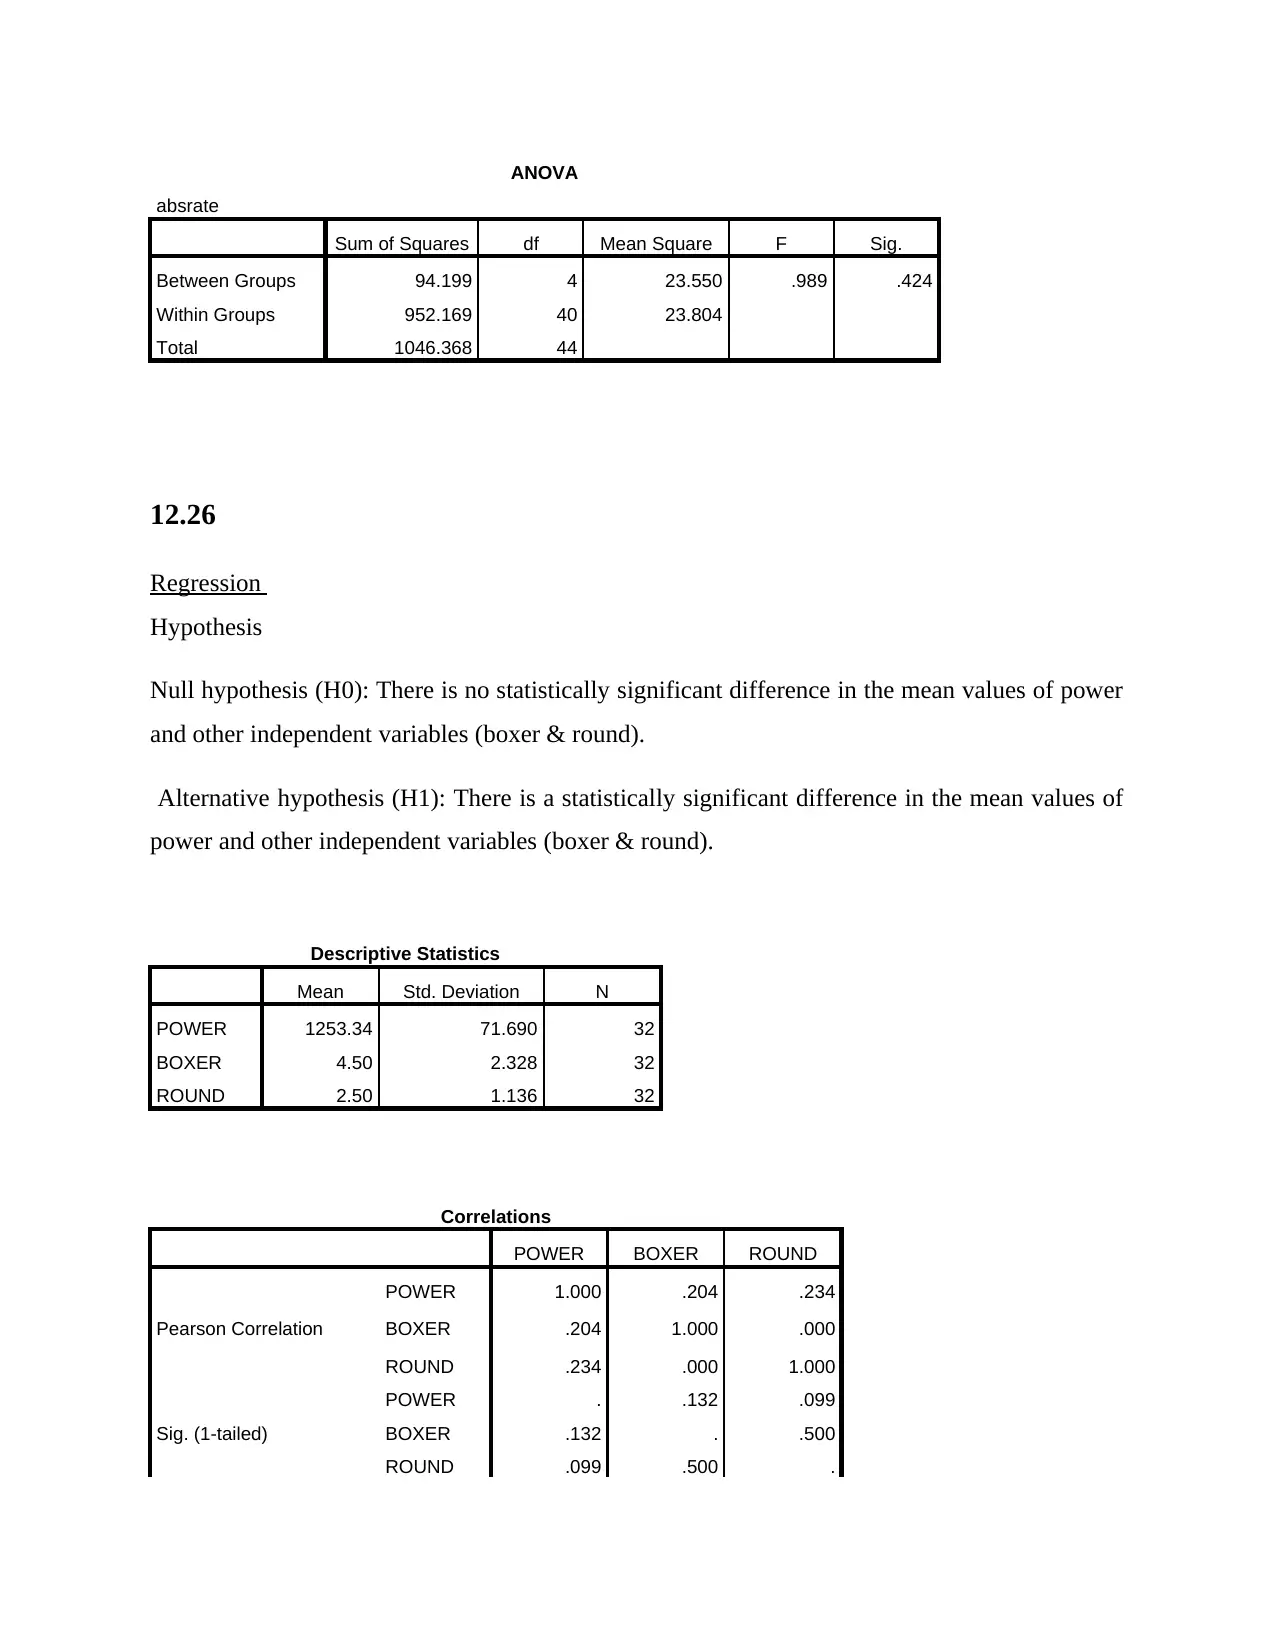
This homework assignment presents a comprehensive analysis of statistical data using SPSS. The student addresses various problems, including regression analysis, ANOVA, and t-tests. Each section includes a description of the problem, the specific questions being answered, and the relevant SPSS outputs (tables, graphs). The student interprets the outputs, providing the relevant statistical values (F-values, R^2 values, etc.) to support their conclusions. The assignment covers hypothesis testing, identifying statistically significant differences between variables, and analyzing means. The student applies these techniques to different datasets, demonstrating a strong understanding of statistical concepts and their practical application using SPSS. The document adheres to APA formatting, including a title page, table of contents, page numbers, and an honesty statement.

SPSS
Paraphrase This Document
Need a fresh take? Get an instant paraphrase of this document with our AI Paraphraser

TABLE OF CONTENTS
12.2..................................................................................................................................................3
Regression....................................................................................................................................3
12.4..................................................................................................................................................6
A..................................................................................................................................................6
12.12................................................................................................................................................7
A. Implication of experimental technique to be used in analyzing the outcomes.......................7
B. Analyzing the means of variables...........................................................................................7
12.14................................................................................................................................................8
A. Identification of the treatment to be followed........................................................................8
12.22................................................................................................................................................8
SAS..............................................................................................................................................9
12.24..............................................................................................................................................11
12.26..............................................................................................................................................12
Regression..................................................................................................................................12
12.36..............................................................................................................................................14
Regression..................................................................................................................................14
REFERENCES..............................................................................................................................16

12.2
Regression
Hypothesis:
Null hypothesis (H0): There is no statistically significant difference in the mean values of
dependent variable round and independent variable power
Alternative hypothesis (H1): There is a statistically significant difference in the mean values of
dependent variable round and independent variable power
Variables Entered/Removeda
Model Variables
Entered
Variables
Removed
Method
1 POWERb . Enter
a. Dependent Variable: ROUND
b. All requested variables entered.
Model Summaryb
Model R R Square Adjusted R
Square
Std. Error of the
Estimate
Durbin-Watson
1 .234a .055 .023 1.123 .214
a. Predictors: (Constant), POWER
b. Dependent Variable: ROUND
ANOVAa
Model Sum of Squares df Mean Square F Sig.
1
Regression 2.181 1 2.181 1.730 .198b
Residual 37.819 30 1.261
Total 40.000 31
a. Dependent Variable: ROUND
b. Predictors: (Constant), POWER
Coefficientsa
⊘ This is a preview!⊘
Do you want full access?
Subscribe today to unlock all pages.

Trusted by 1+ million students worldwide

Model Unstandardized Coefficients Standardized
Coefficients
t Sig. Collinearity Statistics
B Std. Error Beta Tolerance VIF
1 (Constant) -2.137 3.531 -.605 .550
POWER .004 .003 .234 1.315 .198 1.000 1.000
a. Dependent Variable: ROUND
Collinearity Diagnosticsa
Model Dimension Eigenvalue Condition Index Variance Proportions
(Constant) POWER
1 1 1.998 1.000 .00 .00
2 .002 35.553 1.00 1.00
a. Dependent Variable: ROUND
Residuals Statisticsa
Minimum Maximum Mean Std. Deviation N
Predicted Value 1.76 2.95 2.50 .265 32
Residual -1.806 1.782 .000 1.105 32
Std. Predicted Value -2.795 1.697 .000 1.000 32
Std. Residual -1.608 1.588 .000 .984 32
a. Dependent Variable: ROUND
Paraphrase This Document
Need a fresh take? Get an instant paraphrase of this document with our AI Paraphraser


12.4
A.
Hypothesis
Null hypothesis (H0): There is no statistically significant difference in the mean values of
dependent variables (Overrun & score) and factor variable power
Alternative hypothesis (H1): There is a statistically significant difference in the mean values of
dependent variables (Overrun & score) and factor variable power
⊘ This is a preview!⊘
Do you want full access?
Subscribe today to unlock all pages.

Trusted by 1+ million students worldwide

One way ANOVA
ANOVA
Sum of Squares df Mean Square F Sig.
OVERRUN
Between Groups 9669.958 23 420.433 . .
Within Groups .000 0 .
Total 9669.958 23
SCORE
Between Groups 1.171 28 .042 .365 .938
Within Groups .344 3 .115
Total 1.515 31
12.12
A. Implication of experimental technique to be used in analyzing the outcomes
T-test: To identify the statistical differences between group and score there will be
implication of t-test techniques which will bring the adequate outcomes. Moreover, in relation
with analyzing the independent T-test outcomes on which it can be said that there have been
implication of two or more variables which will be categories as per denoting them groups. Thus,
it will be helpful approach which in turn used for comparing the mean value of two independent
groups on which the statistical determination of the statistical evidences based on population
means are significantly different.
B. Analyzing the means of variables
T-test:
Group Statistics
GROUP N Mean Std. Deviation Std. Error Mean
SCORE 1 11 .4400 .17053 .05142
2 11 .2655 .15260 .04601
Paraphrase This Document
Need a fresh take? Get an instant paraphrase of this document with our AI Paraphraser

Independent Samples Test
Levene's Test for
Equality of
Variances
t-test for Equality of Means
F Sig. t df Sig. (2-
tailed)
Mean
Difference
Std. Error
Difference
95% Confidence
Interval of the
Difference
Lower Upper
SCORE
Equal
variances
assumed
.020 .888 2.530 20 .020 .17455 .06900 .03062 .31847
Equal
variances not
assumed
2.530 19.758 .020 .17455 .06900 .03051 .31858
12.14
A. Identification of the treatment to be followed.
In relation with ascertaining the outcomes there have been use of various outcomes. In
relation with analyzing the outcomes as considering population there is needed to have adequate
determination of the facts (Annotated output, 2018). Thus, considering descriptive analysis, one
way ANOVAs and various techniques which will be helpful in determining outcomes.
12.22
One way ANOVA
Null hypothesis (H0): There is no statistically significant difference in the mean values of
dependent variable GROUP and other independent variable SOCRE.
Alternative hypothesis (H1): There is a statistically significant difference in the mean values of
variable GROUP and other independent variable SOCRE.
ANOVA
GROUP

Sum of Squares df Mean Square F Sig.
Between Groups 42.833 34 1.260 .932 .593
Within Groups 12.167 9 1.352
Total 55.000 43
SAS
Frequencies
Statistics
GROUP SCORE
N Valid 44 44
Missing 1 1
Mean 2.50 .2923
Std. Error of Mean .170 .03396
Median 2.50 .3150
Mode 1a .20a
Std. Deviation 1.131 .22528
Variance 1.279 .051
Skewness .000 -.834
Std. Error of Skewness .357 .357
Kurtosis -1.378 .590
Std. Error of Kurtosis .702 .702
Range 3 .97
Minimum 1 -.35
Maximum 4 .62
Percentiles
25 1.25 .1600
50 2.50 .3150
75 3.75 .4700
a. Multiple modes exist. The smallest value is shown
Frequency Table
GROUP
⊘ This is a preview!⊘
Do you want full access?
Subscribe today to unlock all pages.

Trusted by 1+ million students worldwide

Frequency Percent Valid Percent Cumulative
Percent
Valid
1 11 24.4 25.0 25.0
2 11 24.4 25.0 50.0
3 11 24.4 25.0 75.0
4 11 24.4 25.0 100.0
Total 44 97.8 100.0
Missing System 1 2.2
Total 45 100.0
SCORE
Frequency Percent Valid Percent Cumulative
Percent
Valid -.35 1 2.2 2.3 2.3
-.25 1 2.2 2.3 4.5
-.14 1 2.2 2.3 6.8
.00 1 2.2 2.3 9.1
.02 1 2.2 2.3 11.4
.04 1 2.2 2.3 13.6
.10 2 4.4 4.5 18.2
.12 1 2.2 2.3 20.5
.15 1 2.2 2.3 22.7
.16 2 4.4 4.5 27.3
.18 1 2.2 2.3 29.5
.20 3 6.7 6.8 36.4
.21 1 2.2 2.3 38.6
.22 1 2.2 2.3 40.9
.26 1 2.2 2.3 43.2
.29 1 2.2 2.3 45.5
.30 1 2.2 2.3 47.7
.31 1 2.2 2.3 50.0
.32 1 2.2 2.3 52.3
.34 1 2.2 2.3 54.5
.36 1 2.2 2.3 56.8
.39 1 2.2 2.3 59.1
Percent
Valid
1 11 24.4 25.0 25.0
2 11 24.4 25.0 50.0
3 11 24.4 25.0 75.0
4 11 24.4 25.0 100.0
Total 44 97.8 100.0
Missing System 1 2.2
Total 45 100.0
SCORE
Frequency Percent Valid Percent Cumulative
Percent
Valid -.35 1 2.2 2.3 2.3
-.25 1 2.2 2.3 4.5
-.14 1 2.2 2.3 6.8
.00 1 2.2 2.3 9.1
.02 1 2.2 2.3 11.4
.04 1 2.2 2.3 13.6
.10 2 4.4 4.5 18.2
.12 1 2.2 2.3 20.5
.15 1 2.2 2.3 22.7
.16 2 4.4 4.5 27.3
.18 1 2.2 2.3 29.5
.20 3 6.7 6.8 36.4
.21 1 2.2 2.3 38.6
.22 1 2.2 2.3 40.9
.26 1 2.2 2.3 43.2
.29 1 2.2 2.3 45.5
.30 1 2.2 2.3 47.7
.31 1 2.2 2.3 50.0
.32 1 2.2 2.3 52.3
.34 1 2.2 2.3 54.5
.36 1 2.2 2.3 56.8
.39 1 2.2 2.3 59.1
Paraphrase This Document
Need a fresh take? Get an instant paraphrase of this document with our AI Paraphraser

.40 1 2.2 2.3 61.4
.42 1 2.2 2.3 63.6
.43 2 4.4 4.5 68.2
.44 1 2.2 2.3 70.5
.46 1 2.2 2.3 72.7
.47 2 4.4 4.5 77.3
.50 3 6.7 6.8 84.1
.51 1 2.2 2.3 86.4
.52 1 2.2 2.3 88.6
.53 1 2.2 2.3 90.9
.58 2 4.4 4.5 95.5
.61 1 2.2 2.3 97.7
.62 1 2.2 2.3 100.0
Total 44 97.8 100.0
Missing System 1 2.2
Total 45 100.0
Descriptive Statistics
N Minimum Maximum Mean Std. Deviation
GROUP 44 1 4 2.50 1.131
SCORE 44 -.35 .62 .2923 .22528
Valid N (listwise) 44
12.24
One way ANOVA
Hypothesis:
Null hypothesis (H0): There is no statistically significant difference in the mean values of
dependent variable abstract and other independent variable factor (day).
Alternative hypothesis (H1): There is a statistically significant difference in the mean values of
variable abstract and other independent variable factor (day).

ANOVA
absrate
Sum of Squares df Mean Square F Sig.
Between Groups 94.199 4 23.550 .989 .424
Within Groups 952.169 40 23.804
Total 1046.368 44
12.26
Regression
Hypothesis
Null hypothesis (H0): There is no statistically significant difference in the mean values of power
and other independent variables (boxer & round).
Alternative hypothesis (H1): There is a statistically significant difference in the mean values of
power and other independent variables (boxer & round).
Descriptive Statistics
Mean Std. Deviation N
POWER 1253.34 71.690 32
BOXER 4.50 2.328 32
ROUND 2.50 1.136 32
Correlations
POWER BOXER ROUND
Pearson Correlation
POWER 1.000 .204 .234
BOXER .204 1.000 .000
ROUND .234 .000 1.000
Sig. (1-tailed)
POWER . .132 .099
BOXER .132 . .500
ROUND .099 .500 .
⊘ This is a preview!⊘
Do you want full access?
Subscribe today to unlock all pages.

Trusted by 1+ million students worldwide
1 out of 16
Related Documents
Your All-in-One AI-Powered Toolkit for Academic Success.
 +13062052269
info@desklib.com
Available 24*7 on WhatsApp / Email
Unlock your academic potential
Copyright © 2020–2025 A2Z Services. All Rights Reserved. Developed and managed by ZUCOL.


