SPSS Project: Statistical Analysis of LTT Tanzania Survey Data

Verified

Added on  2020/01/23

|20
|3520
|40
Project
AI Summary
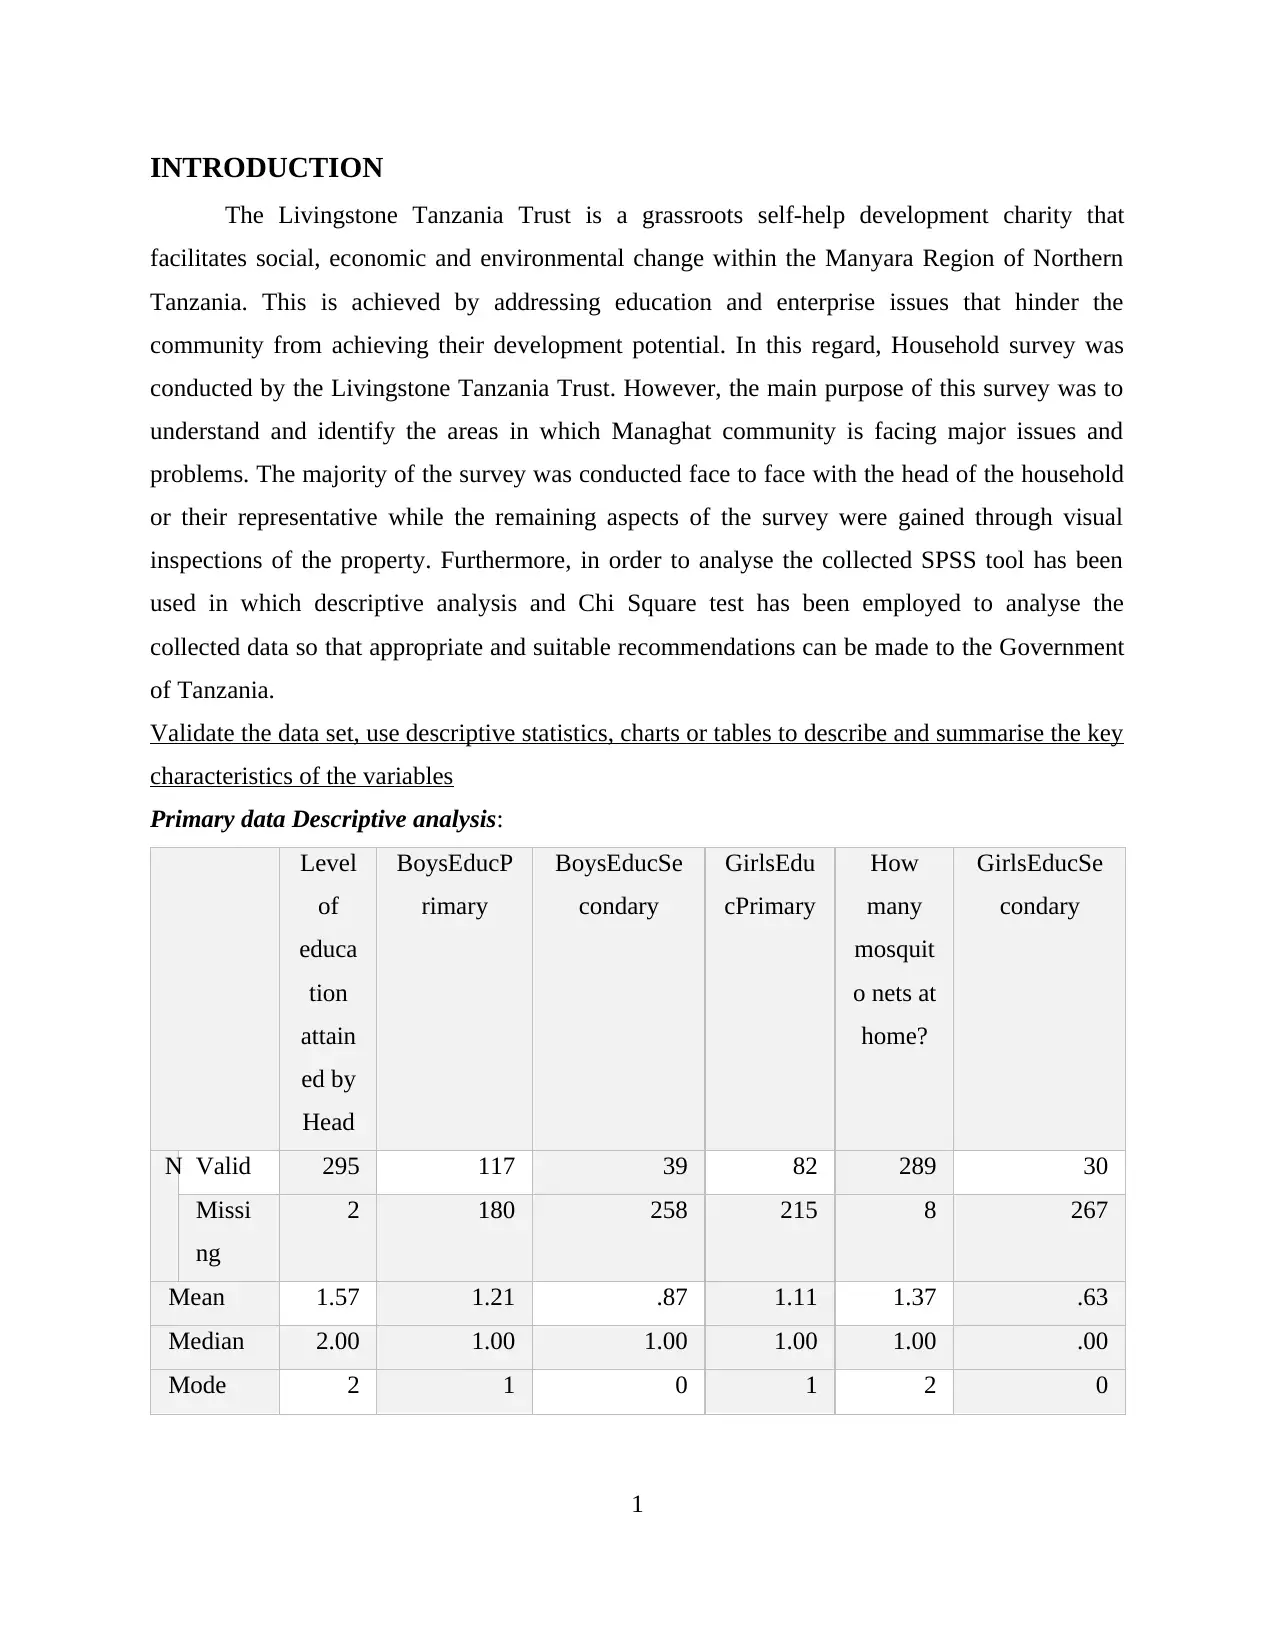
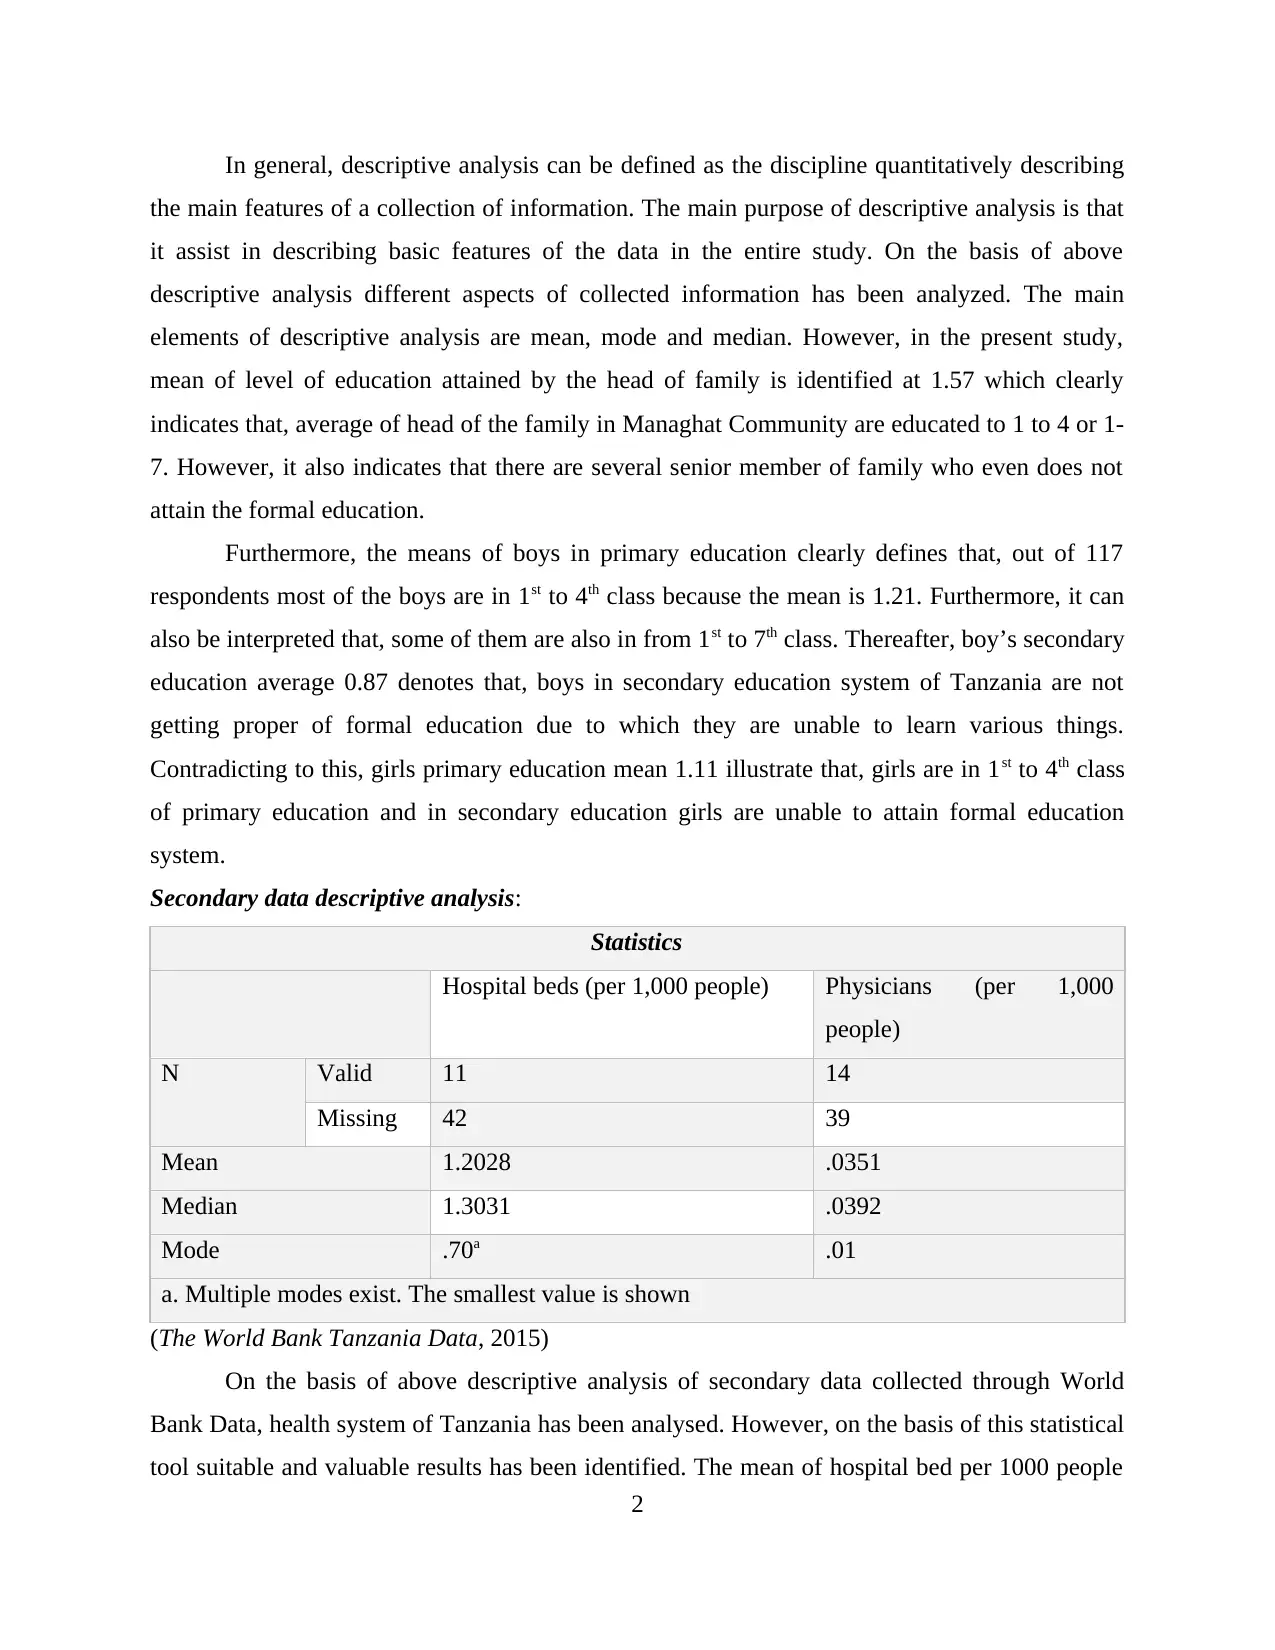
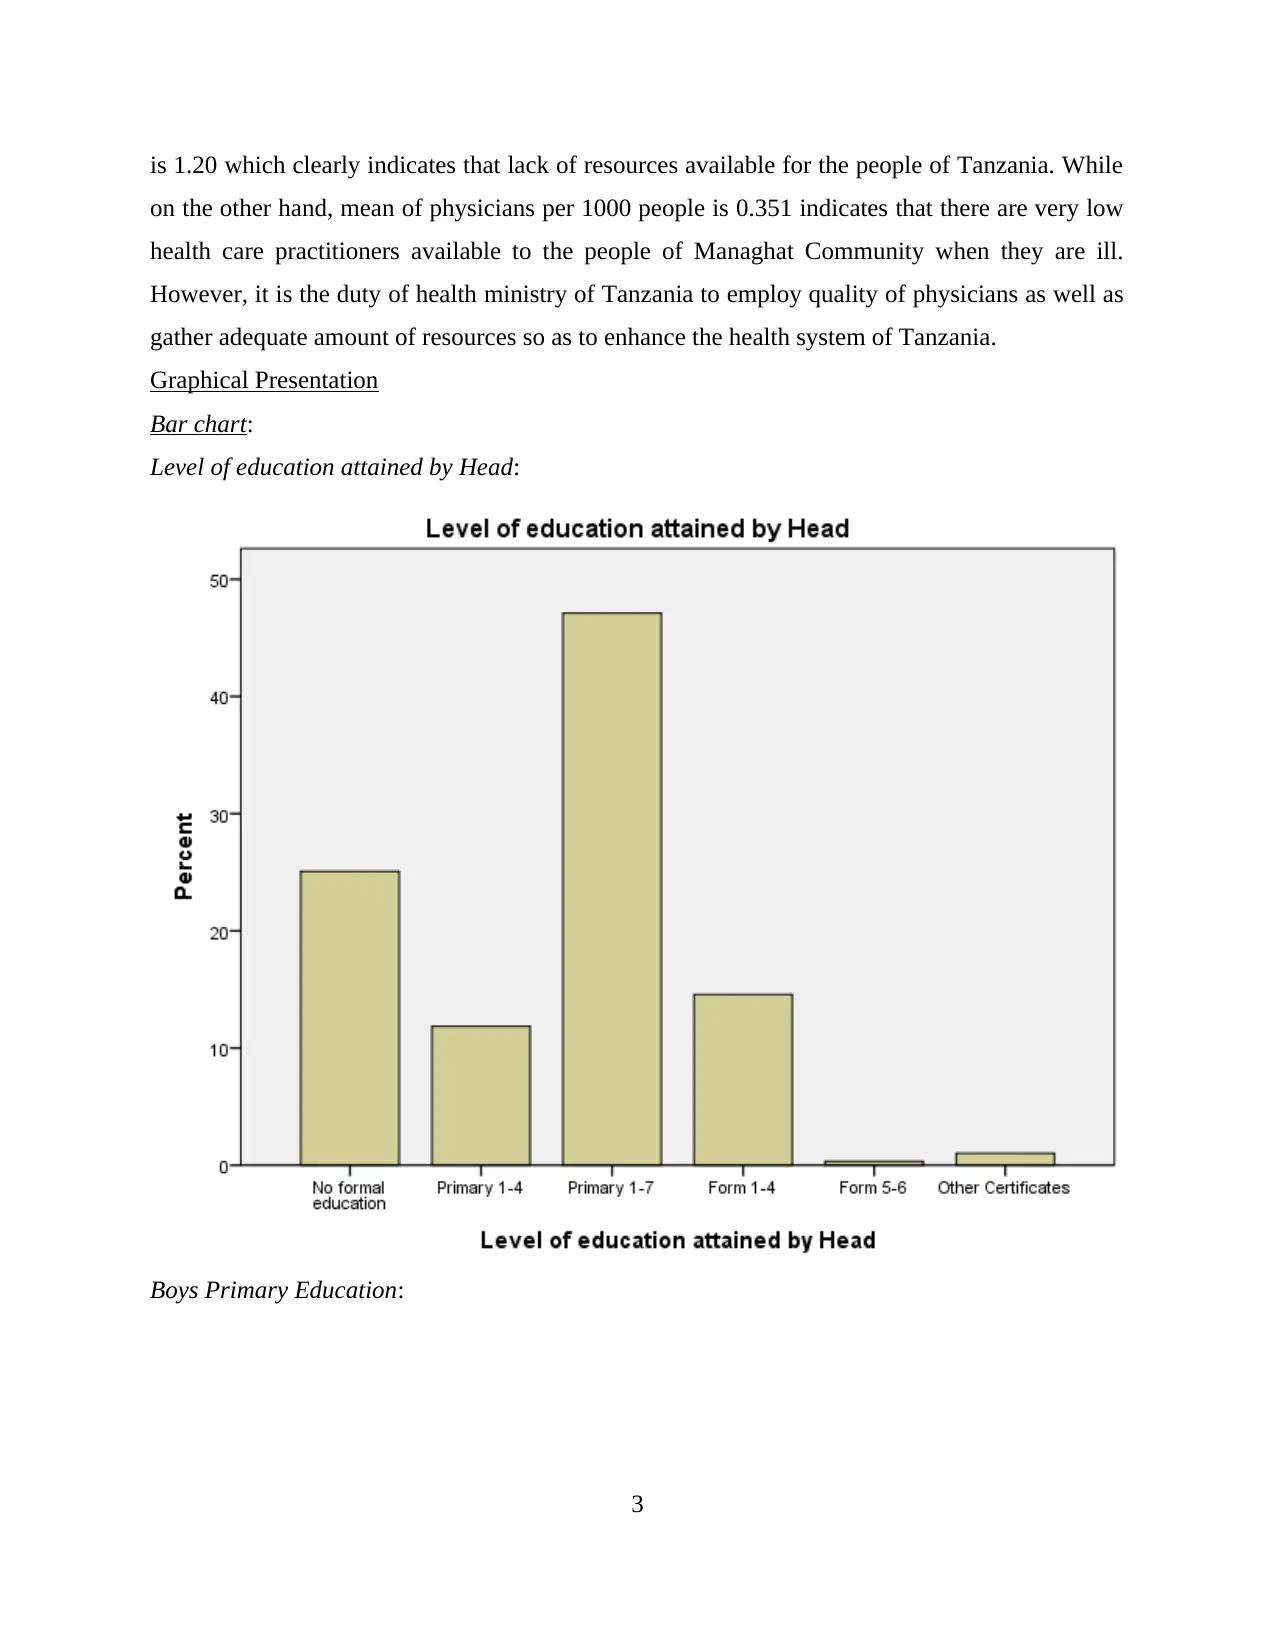
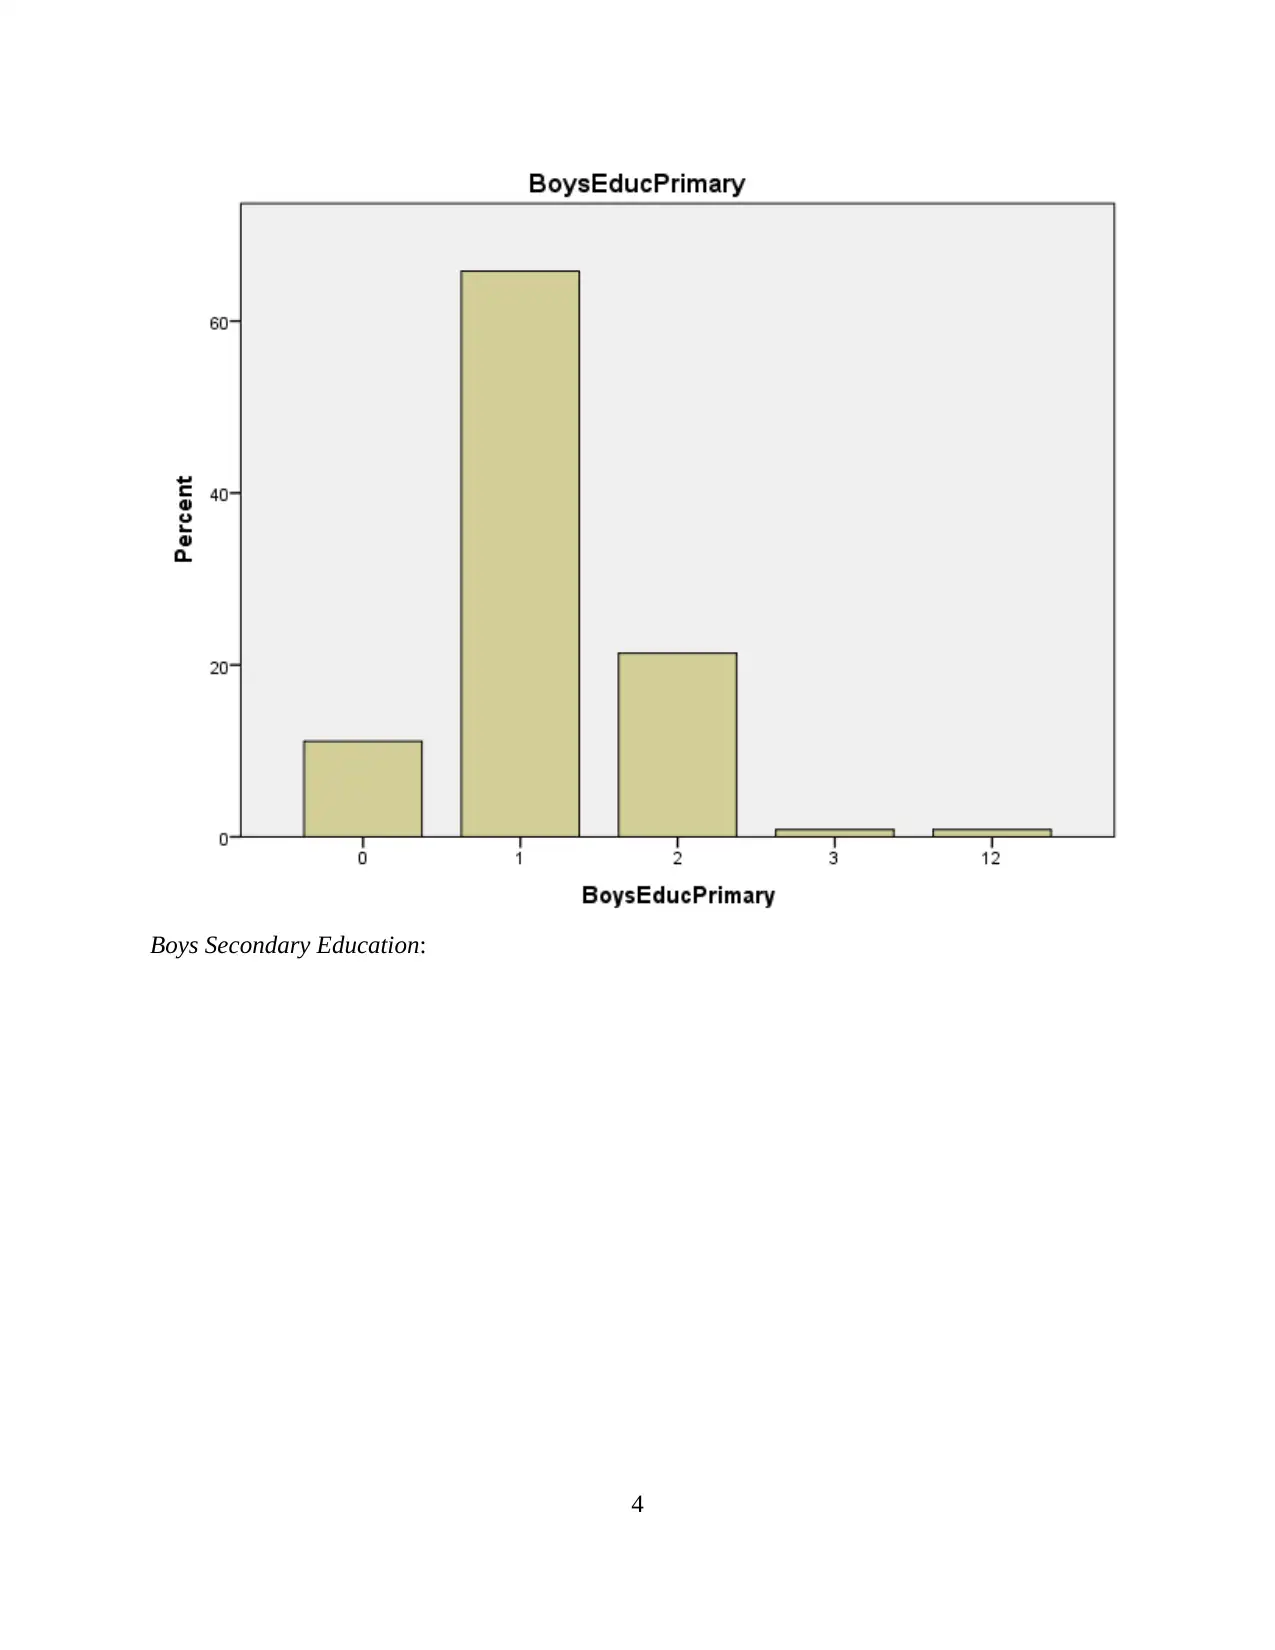
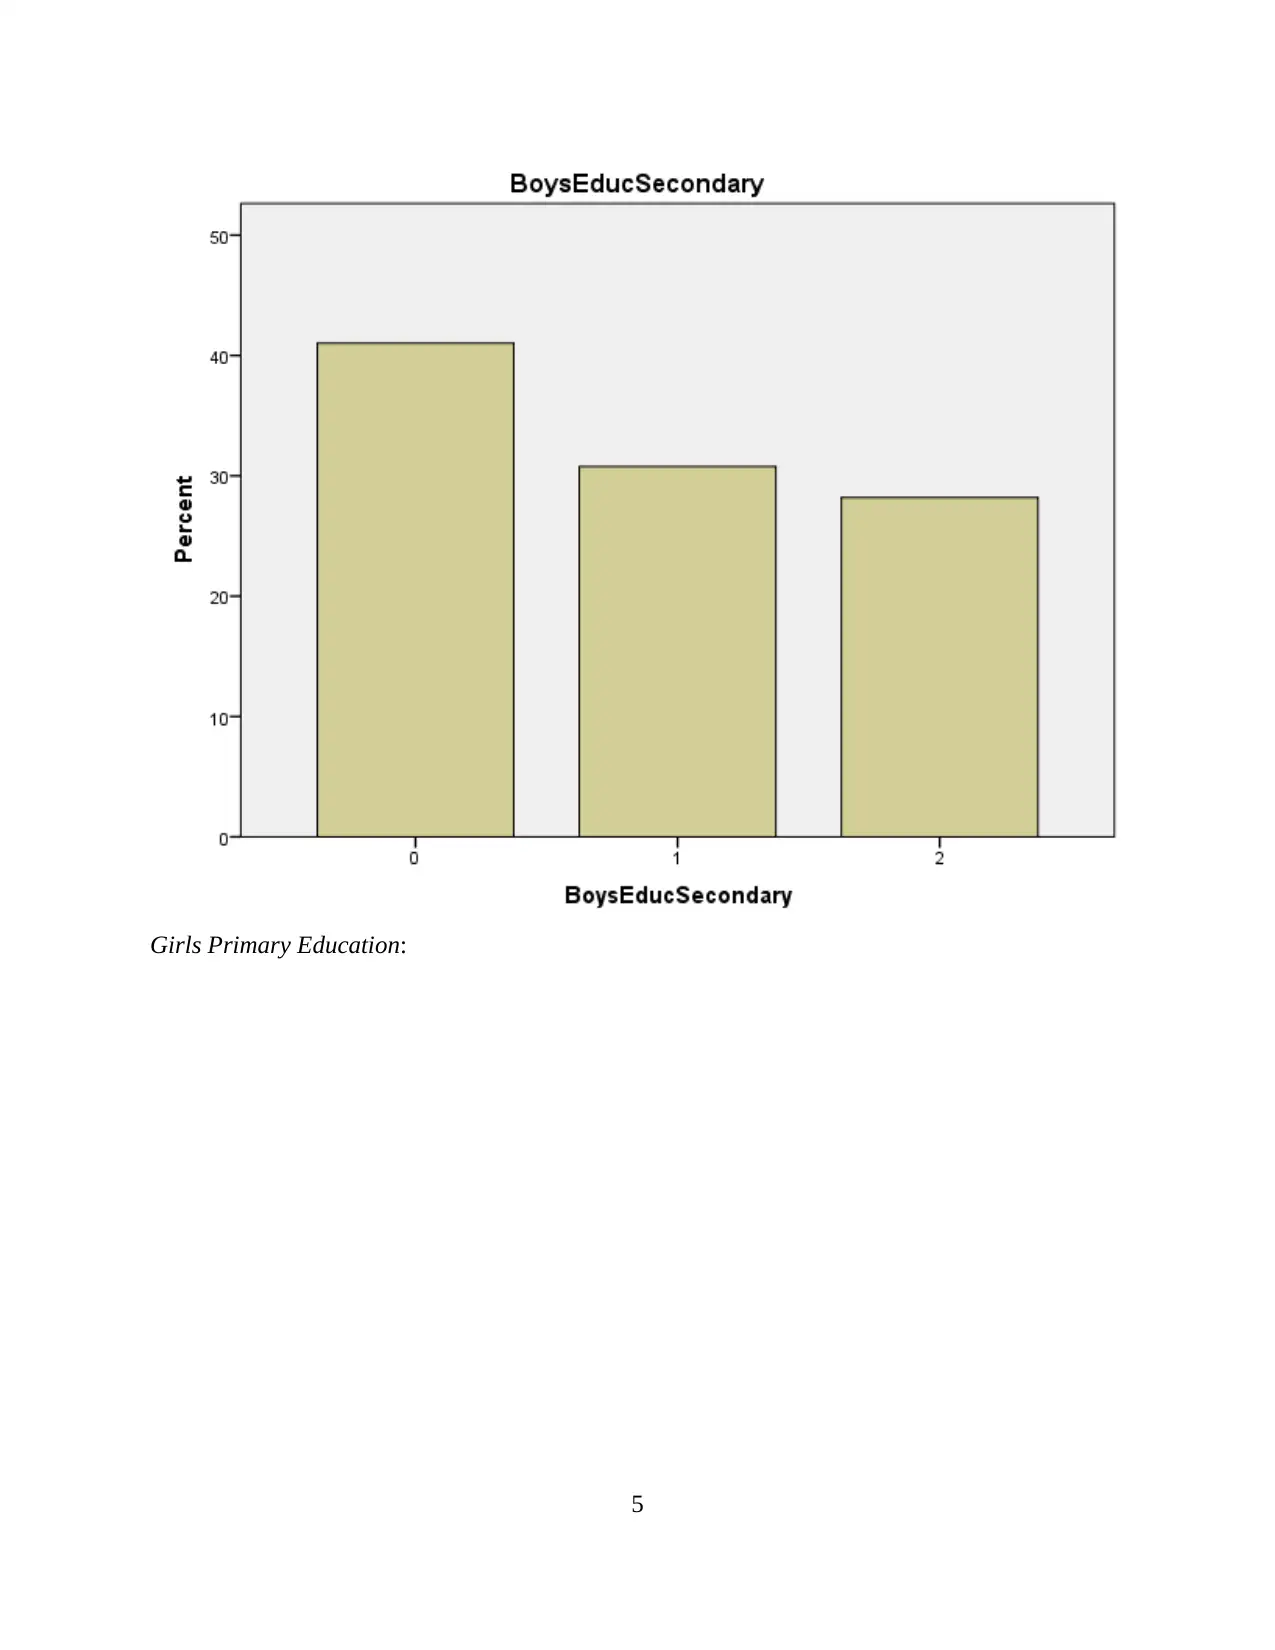
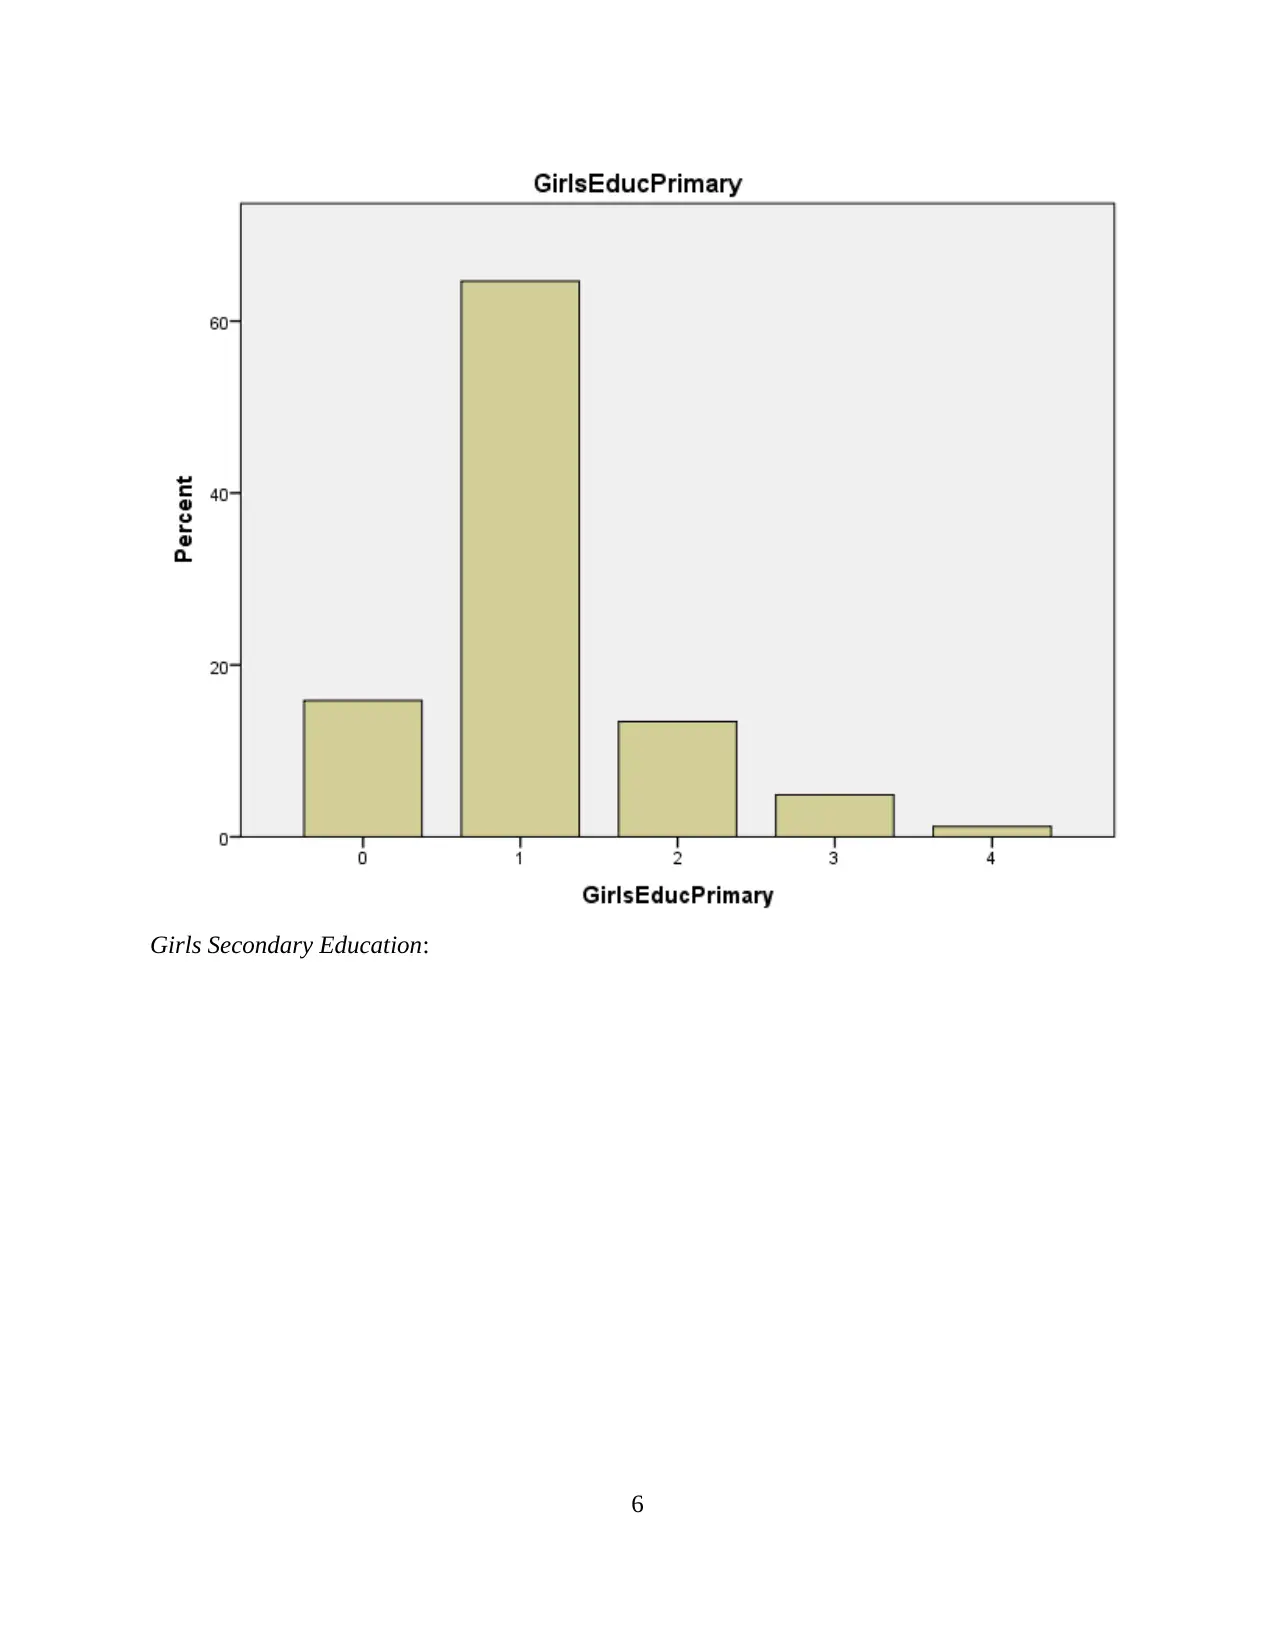
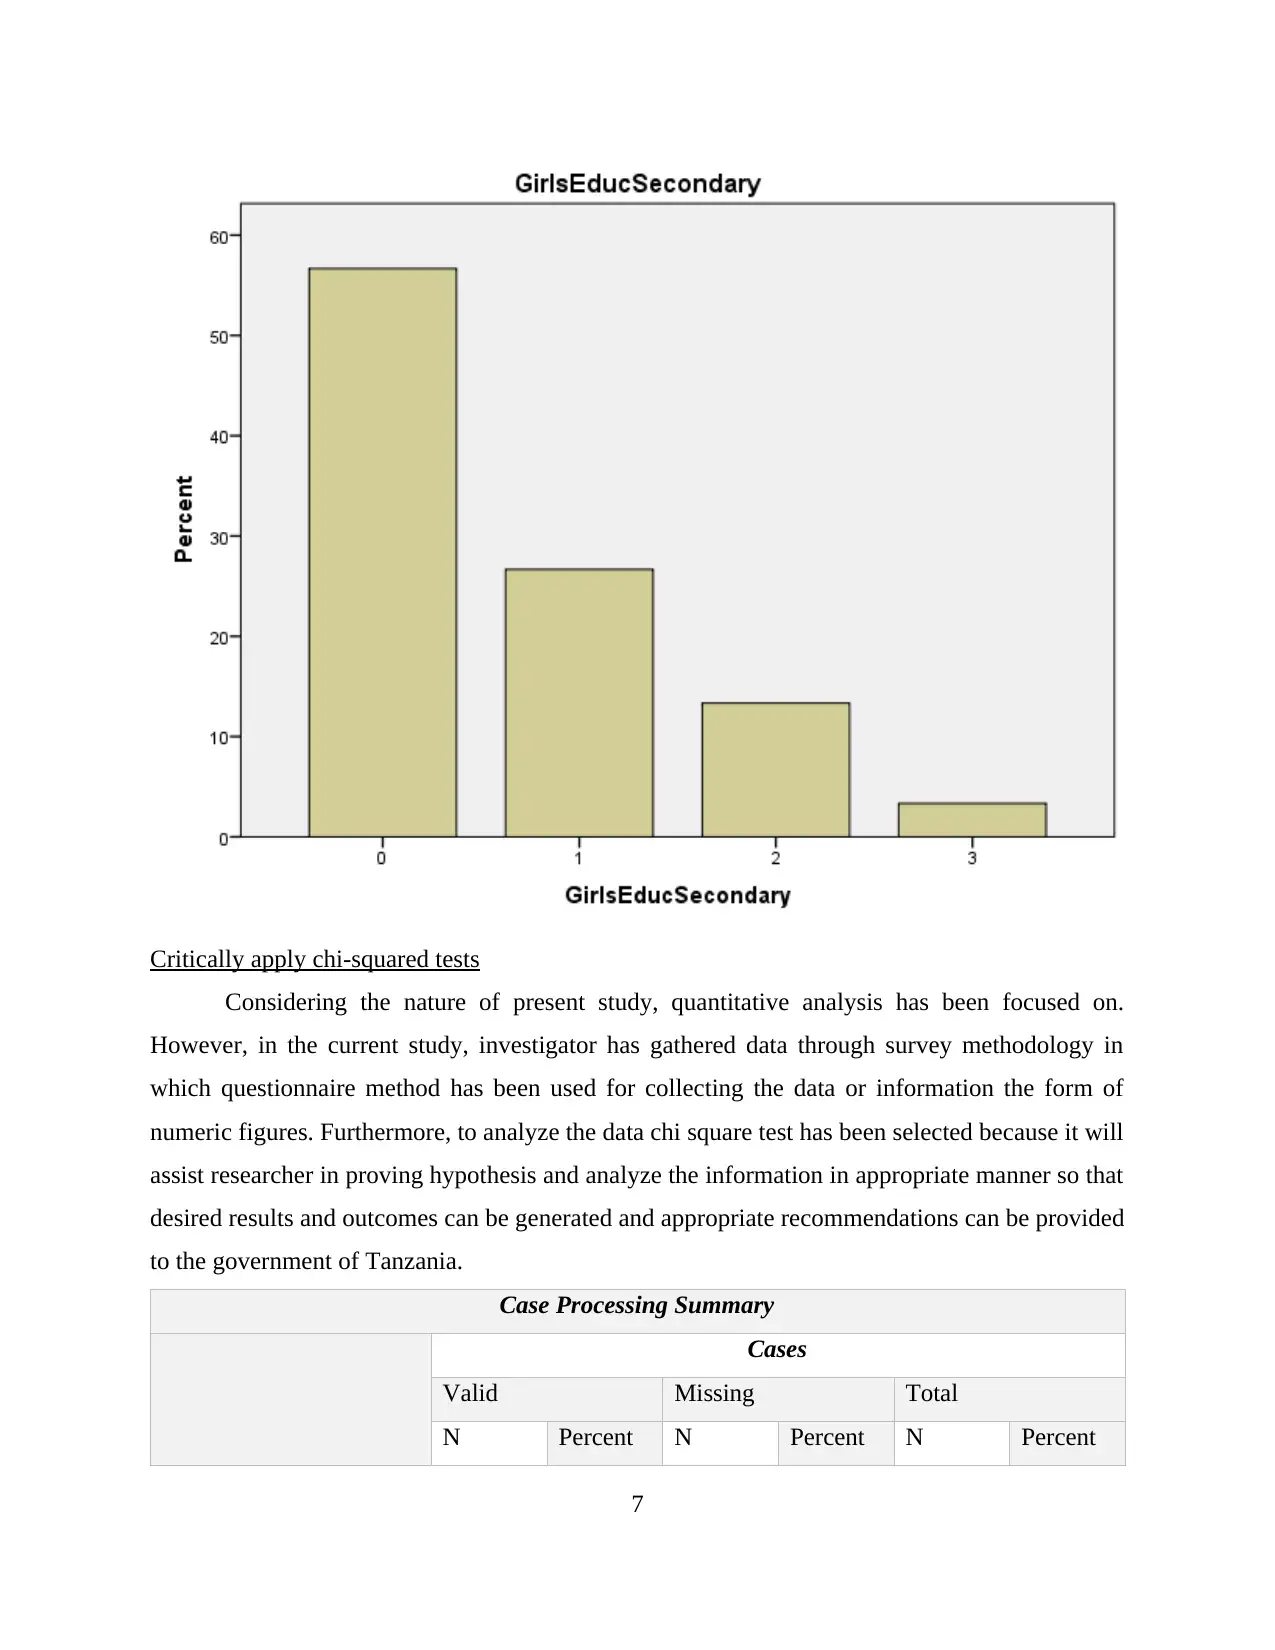
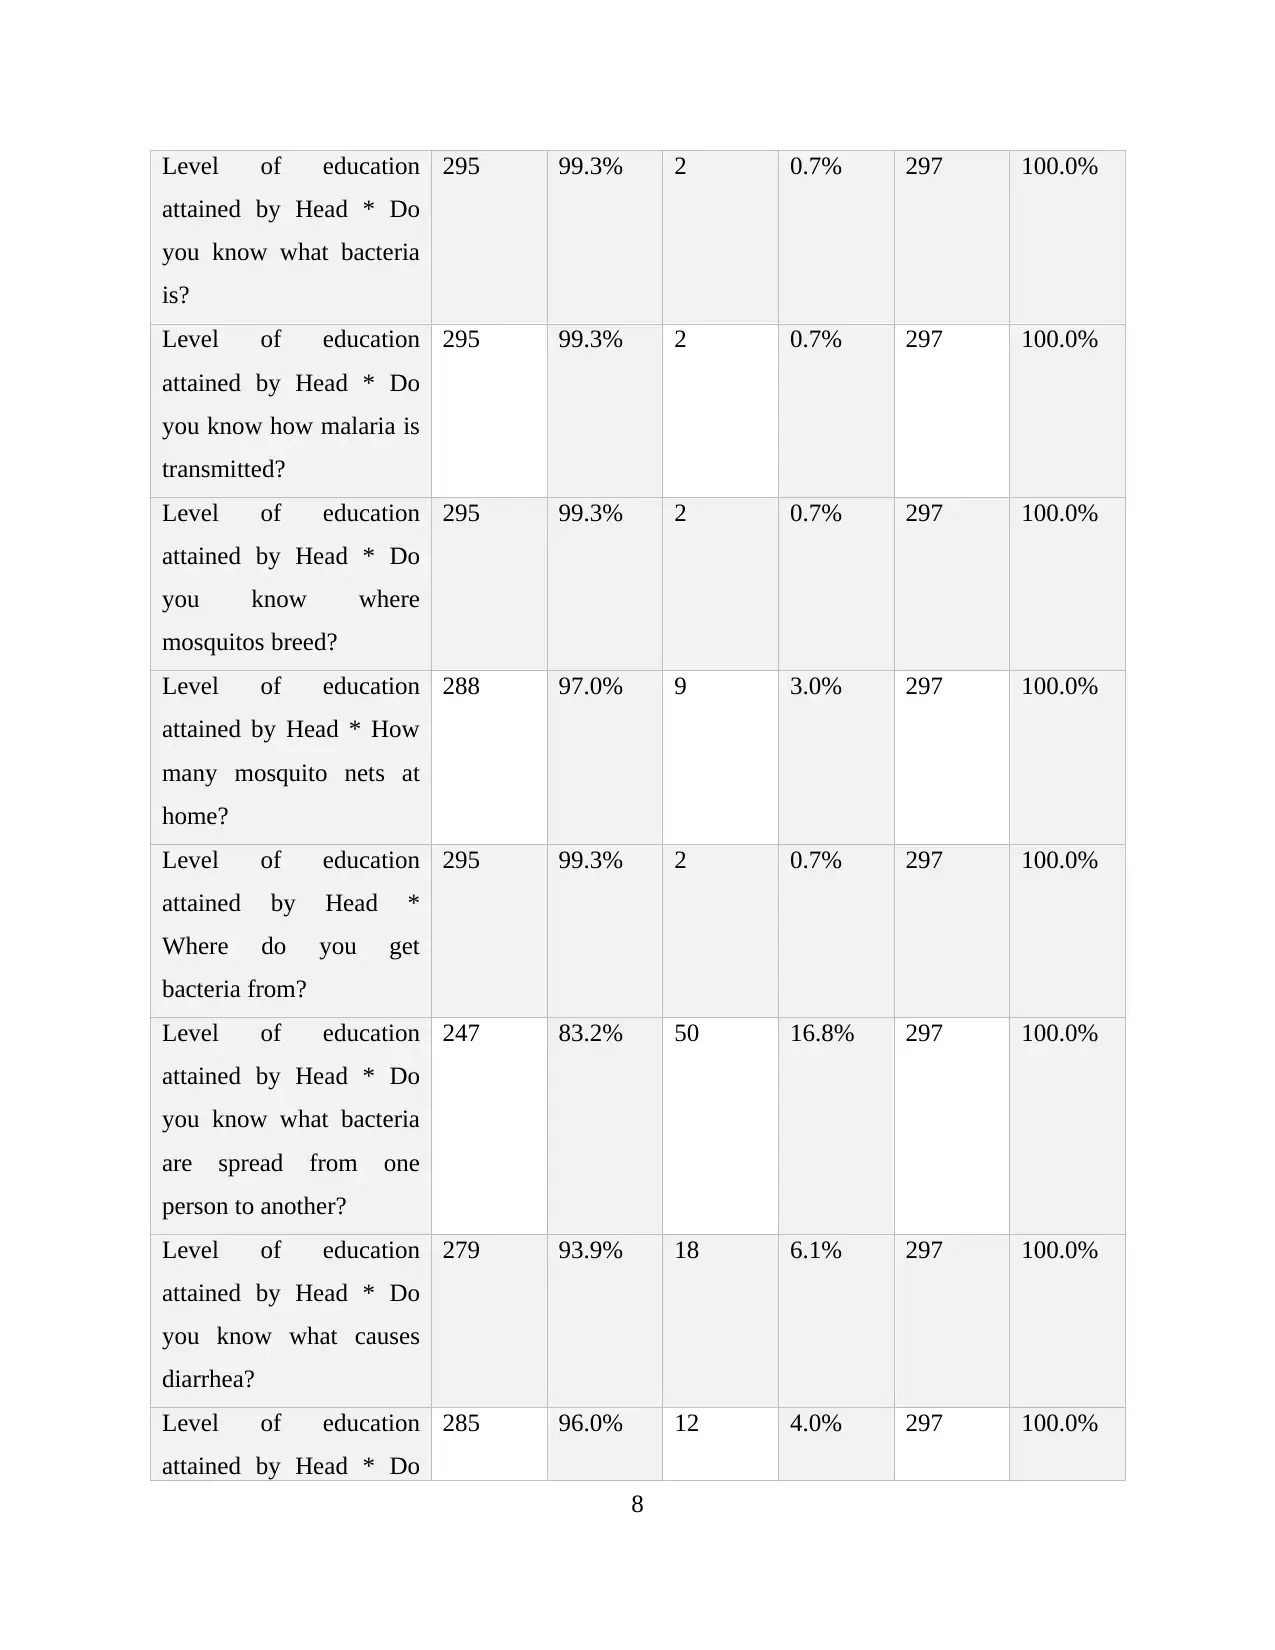
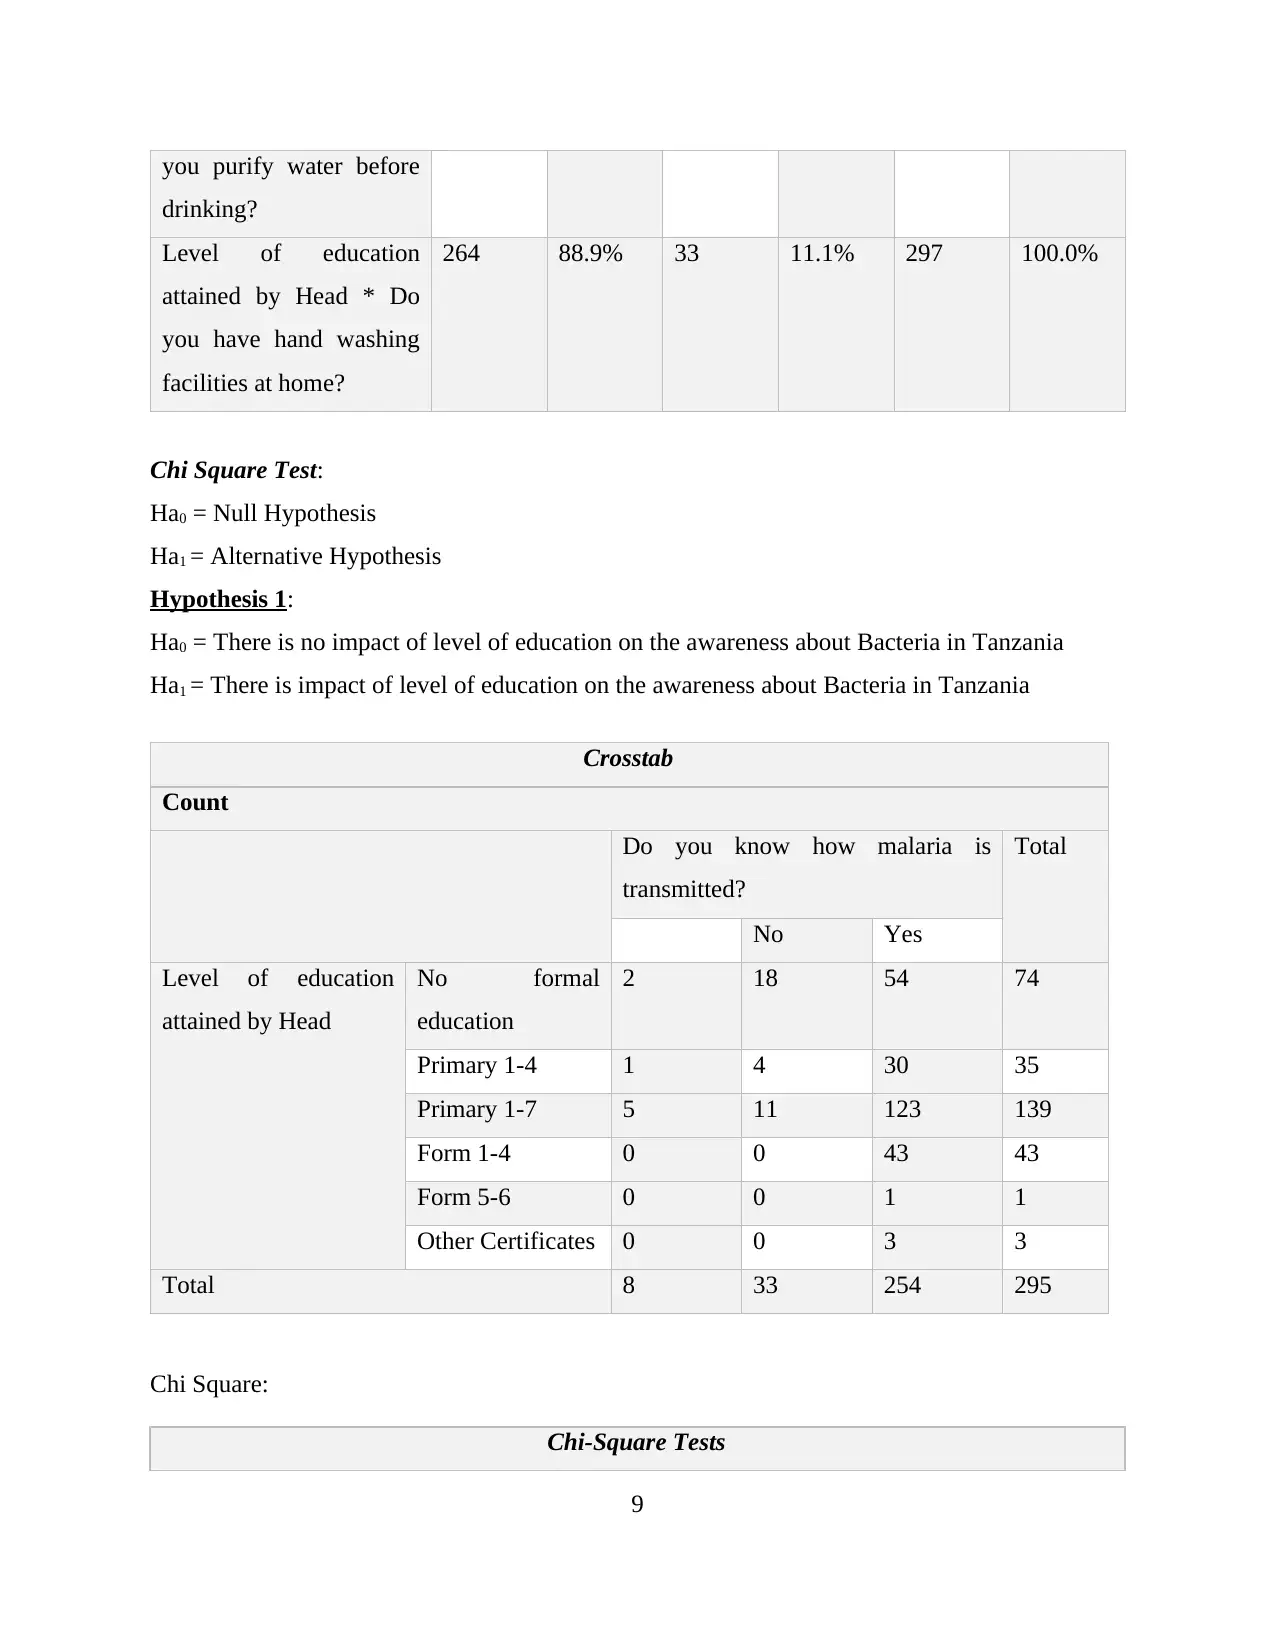
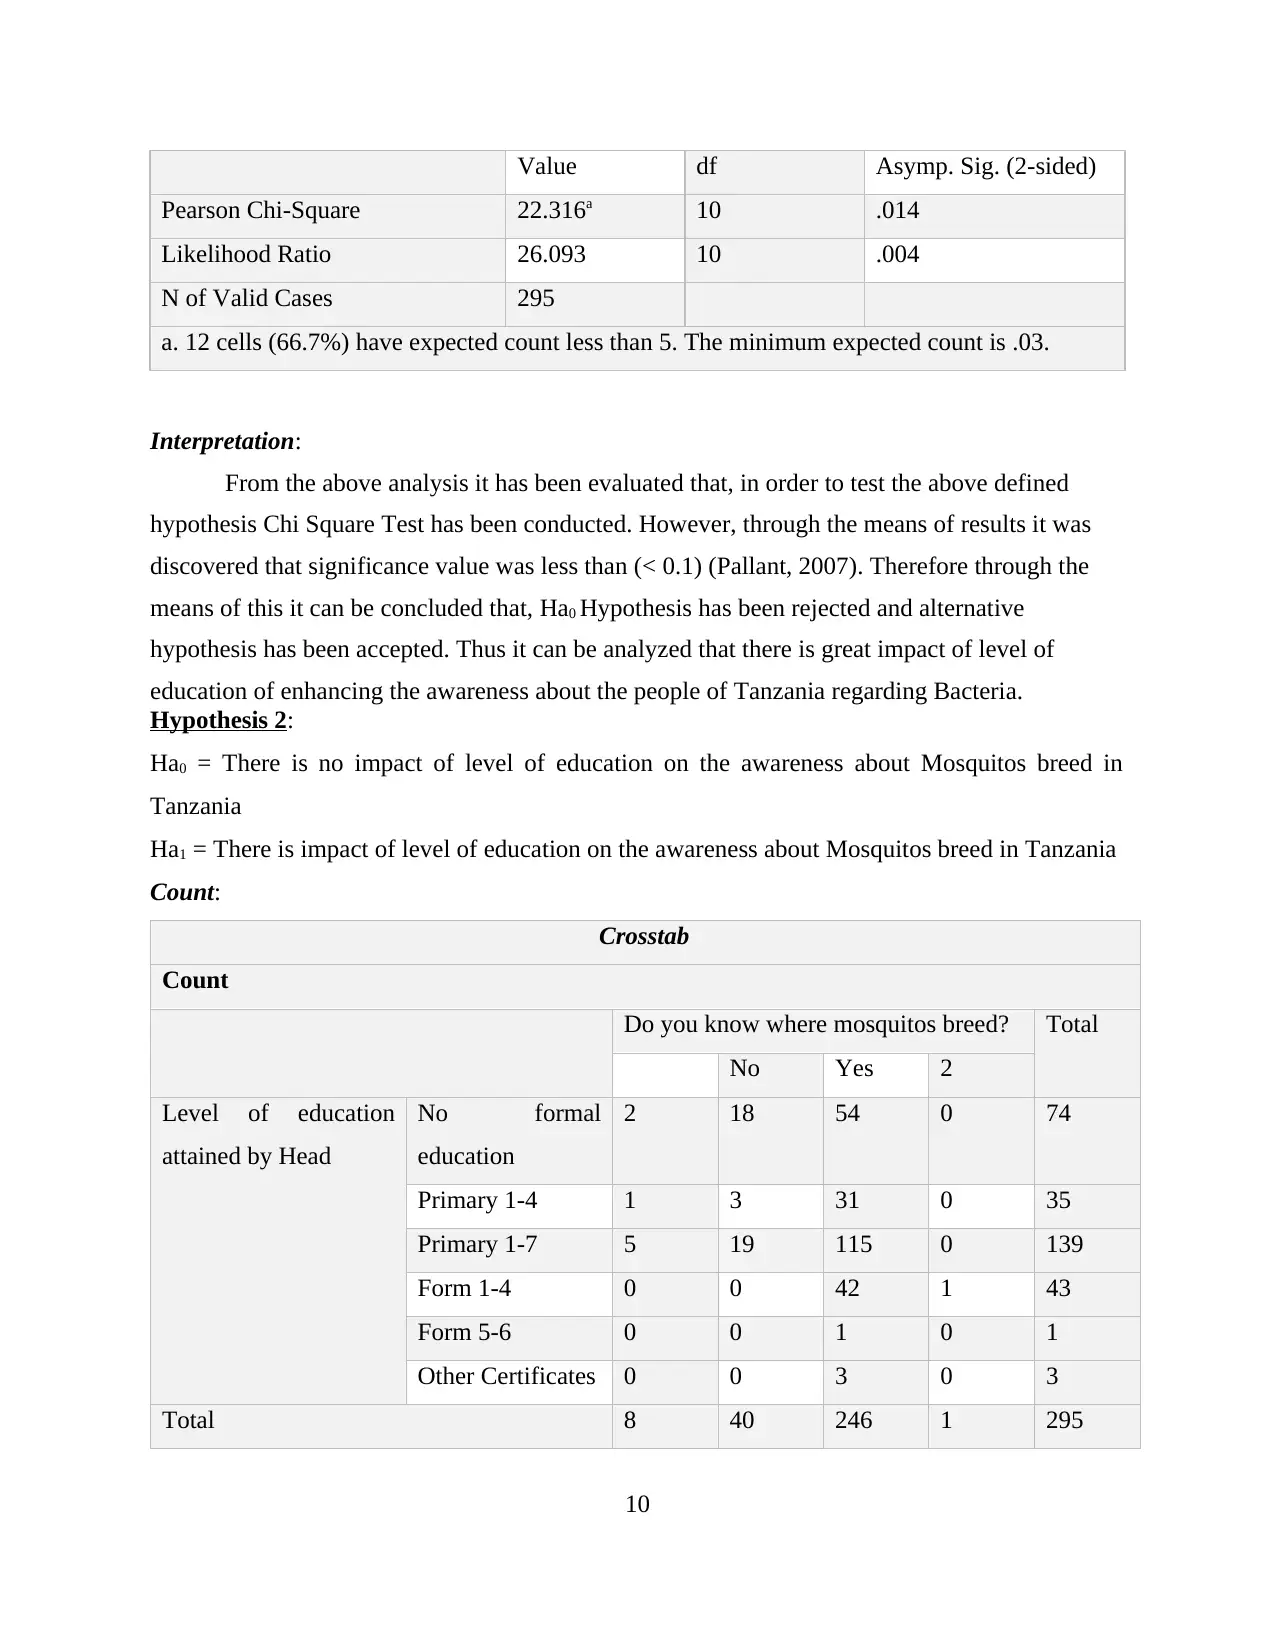
This SPSS project analyzes data from a health survey conducted by the Livingstone Tanzania Trust in the Manyara Region of Tanzania. The project begins with an introduction to the survey's purpose: identifying key issues within the Managhat community. The analysis utilizes SPSS to perform descriptive statistics, graphical presentations, and chi-squared tests. The descriptive analysis examines variables like education levels and access to healthcare resources, both primary and secondary data are used. Chi-squared tests are critically applied to assess the relationship between education levels and health awareness regarding bacteria, malaria transmission, mosquito breeding, mosquito net usage, and the causes of diarrhea. The project includes regression analysis and a T-Test model, followed by recommendations for the Tanzanian government. The conclusion summarizes the findings, and references are provided. The project's goal is to provide insights and suggest interventions for improving health and education outcomes in the region.
Document Page
SPSS PROJECT
tabler-icon-diamond-filled.svg

Paraphrase This Document

Need a fresh take? Get an instant paraphrase of this document with our AI Paraphraser
Document Page
TABLE OF CONTENTS
Introduction......................................................................................................................................1
Validate the data set, use descriptive statistics, charts or tables to describe and summarise the
key characteristics of the variables..............................................................................................1
Graphical Presentation.................................................................................................................3
Critically apply chi-squared tests.................................................................................................7
Regression Analysis...................................................................................................................16
T-Test Model.............................................................................................................................17
Recommendations for the LTT or Tanzania Government.........................................................18
Conclusion.....................................................................................................................................19
References......................................................................................................................................20
Document Page
INTRODUCTION
The Livingstone Tanzania Trust is a grassroots self-help development charity that
facilitates social, economic and environmental change within the Manyara Region of Northern
Tanzania. This is achieved by addressing education and enterprise issues that hinder the
community from achieving their development potential. In this regard, Household survey was
conducted by the Livingstone Tanzania Trust. However, the main purpose of this survey was to
understand and identify the areas in which Managhat community is facing major issues and
problems. The majority of the survey was conducted face to face with the head of the household
or their representative while the remaining aspects of the survey were gained through visual
inspections of the property. Furthermore, in order to analyse the collected SPSS tool has been
used in which descriptive analysis and Chi Square test has been employed to analyse the
collected data so that appropriate and suitable recommendations can be made to the Government
of Tanzania.
Validate the data set, use descriptive statistics, charts or tables to describe and summarise the key
characteristics of the variables
Primary data Descriptive analysis:
Level
of
educa
tion
attain
ed by
Head
BoysEducP
rimary
BoysEducSe
condary
GirlsEdu
cPrimary
How
many
mosquit
o nets at
home?
GirlsEducSe
condary
N Valid 295 117 39 82 289 30
Missi
ng
2 180 258 215 8 267
Mean 1.57 1.21 .87 1.11 1.37 .63
Median 2.00 1.00 1.00 1.00 1.00 .00
Mode 2 1 0 1 2 0
1
Document Page
In general, descriptive analysis can be defined as the discipline quantitatively describing
the main features of a collection of information. The main purpose of descriptive analysis is that
it assist in describing basic features of the data in the entire study. On the basis of above
descriptive analysis different aspects of collected information has been analyzed. The main
elements of descriptive analysis are mean, mode and median. However, in the present study,
mean of level of education attained by the head of family is identified at 1.57 which clearly
indicates that, average of head of the family in Managhat Community are educated to 1 to 4 or 1-
7. However, it also indicates that there are several senior member of family who even does not
attain the formal education.
Furthermore, the means of boys in primary education clearly defines that, out of 117
respondents most of the boys are in 1st to 4th class because the mean is 1.21. Furthermore, it can
also be interpreted that, some of them are also in from 1st to 7th class. Thereafter, boy’s secondary
education average 0.87 denotes that, boys in secondary education system of Tanzania are not
getting proper of formal education due to which they are unable to learn various things.
Contradicting to this, girls primary education mean 1.11 illustrate that, girls are in 1st to 4th class
of primary education and in secondary education girls are unable to attain formal education
system.
Secondary data descriptive analysis:
Statistics
Hospital beds (per 1,000 people) Physicians (per 1,000
people)
N Valid 11 14
Missing 42 39
Mean 1.2028 .0351
Median 1.3031 .0392
Mode .70a .01
a. Multiple modes exist. The smallest value is shown
(The World Bank Tanzania Data, 2015)
On the basis of above descriptive analysis of secondary data collected through World
Bank Data, health system of Tanzania has been analysed. However, on the basis of this statistical
tool suitable and valuable results has been identified. The mean of hospital bed per 1000 people
2
tabler-icon-diamond-filled.svg

Paraphrase This Document

Need a fresh take? Get an instant paraphrase of this document with our AI Paraphraser
Document Page
is 1.20 which clearly indicates that lack of resources available for the people of Tanzania. While
on the other hand, mean of physicians per 1000 people is 0.351 indicates that there are very low
health care practitioners available to the people of Managhat Community when they are ill.
However, it is the duty of health ministry of Tanzania to employ quality of physicians as well as
gather adequate amount of resources so as to enhance the health system of Tanzania.
Graphical Presentation
Bar chart:
Level of education attained by Head:
Boys Primary Education:
3
Document Page
Boys Secondary Education:
4
Document Page
Girls Primary Education:
5
tabler-icon-diamond-filled.svg

Paraphrase This Document

Need a fresh take? Get an instant paraphrase of this document with our AI Paraphraser
Document Page
Girls Secondary Education:
6
Document Page
Critically apply chi-squared tests
Considering the nature of present study, quantitative analysis has been focused on.
However, in the current study, investigator has gathered data through survey methodology in
which questionnaire method has been used for collecting the data or information the form of
numeric figures. Furthermore, to analyze the data chi square test has been selected because it will
assist researcher in proving hypothesis and analyze the information in appropriate manner so that
desired results and outcomes can be generated and appropriate recommendations can be provided
to the government of Tanzania.
Case Processing Summary
Cases
Valid Missing Total
N Percent N Percent N Percent
7
Document Page
Level of education
attained by Head * Do
you know what bacteria
is?
295 99.3% 2 0.7% 297 100.0%
Level of education
attained by Head * Do
you know how malaria is
transmitted?
295 99.3% 2 0.7% 297 100.0%
Level of education
attained by Head * Do
you know where
mosquitos breed?
295 99.3% 2 0.7% 297 100.0%
Level of education
attained by Head * How
many mosquito nets at
home?
288 97.0% 9 3.0% 297 100.0%
Level of education
attained by Head *
Where do you get
bacteria from?
295 99.3% 2 0.7% 297 100.0%
Level of education
attained by Head * Do
you know what bacteria
are spread from one
person to another?
247 83.2% 50 16.8% 297 100.0%
Level of education
attained by Head * Do
you know what causes
diarrhea?
279 93.9% 18 6.1% 297 100.0%
Level of education
attained by Head * Do
285 96.0% 12 4.0% 297 100.0%
8
tabler-icon-diamond-filled.svg

Paraphrase This Document

Need a fresh take? Get an instant paraphrase of this document with our AI Paraphraser
Document Page
you purify water before
drinking?
Level of education
attained by Head * Do
you have hand washing
facilities at home?
264 88.9% 33 11.1% 297 100.0%
Chi Square Test:
Ha0 = Null Hypothesis
Ha1 = Alternative Hypothesis
Hypothesis 1:
Ha0 = There is no impact of level of education on the awareness about Bacteria in Tanzania
Ha1 = There is impact of level of education on the awareness about Bacteria in Tanzania
Crosstab
Count
Do you know how malaria is
transmitted?
Total
No Yes
Level of education
attained by Head
No formal
education
2 18 54 74
Primary 1-4 1 4 30 35
Primary 1-7 5 11 123 139
Form 1-4 0 0 43 43
Form 5-6 0 0 1 1
Other Certificates 0 0 3 3
Total 8 33 254 295
Chi Square:
Chi-Square Tests
9
Document Page
Value df Asymp. Sig. (2-sided)
Pearson Chi-Square 22.316a 10 .014
Likelihood Ratio 26.093 10 .004
N of Valid Cases 295
a. 12 cells (66.7%) have expected count less than 5. The minimum expected count is .03.
Interpretation:
From the above analysis it has been evaluated that, in order to test the above defined
hypothesis Chi Square Test has been conducted. However, through the means of results it was
discovered that significance value was less than (< 0.1) (Pallant, 2007). Therefore through the
means of this it can be concluded that, Ha0 Hypothesis has been rejected and alternative
hypothesis has been accepted. Thus it can be analyzed that there is great impact of level of
education of enhancing the awareness about the people of Tanzania regarding Bacteria.
Hypothesis 2:
Ha0 = There is no impact of level of education on the awareness about Mosquitos breed in
Tanzania
Ha1 = There is impact of level of education on the awareness about Mosquitos breed in Tanzania
Count:
Crosstab
Count
Do you know where mosquitos breed? Total
No Yes 2
Level of education
attained by Head
No formal
education
2 18 54 0 74
Primary 1-4 1 3 31 0 35
Primary 1-7 5 19 115 0 139
Form 1-4 0 0 42 1 43
Form 5-6 0 0 1 0 1
Other Certificates 0 0 3 0 3
Total 8 40 246 1 295
10
chevron_up_icon
1 out of 20
circle_padding
hide_on_mobile
zoom_out_icon
[object Object]