SPSS Exam 1: Statistical Analysis of Volunteer Survey Data and Results
VerifiedAdded on  2023/01/05
|11
|1500
|40
Homework Assignment
AI Summary
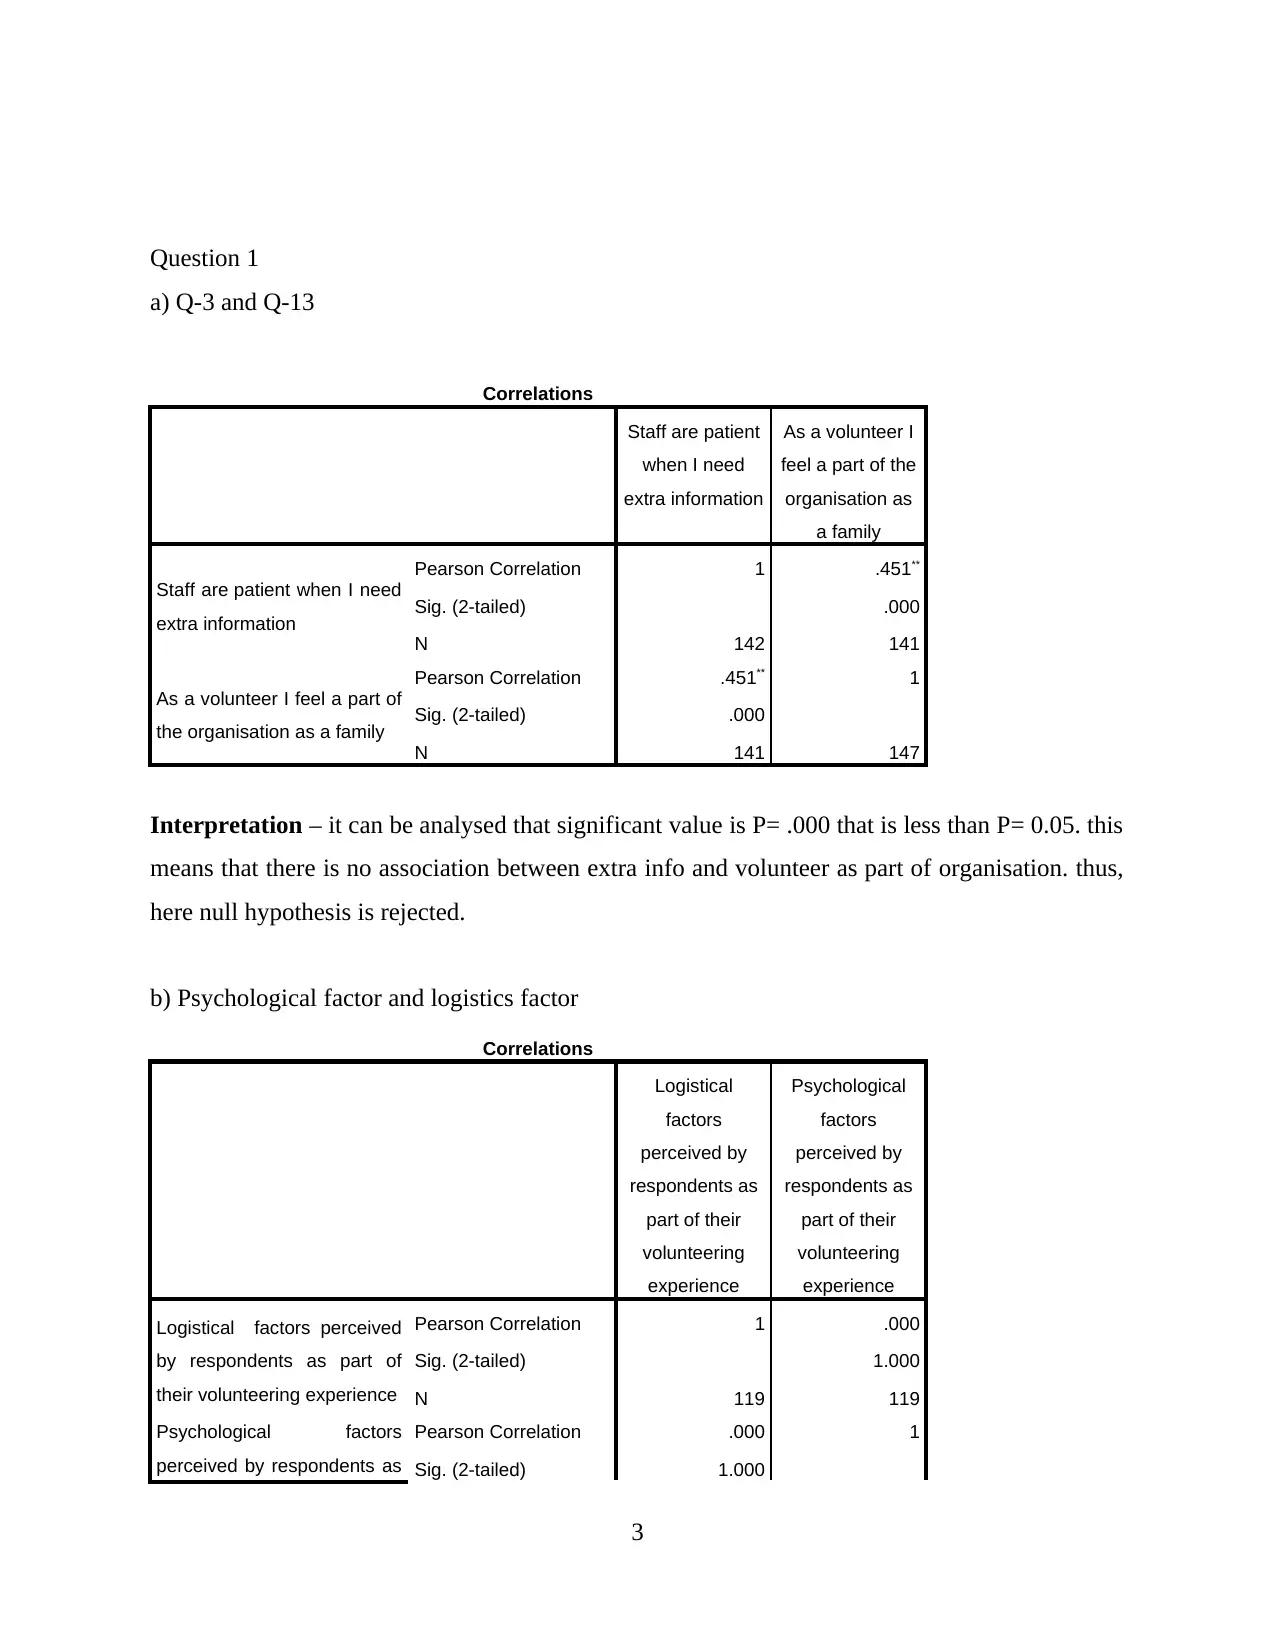
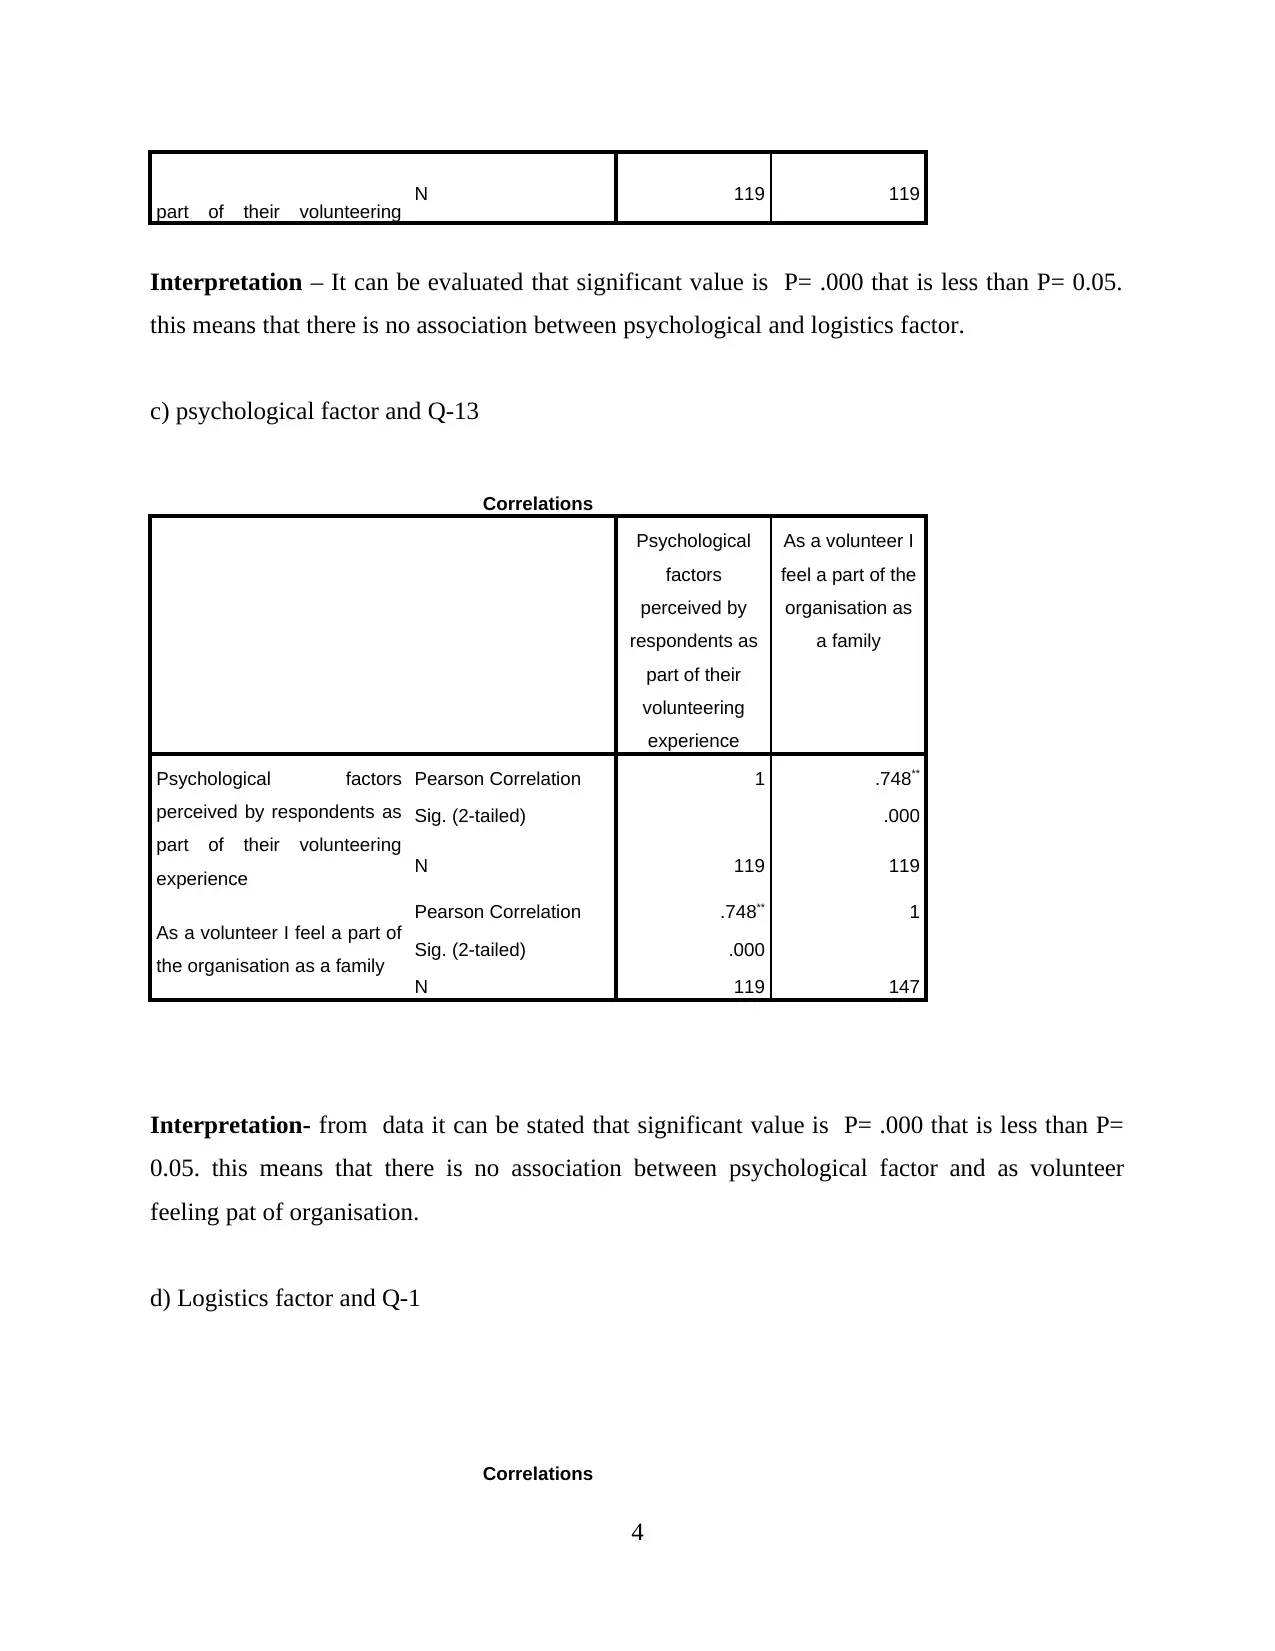
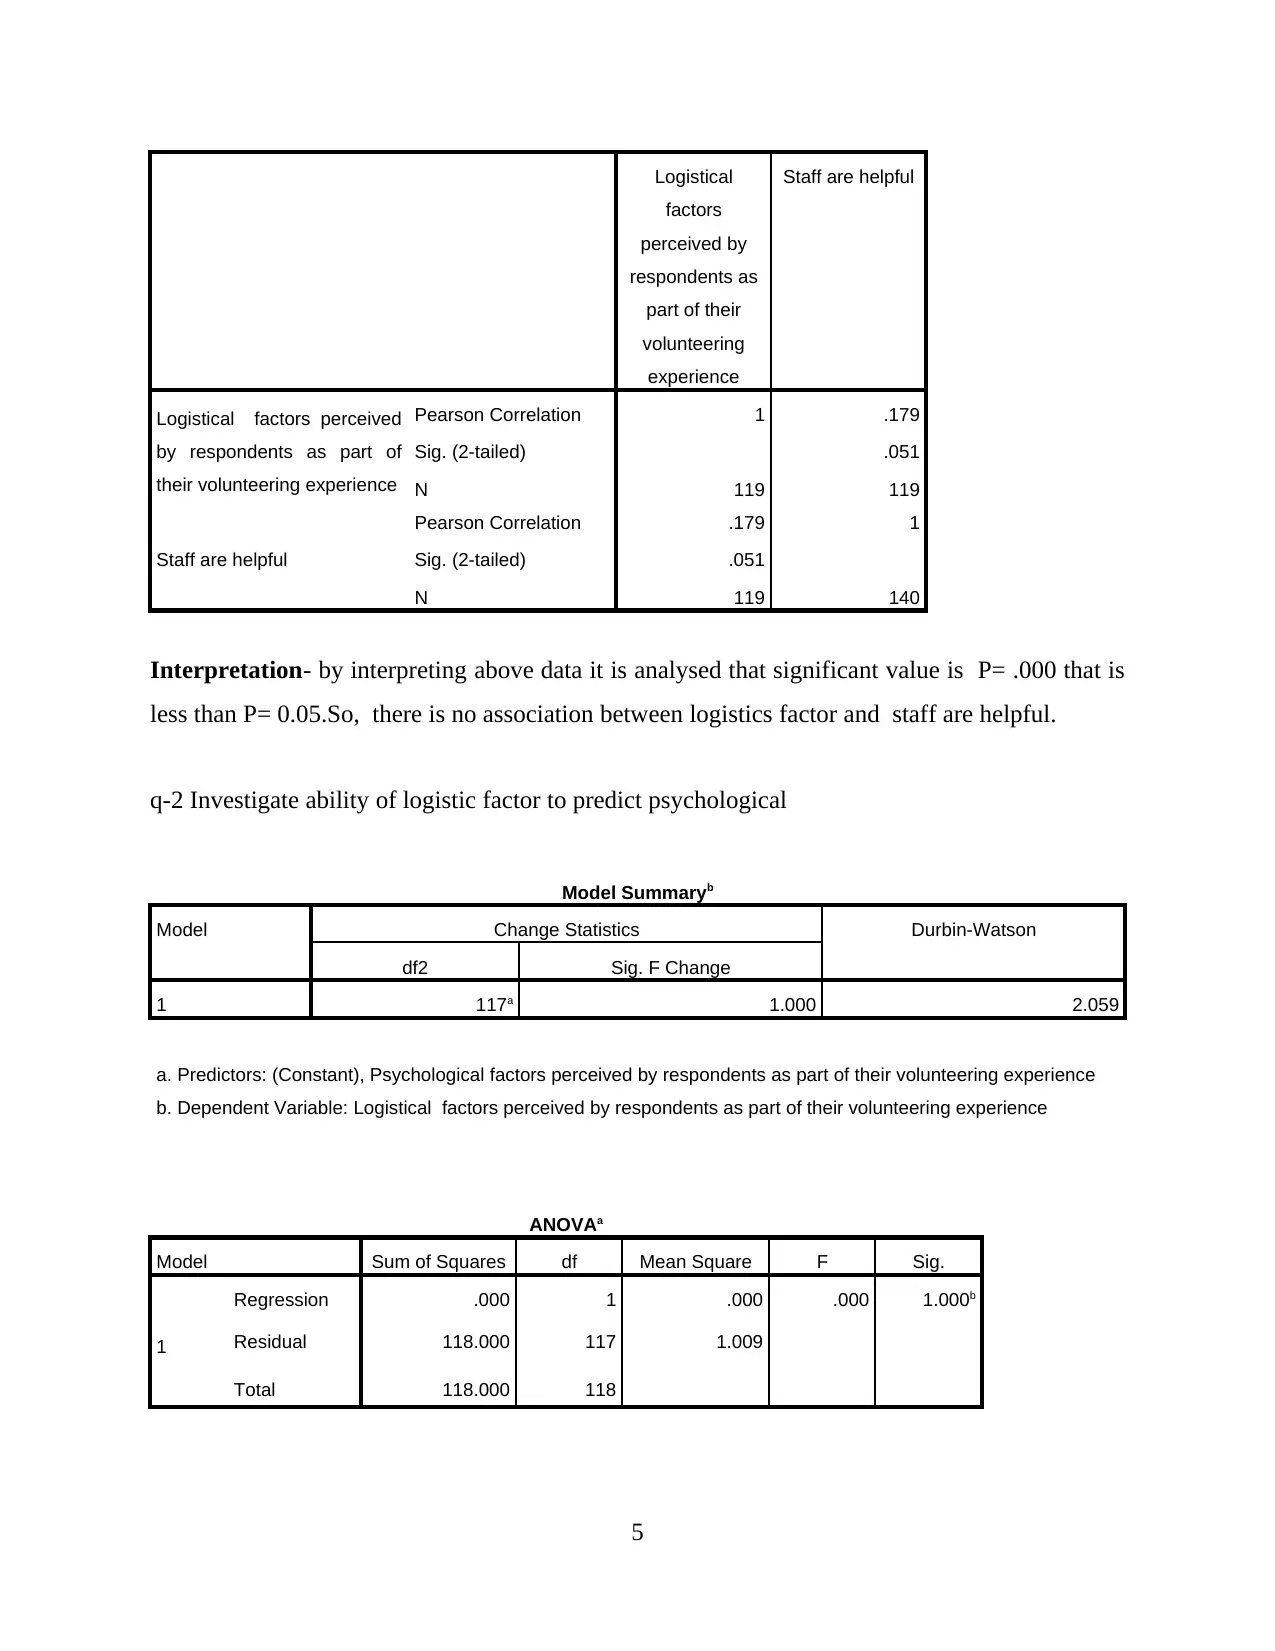
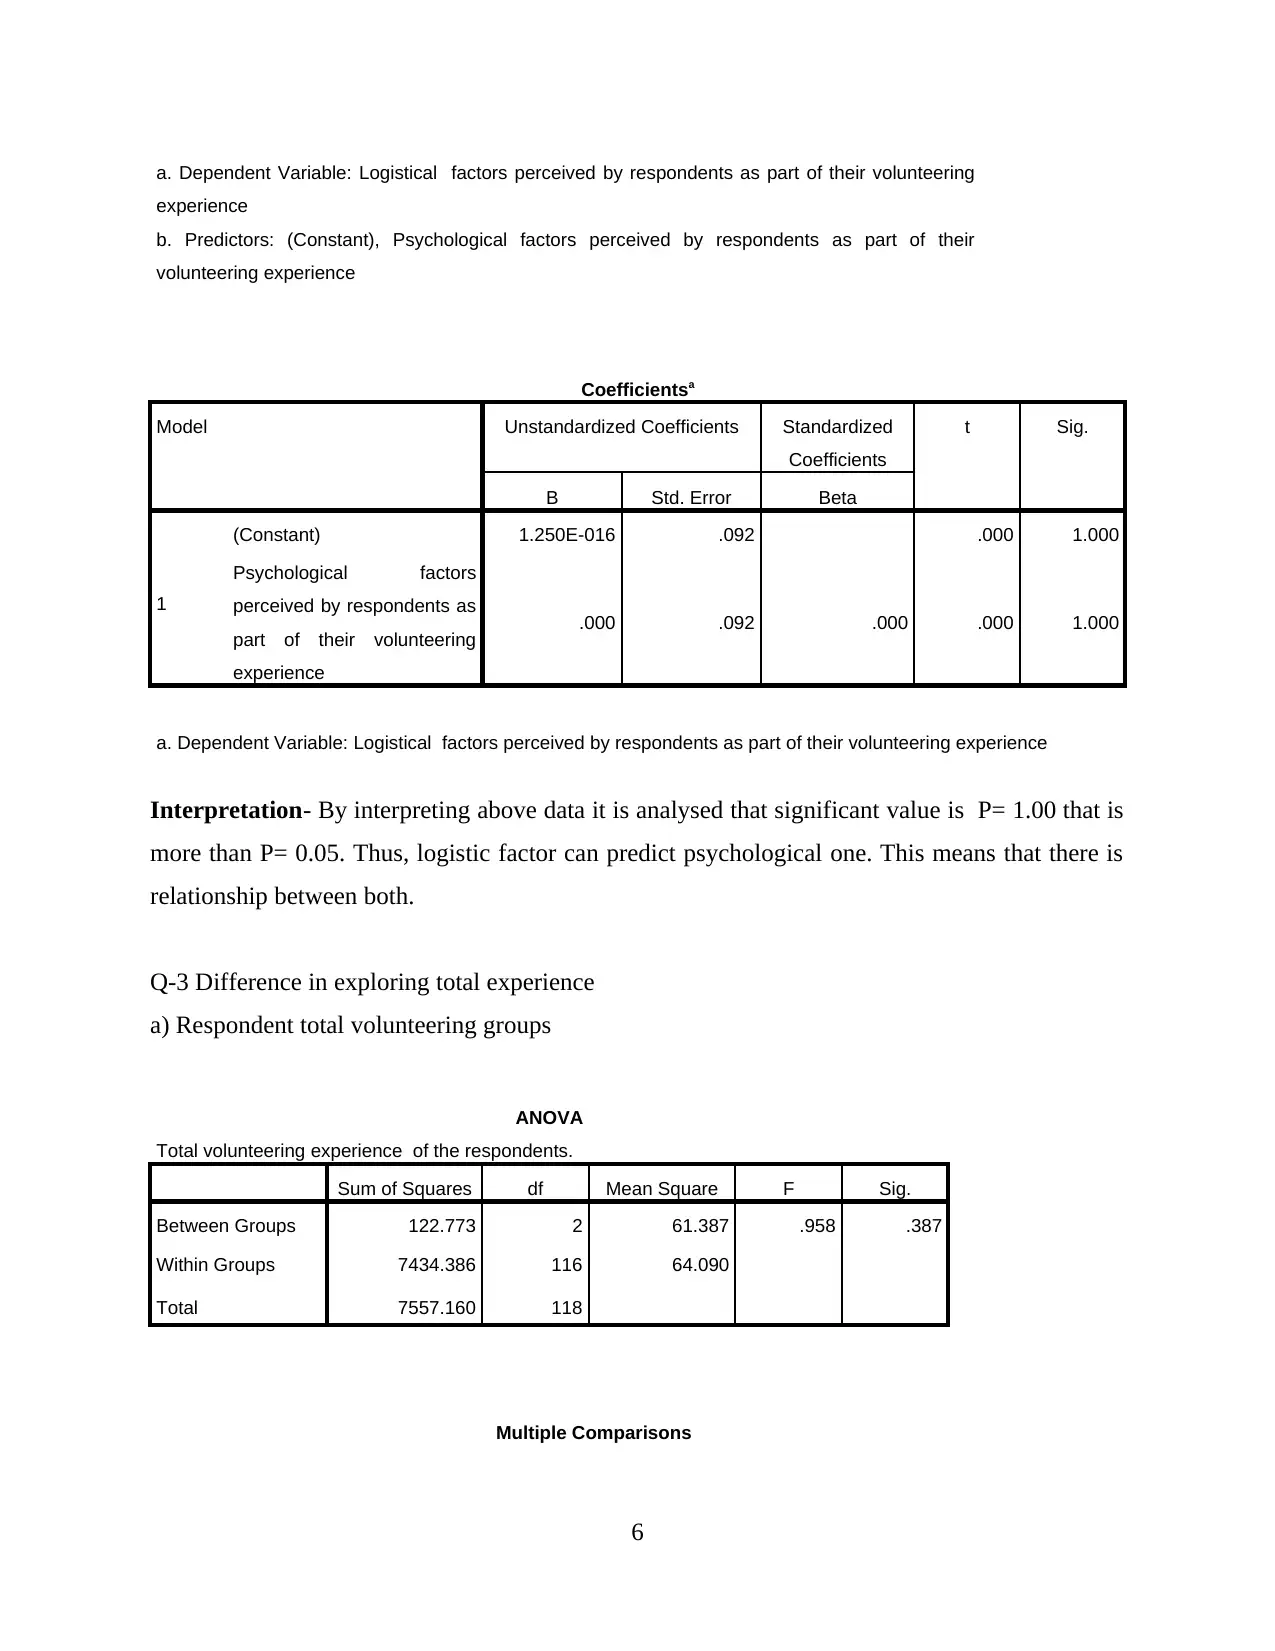
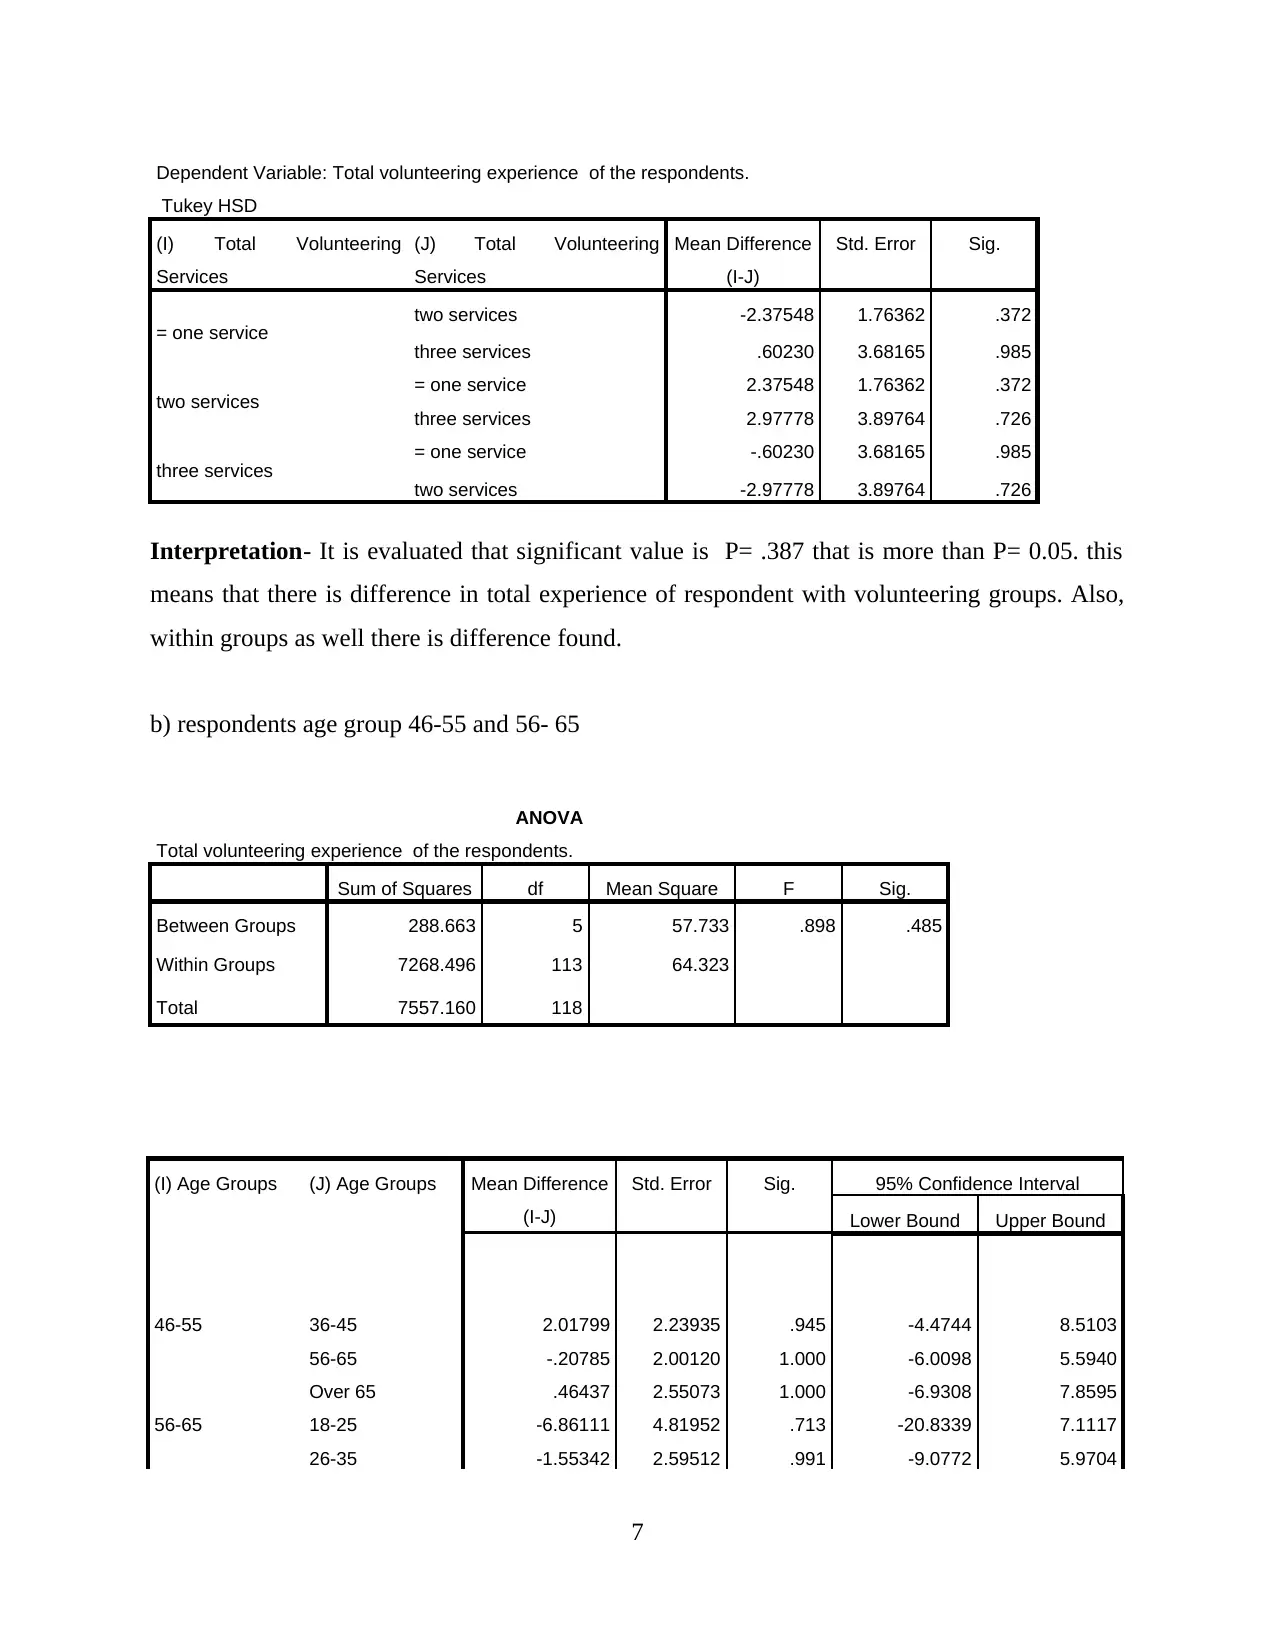
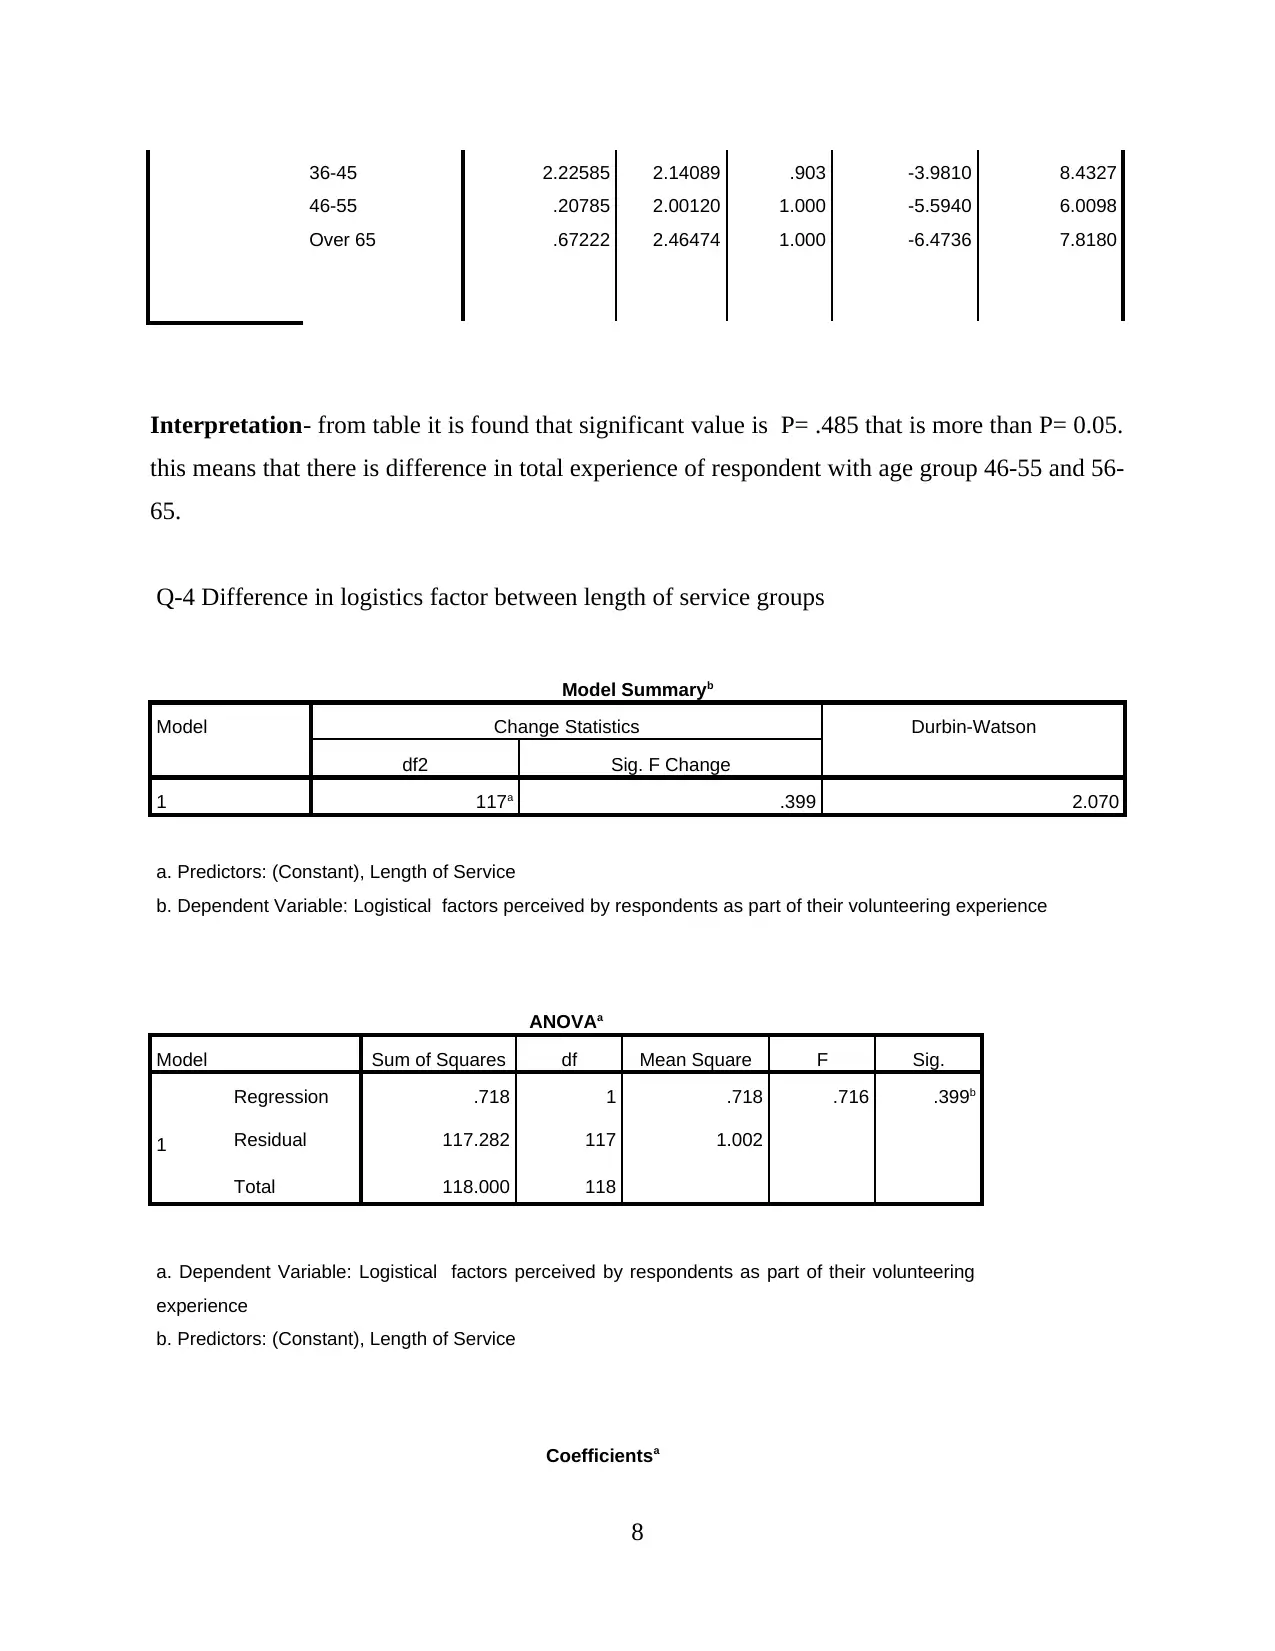
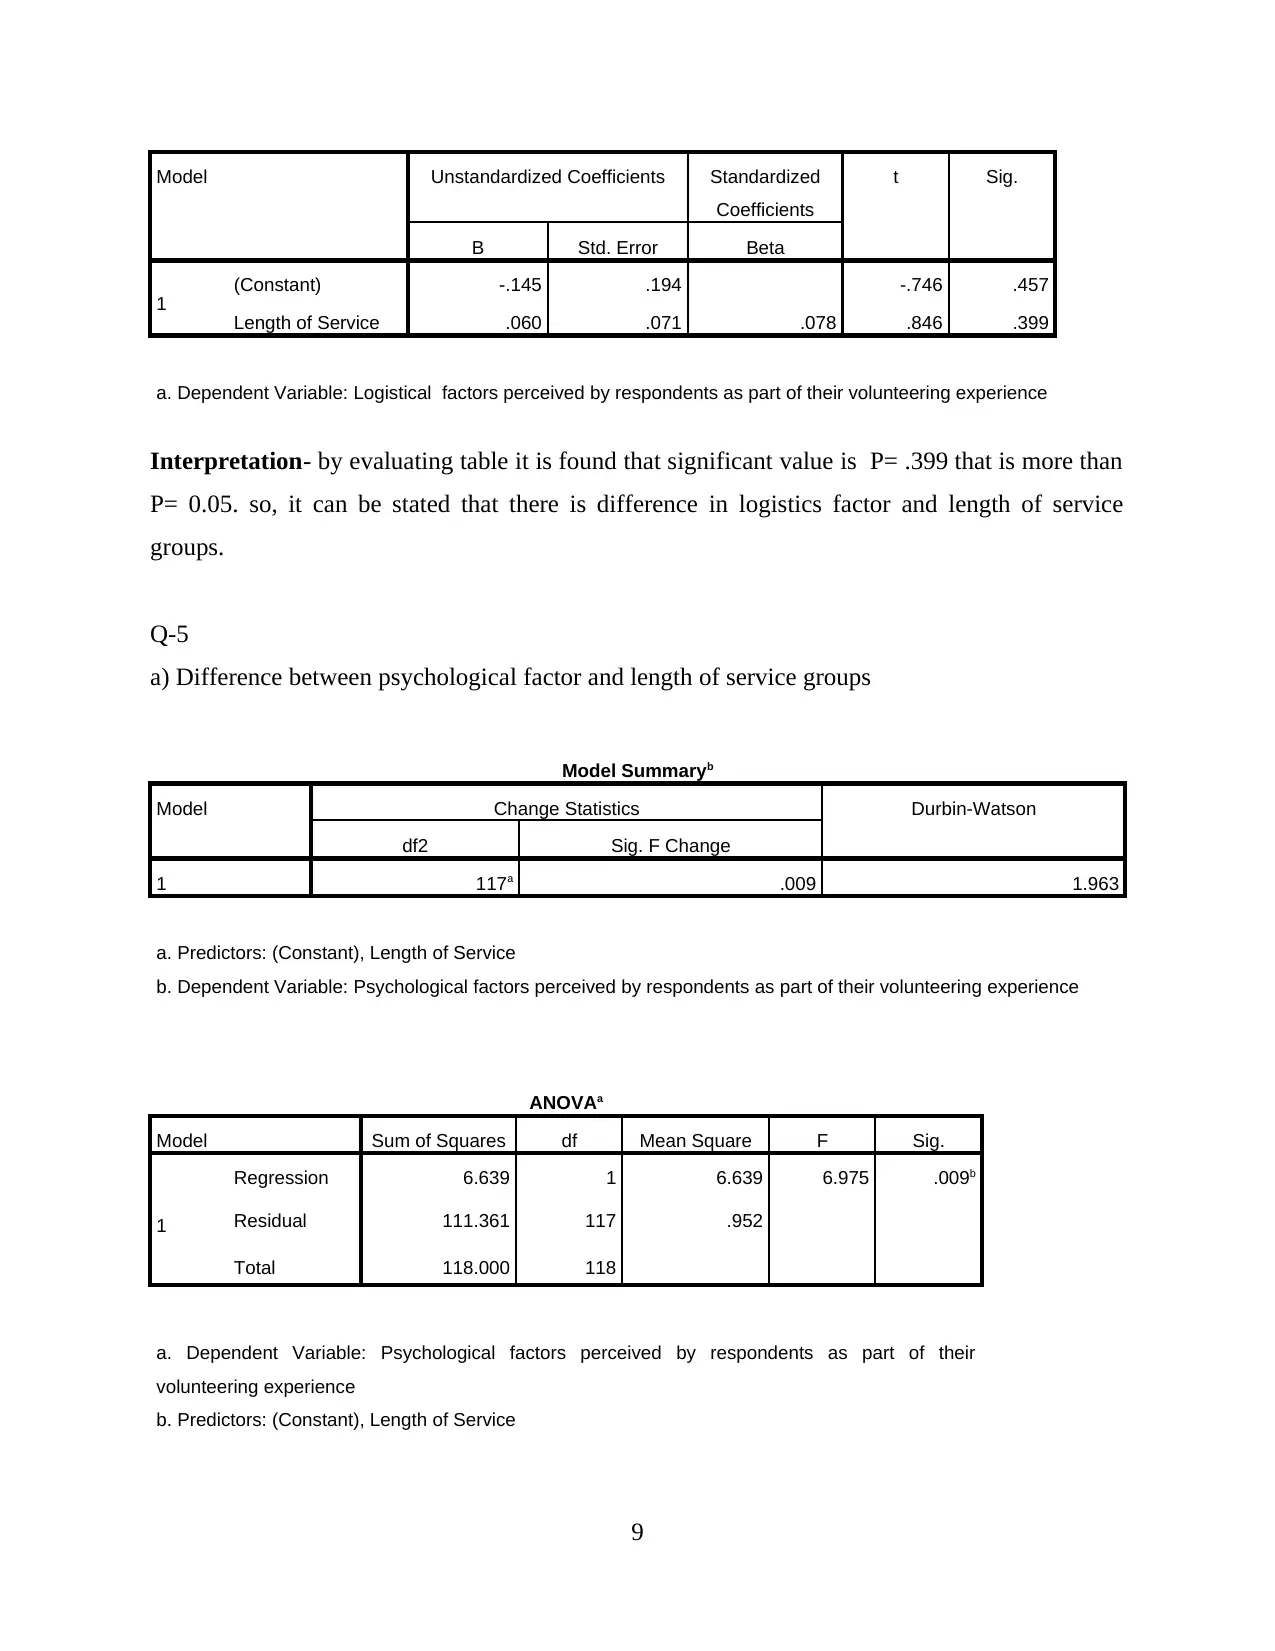
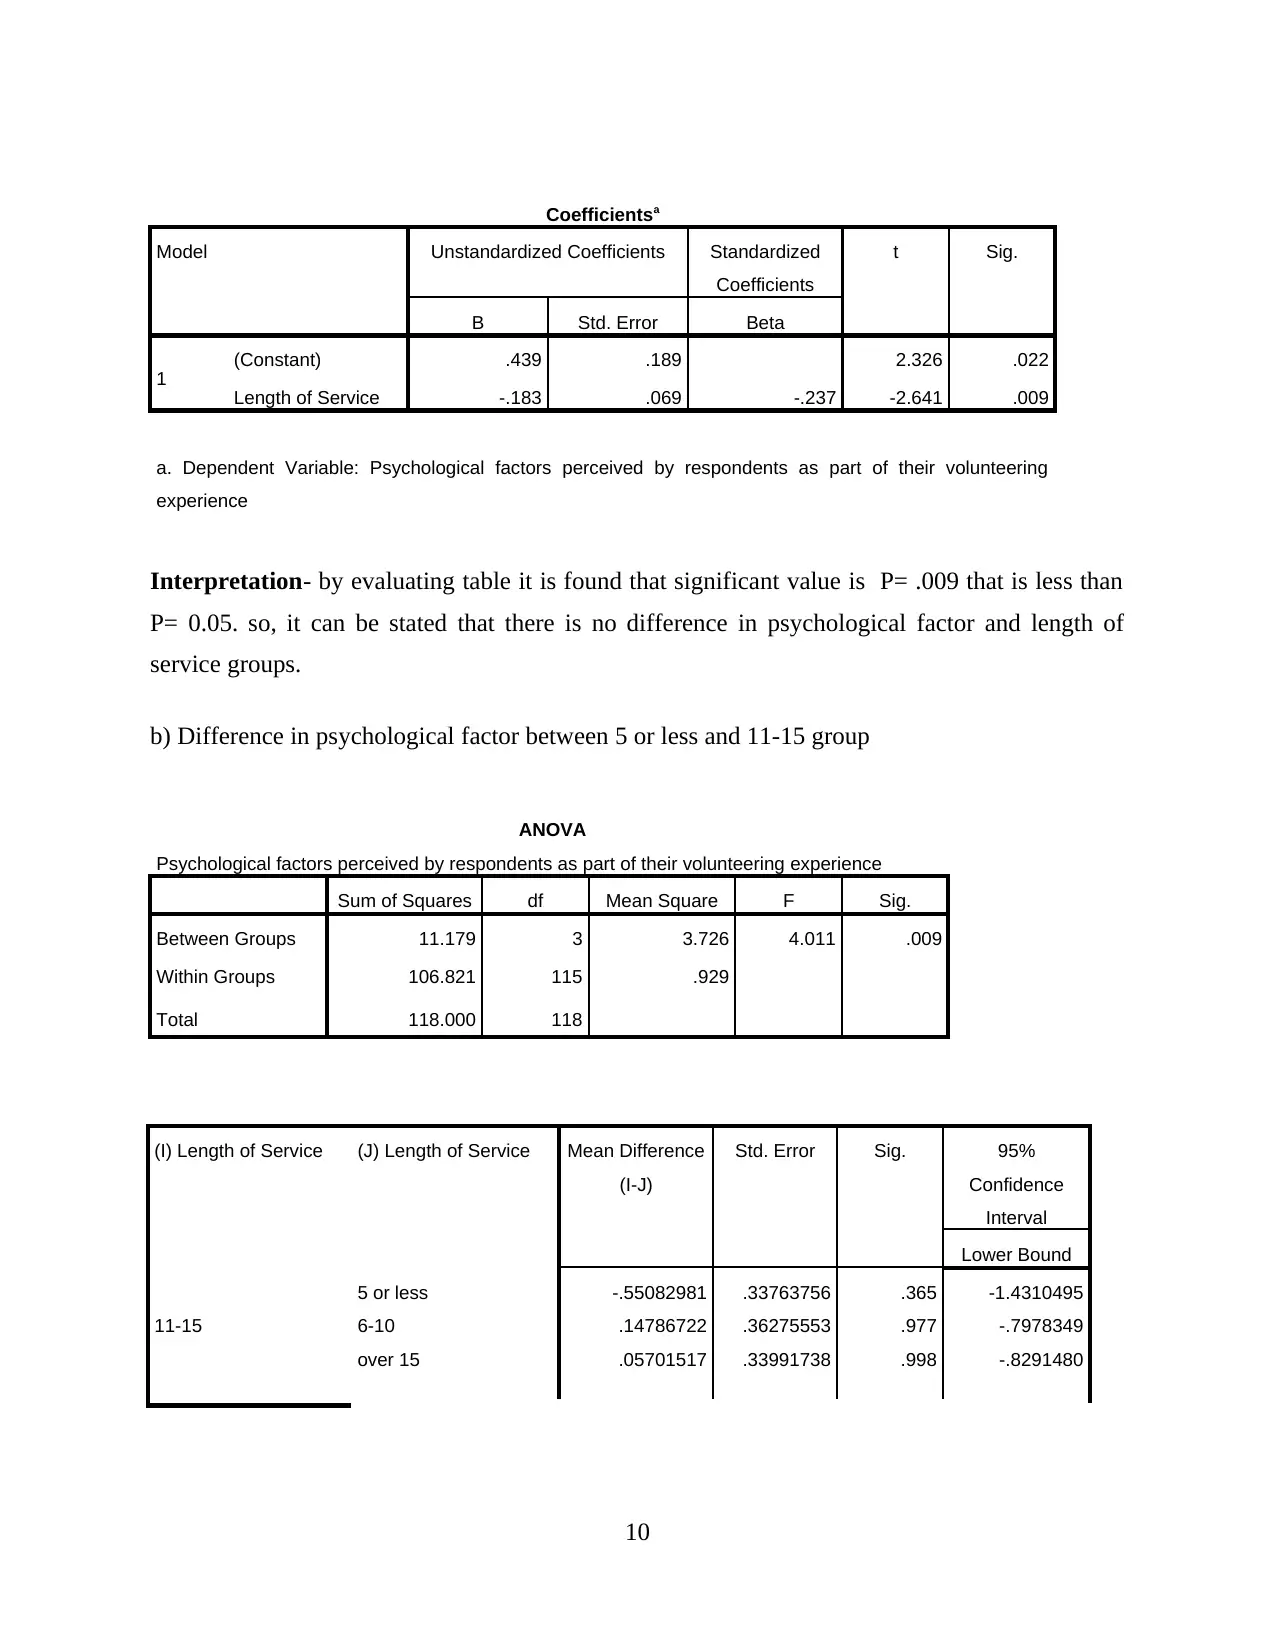
This document provides a comprehensive analysis of an SPSS exam, focusing on the statistical analysis of a volunteer survey. The analysis includes correlations, regression, and ANOVA tests to explore relationships between various factors such as psychological factors, logistical factors, and the overall volunteering experience. The document interprets the results, including p-values and significance levels, to determine associations between variables and the ability of certain factors to predict others. Specific questions address the relationship between staff helpfulness, volunteer feelings, and the impact of logistical factors on psychological factors. The analysis also examines differences in total volunteering experience across different volunteer groups and age groups, as well as the impact of the length of service on logistical and psychological factors. The results are meticulously interpreted, providing valuable insights into the volunteer experience and the underlying factors that influence it. This analysis is a valuable resource for students studying data analysis and statistics.

SPSS online exam
1
1
Paraphrase This Document
Need a fresh take? Get an instant paraphrase of this document with our AI Paraphraser

Table of Contents
2
2

Question 1
a) Q-3 and Q-13
Correlations
Staff are patient
when I need
extra information
As a volunteer I
feel a part of the
organisation as
a family
Staff are patient when I need
extra information
Pearson Correlation 1 .451**
Sig. (2-tailed) .000
N 142 141
As a volunteer I feel a part of
the organisation as a family
Pearson Correlation .451** 1
Sig. (2-tailed) .000
N 141 147
Interpretation – it can be analysed that significant value is P= .000 that is less than P= 0.05. this
means that there is no association between extra info and volunteer as part of organisation. thus,
here null hypothesis is rejected.
b) Psychological factor and logistics factor
Correlations
Logistical
factors
perceived by
respondents as
part of their
volunteering
experience
Psychological
factors
perceived by
respondents as
part of their
volunteering
experience
Logistical factors perceived
by respondents as part of
their volunteering experience
Pearson Correlation 1 .000
Sig. (2-tailed) 1.000
N 119 119
Psychological factors
perceived by respondents as
Pearson Correlation .000 1
Sig. (2-tailed) 1.000
3
⊘ This is a preview!⊘
Do you want full access?
Subscribe today to unlock all pages.

Trusted by 1+ million students worldwide

part of their volunteering N 119 119
Interpretation – It can be evaluated that significant value is P= .000 that is less than P= 0.05.
this means that there is no association between psychological and logistics factor.
c) psychological factor and Q-13
Correlations
Psychological
factors
perceived by
respondents as
part of their
volunteering
experience
As a volunteer I
feel a part of the
organisation as
a family
Psychological factors
perceived by respondents as
part of their volunteering
experience
Pearson Correlation 1 .748**
Sig. (2-tailed) .000
N 119 119
As a volunteer I feel a part of
the organisation as a family
Pearson Correlation .748** 1
Sig. (2-tailed) .000
N 119 147
Interpretation- from data it can be stated that significant value is P= .000 that is less than P=
0.05. this means that there is no association between psychological factor and as volunteer
feeling pat of organisation.
d) Logistics factor and Q-1
Correlations
4
Paraphrase This Document
Need a fresh take? Get an instant paraphrase of this document with our AI Paraphraser

Logistical
factors
perceived by
respondents as
part of their
volunteering
experience
Staff are helpful
Logistical factors perceived
by respondents as part of
their volunteering experience
Pearson Correlation 1 .179
Sig. (2-tailed) .051
N 119 119
Staff are helpful
Pearson Correlation .179 1
Sig. (2-tailed) .051
N 119 140
Interpretation- by interpreting above data it is analysed that significant value is P= .000 that is
less than P= 0.05.So, there is no association between logistics factor and staff are helpful.
q-2 Investigate ability of logistic factor to predict psychological
Model Summaryb
Model Change Statistics Durbin-Watson
df2 Sig. F Change
1 117a 1.000 2.059
a. Predictors: (Constant), Psychological factors perceived by respondents as part of their volunteering experience
b. Dependent Variable: Logistical factors perceived by respondents as part of their volunteering experience
ANOVAa
Model Sum of Squares df Mean Square F Sig.
1
Regression .000 1 .000 .000 1.000b
Residual 118.000 117 1.009
Total 118.000 118
5

a. Dependent Variable: Logistical factors perceived by respondents as part of their volunteering
experience
b. Predictors: (Constant), Psychological factors perceived by respondents as part of their
volunteering experience
Coefficientsa
Model Unstandardized Coefficients Standardized
Coefficients
t Sig.
B Std. Error Beta
1
(Constant) 1.250E-016 .092 .000 1.000
Psychological factors
perceived by respondents as
part of their volunteering
experience
.000 .092 .000 .000 1.000
a. Dependent Variable: Logistical factors perceived by respondents as part of their volunteering experience
Interpretation- By interpreting above data it is analysed that significant value is P= 1.00 that is
more than P= 0.05. Thus, logistic factor can predict psychological one. This means that there is
relationship between both.
Q-3 Difference in exploring total experience
a) Respondent total volunteering groups
ANOVA
Total volunteering experience of the respondents.
Sum of Squares df Mean Square F Sig.
Between Groups 122.773 2 61.387 .958 .387
Within Groups 7434.386 116 64.090
Total 7557.160 118
Multiple Comparisons
6
experience
b. Predictors: (Constant), Psychological factors perceived by respondents as part of their
volunteering experience
Coefficientsa
Model Unstandardized Coefficients Standardized
Coefficients
t Sig.
B Std. Error Beta
1
(Constant) 1.250E-016 .092 .000 1.000
Psychological factors
perceived by respondents as
part of their volunteering
experience
.000 .092 .000 .000 1.000
a. Dependent Variable: Logistical factors perceived by respondents as part of their volunteering experience
Interpretation- By interpreting above data it is analysed that significant value is P= 1.00 that is
more than P= 0.05. Thus, logistic factor can predict psychological one. This means that there is
relationship between both.
Q-3 Difference in exploring total experience
a) Respondent total volunteering groups
ANOVA
Total volunteering experience of the respondents.
Sum of Squares df Mean Square F Sig.
Between Groups 122.773 2 61.387 .958 .387
Within Groups 7434.386 116 64.090
Total 7557.160 118
Multiple Comparisons
6
⊘ This is a preview!⊘
Do you want full access?
Subscribe today to unlock all pages.

Trusted by 1+ million students worldwide

Dependent Variable: Total volunteering experience of the respondents.
Tukey HSD
(I) Total Volunteering
Services
(J) Total Volunteering
Services
Mean Difference
(I-J)
Std. Error Sig.
= one service two services -2.37548 1.76362 .372
three services .60230 3.68165 .985
two services = one service 2.37548 1.76362 .372
three services 2.97778 3.89764 .726
three services = one service -.60230 3.68165 .985
two services -2.97778 3.89764 .726
Interpretation- It is evaluated that significant value is P= .387 that is more than P= 0.05. this
means that there is difference in total experience of respondent with volunteering groups. Also,
within groups as well there is difference found.
b) respondents age group 46-55 and 56- 65
ANOVA
Total volunteering experience of the respondents.
Sum of Squares df Mean Square F Sig.
Between Groups 288.663 5 57.733 .898 .485
Within Groups 7268.496 113 64.323
Total 7557.160 118
(I) Age Groups (J) Age Groups Mean Difference
(I-J)
Std. Error Sig. 95% Confidence Interval
Lower Bound Upper Bound
46-55 36-45 2.01799 2.23935 .945 -4.4744 8.5103
56-65 -.20785 2.00120 1.000 -6.0098 5.5940
Over 65 .46437 2.55073 1.000 -6.9308 7.8595
56-65 18-25 -6.86111 4.81952 .713 -20.8339 7.1117
26-35 -1.55342 2.59512 .991 -9.0772 5.9704
7
Paraphrase This Document
Need a fresh take? Get an instant paraphrase of this document with our AI Paraphraser

36-45 2.22585 2.14089 .903 -3.9810 8.4327
46-55 .20785 2.00120 1.000 -5.5940 6.0098
Over 65 .67222 2.46474 1.000 -6.4736 7.8180
Interpretation- from table it is found that significant value is P= .485 that is more than P= 0.05.
this means that there is difference in total experience of respondent with age group 46-55 and 56-
65.
Q-4 Difference in logistics factor between length of service groups
Model Summaryb
Model Change Statistics Durbin-Watson
df2 Sig. F Change
1 117a .399 2.070
a. Predictors: (Constant), Length of Service
b. Dependent Variable: Logistical factors perceived by respondents as part of their volunteering experience
ANOVAa
Model Sum of Squares df Mean Square F Sig.
1
Regression .718 1 .718 .716 .399b
Residual 117.282 117 1.002
Total 118.000 118
a. Dependent Variable: Logistical factors perceived by respondents as part of their volunteering
experience
b. Predictors: (Constant), Length of Service
Coefficientsa
8

Model Unstandardized Coefficients Standardized
Coefficients
t Sig.
B Std. Error Beta
1 (Constant) -.145 .194 -.746 .457
Length of Service .060 .071 .078 .846 .399
a. Dependent Variable: Logistical factors perceived by respondents as part of their volunteering experience
Interpretation- by evaluating table it is found that significant value is P= .399 that is more than
P= 0.05. so, it can be stated that there is difference in logistics factor and length of service
groups.
Q-5
a) Difference between psychological factor and length of service groups
Model Summaryb
Model Change Statistics Durbin-Watson
df2 Sig. F Change
1 117a .009 1.963
a. Predictors: (Constant), Length of Service
b. Dependent Variable: Psychological factors perceived by respondents as part of their volunteering experience
ANOVAa
Model Sum of Squares df Mean Square F Sig.
1
Regression 6.639 1 6.639 6.975 .009b
Residual 111.361 117 .952
Total 118.000 118
a. Dependent Variable: Psychological factors perceived by respondents as part of their
volunteering experience
b. Predictors: (Constant), Length of Service
9
⊘ This is a preview!⊘
Do you want full access?
Subscribe today to unlock all pages.

Trusted by 1+ million students worldwide

Coefficientsa
Model Unstandardized Coefficients Standardized
Coefficients
t Sig.
B Std. Error Beta
1 (Constant) .439 .189 2.326 .022
Length of Service -.183 .069 -.237 -2.641 .009
a. Dependent Variable: Psychological factors perceived by respondents as part of their volunteering
experience
Interpretation- by evaluating table it is found that significant value is P= .009 that is less than
P= 0.05. so, it can be stated that there is no difference in psychological factor and length of
service groups.
b) Difference in psychological factor between 5 or less and 11-15 group
ANOVA
Psychological factors perceived by respondents as part of their volunteering experience
Sum of Squares df Mean Square F Sig.
Between Groups 11.179 3 3.726 4.011 .009
Within Groups 106.821 115 .929
Total 118.000 118
(I) Length of Service (J) Length of Service Mean Difference
(I-J)
Std. Error Sig. 95%
Confidence
Interval
Lower Bound
11-15
5 or less -.55082981 .33763756 .365 -1.4310495
6-10 .14786722 .36275553 .977 -.7978349
over 15 .05701517 .33991738 .998 -.8291480
10
Paraphrase This Document
Need a fresh take? Get an instant paraphrase of this document with our AI Paraphraser

Interpretation- the table state that significant value is P= .009 that is less than P= 0.05. thus,
there is no difference in psychological factor and 11-15 group. This means that null hypothesis
accepted.
11
there is no difference in psychological factor and 11-15 group. This means that null hypothesis
accepted.
11
1 out of 11
Your All-in-One AI-Powered Toolkit for Academic Success.
 +13062052269
info@desklib.com
Available 24*7 on WhatsApp / Email
Unlock your academic potential
Copyright © 2020–2025 A2Z Services. All Rights Reserved. Developed and managed by ZUCOL.

