Data Modeling, SQL Queries, and Performance in FinanceDB - DAT 701
VerifiedAdded on 2023/06/07
|25
|4400
|343
Homework Assignment
AI Summary
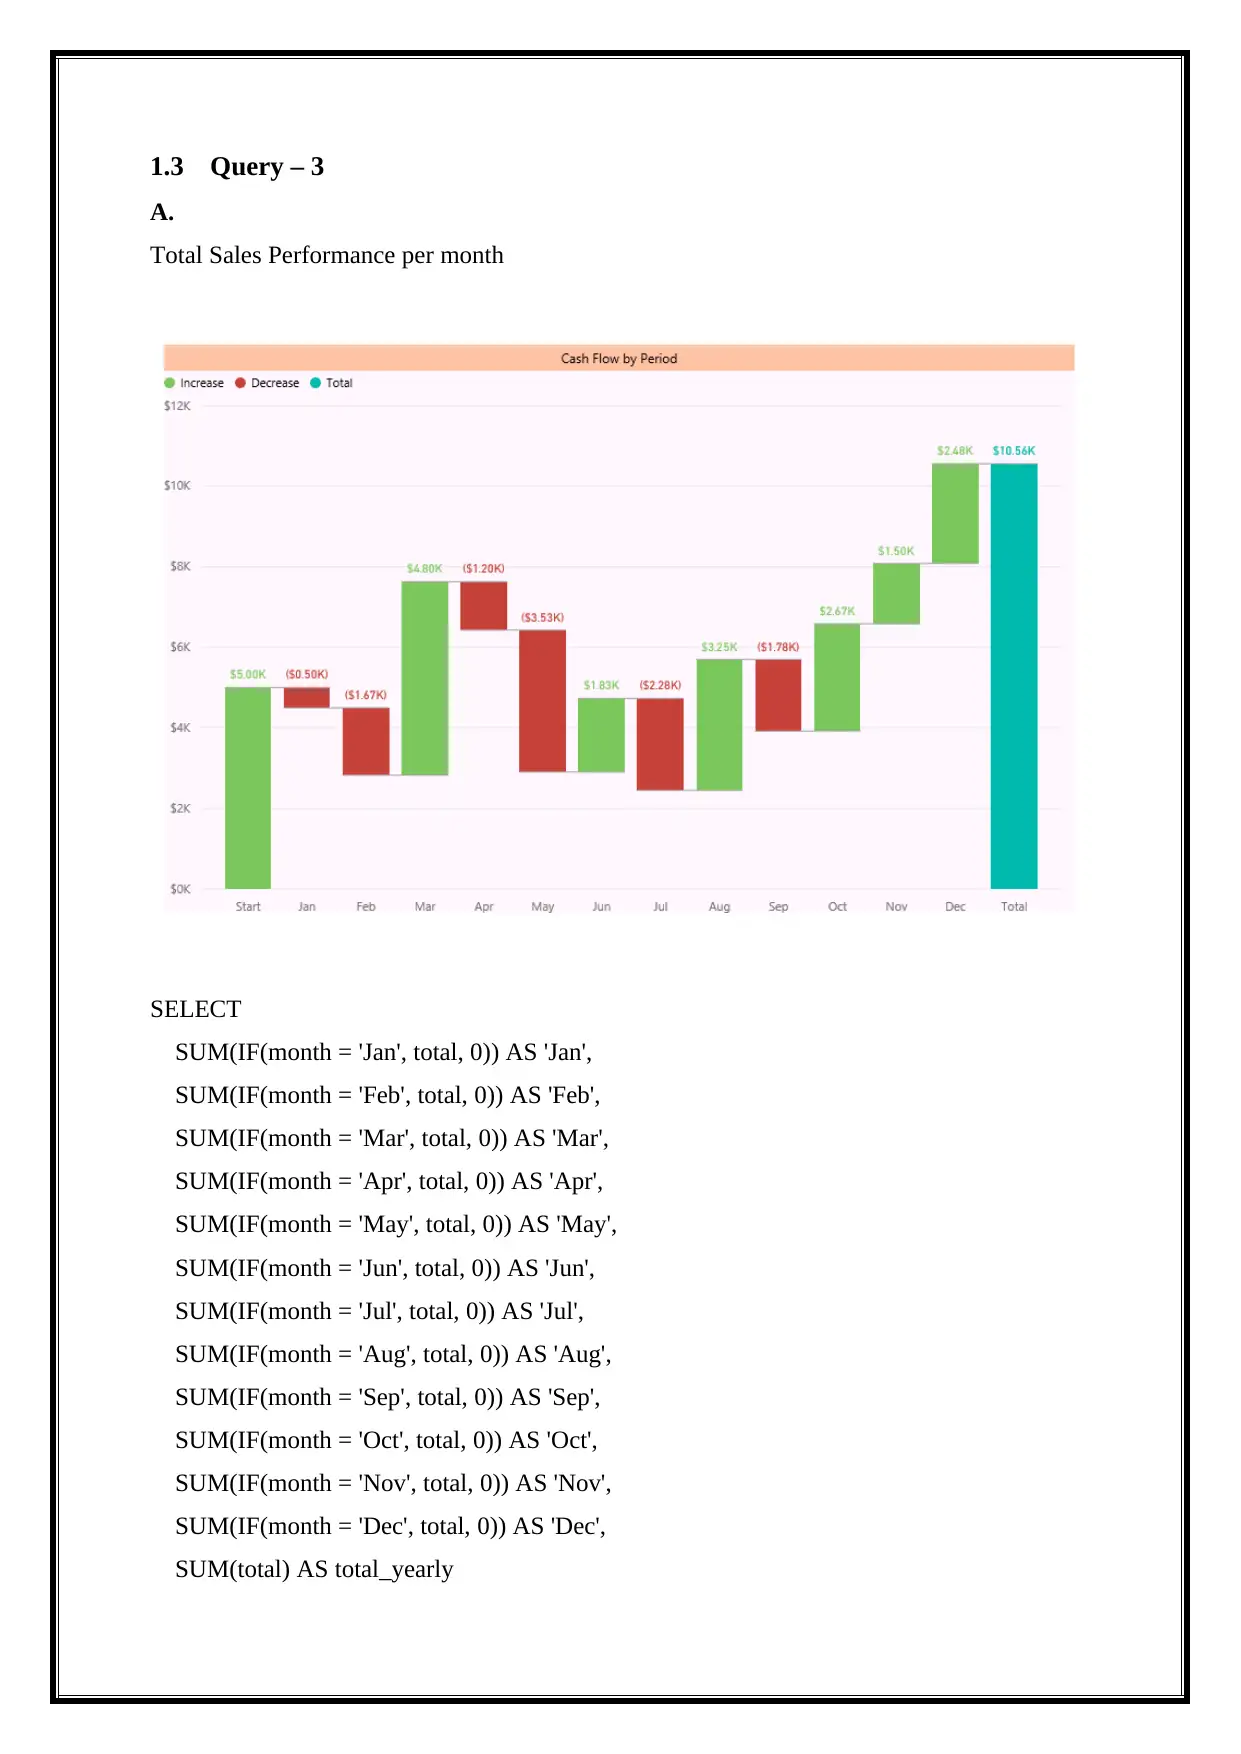
This assignment solution focuses on data modeling and SQL query design within the FinanceDB database, addressing reporting queries, query performance, and query design. Part A presents several reporting queries to extract and summarize data, including sales territories, yearly sales performance, and monthly sales trends. Part B delves into query performance, analyzing execution plans and index optimization to enhance query speed. It includes creating clustered indexes and evaluating the impact of database files on query execution. Part C covers query design principles, emphasizing the importance of execution plans in understanding SQL Server's query analyzer and motor. The assignment uses T-SQL and addresses database-specific tasks, offering insights into database engineering and query tuning. Desklib provides this document along with numerous other solved assignments and past papers to aid students in their studies.

Data Modeling
Paraphrase This Document
Need a fresh take? Get an instant paraphrase of this document with our AI Paraphraser

Table of Contents
1 Part - A Reporting Queries..............................................................................................2
1.1 Query – 1....................................................................................................................2
1.2 Query – 2....................................................................................................................4
1.3 Query – 3....................................................................................................................9
1.4 Query – 4..................................................................................................................10
2 Part - B Query Performance..........................................................................................11
2.1 Question - B1............................................................................................................11
2.2 Question - B2............................................................................................................15
3 Part - C Query Design....................................................................................................17
3.1 CA.............................................................................................................................18
3.2 CB..............................................................................................................................19
3.3 CC.............................................................................................................................21
References...............................................................................................................................24

1 Part - A Reporting Queries
Open finance data base on SQL management studio. It is represented in following figure.
1.1 Query – 1
EVALUATE
SUMMARIZECOLUMNS('City'[Sales Territory], "% of Grand Total", 'Order'[% of Grand
Total])
ORDER BY
[% of Grand Total] DESC, 'City'[Sales Territory]
Open finance data base on SQL management studio. It is represented in following figure.
1.1 Query – 1
EVALUATE
SUMMARIZECOLUMNS('City'[Sales Territory], "% of Grand Total", 'Order'[% of Grand
Total])
ORDER BY
[% of Grand Total] DESC, 'City'[Sales Territory]
⊘ This is a preview!⊘
Do you want full access?
Subscribe today to unlock all pages.

Trusted by 1+ million students worldwide

Paraphrase This Document
Need a fresh take? Get an instant paraphrase of this document with our AI Paraphraser

1.2 Query – 2
A. Yearly Sales
CREATE TABLE SalesPerYear
(Id INT PRIMARY KEY IDENTITY(1,1),
SalesYear INT,
Amount Float)
INSERT INTO SalesPerYear
VALUES ('2014','77'),('2015','66'),('2016','50') ,('2017','60'),('2018','73')
SELECT * ,
CASE
WHEN KpiTarget > Amount THEN -1
WHEN KpiTarget < Amount THEN 1
ELSE
0
END AS Sts
FROM
(
SELECT * , (SELECT AVG(Sl.Amount)*1.1 FROM SalesPerYear Sl) as KpiTarget
FROM SalesPerYear
) as tmp_tbl
order by SalesYear ASC
B.
Case
When IsEmpty
(ParallelPeriod
([Dim Date].[Calendar Date].[Calendar Year],1,
[Dim Date].[Calendar Date].CurrentMember))
Then 0
When VBA!Abs
(
KpiValue( "Product Gross Profit Margin" ) -
(

KpiValue ( "Product Gross Profit Margin" ),
ParallelPeriod
(
[Dim Date].[ Calendar Date].[ Calendar Year],
1,
[Dim Date].[ Calendar Date].CurrentMember
)
) /
(
KpiValue ( "Product Gross Profit Margin" ),
ParallelPeriod
(
[Dim Date].[ Calendar Date].[ Calendar Year],
1,
[Dim Date].[ Calendar Date].CurrentMember
)
)
) <=.02
Then 0
When KpiValue( "Product Gross Profit Margin" ) -
(
KpiValue ( "Product Gross Profit Margin" ),
ParallelPeriod
(
[Dim Date].[ Calendar Date].[ Calendar Year],
1,
[Dim Date].[ Calendar Date].CurrentMember
)
) /
(
KpiValue ( "Product Gross Profit Margin" ),
ParallelPeriod
(
[Dim Date].[Calendar Date].[Calendar Year],
ParallelPeriod
(
[Dim Date].[ Calendar Date].[ Calendar Year],
1,
[Dim Date].[ Calendar Date].CurrentMember
)
) /
(
KpiValue ( "Product Gross Profit Margin" ),
ParallelPeriod
(
[Dim Date].[ Calendar Date].[ Calendar Year],
1,
[Dim Date].[ Calendar Date].CurrentMember
)
)
) <=.02
Then 0
When KpiValue( "Product Gross Profit Margin" ) -
(
KpiValue ( "Product Gross Profit Margin" ),
ParallelPeriod
(
[Dim Date].[ Calendar Date].[ Calendar Year],
1,
[Dim Date].[ Calendar Date].CurrentMember
)
) /
(
KpiValue ( "Product Gross Profit Margin" ),
ParallelPeriod
(
[Dim Date].[Calendar Date].[Calendar Year],
⊘ This is a preview!⊘
Do you want full access?
Subscribe today to unlock all pages.

Trusted by 1+ million students worldwide

1,
[Dim Date].[Calendar Date].CurrentMember
)
) >.02
Then 1
Else -1
End
SELECT {KPIValue("Product Gross Profit Margin"),
KPIGoal("Product Gross Profit Margin"),
KPIStatus("Product Gross Profit Margin"),
[Dim Date].[Calendar Date].CurrentMember
)
) >.02
Then 1
Else -1
End
SELECT {KPIValue("Product Gross Profit Margin"),
KPIGoal("Product Gross Profit Margin"),
KPIStatus("Product Gross Profit Margin"),
Paraphrase This Document
Need a fresh take? Get an instant paraphrase of this document with our AI Paraphraser

KPITrend("Product Gross Profit Margin")} on 0
FROM [Adventure Works DW]

C.
Total Sales Performance per year
⊘ This is a preview!⊘
Do you want full access?
Subscribe today to unlock all pages.

Trusted by 1+ million students worldwide

1.3 Query – 3
A.
Total Sales Performance per month
SELECT
SUM(IF(month = 'Jan', total, 0)) AS 'Jan',
SUM(IF(month = 'Feb', total, 0)) AS 'Feb',
SUM(IF(month = 'Mar', total, 0)) AS 'Mar',
SUM(IF(month = 'Apr', total, 0)) AS 'Apr',
SUM(IF(month = 'May', total, 0)) AS 'May',
SUM(IF(month = 'Jun', total, 0)) AS 'Jun',
SUM(IF(month = 'Jul', total, 0)) AS 'Jul',
SUM(IF(month = 'Aug', total, 0)) AS 'Aug',
SUM(IF(month = 'Sep', total, 0)) AS 'Sep',
SUM(IF(month = 'Oct', total, 0)) AS 'Oct',
SUM(IF(month = 'Nov', total, 0)) AS 'Nov',
SUM(IF(month = 'Dec', total, 0)) AS 'Dec',
SUM(total) AS total_yearly
Paraphrase This Document
Need a fresh take? Get an instant paraphrase of this document with our AI Paraphraser

FROM (
SELECT DATE_FORMAT(date, "%b") AS month, SUM(total_price) as total
FROM cart
WHERE date <= NOW() and date >= Date_add(Now(),interval - 12 month)
GROUP BY DATE_FORMAT(date, "%m-%Y")) as sub
B.
The provided visualization is used to display the Total Sales Performance per month and it’s
up and down showed beautifully in the chart. Order of period category is also right, and that
is because of the Sort by Column setting we’ve done in previous section.
1.4 Query – 4
A.
Assess the center of a salesman's execution by following not just the general deals and edge
targets against spending plan, yet the particular quantifiable objectives recognized before.
How does each record perform in general deals and gross edges? What items are being sold?
What product offerings ought to be sold straightaway? Also, how is the client performing
contrasted and comparable ones? Check additionally the item blend execution by class. What
edges are these being sold at? Contrasted and like clients? Seek after "open chances" that the
sales representative may have not yet caught inside every client and product offering. From
that point forward, contrast these outcomes with comparable deals groups, both as far as size
and client blend. How would they rate? Look at against the organization's demonstrated
benchmark. Where do they rank? This gives the sales representative a preview of his or her
individual business execution while likewise giving a positioning of sorts when contrasted
with the organization benchmark.
B.
select salesname, orderamount
from (
select
rank() over(partition by s.SalesName order by o.OrderAmount desc) as rnk
,s.SalesName
,o.OrderAmount

From Orders o
join SalesPerson s on o.SalesID = s.SalesID) t
C.
WITH total_sales
AS (SELECT TOP 10 FROM Sales),
(SELECT region, person, count(*) as thousands
FROM sales
GROUP BY region, person
ORDER BY region, count(*) desc
)
, ranked_sales
AS (SELECT region, person, thousands,
ROW_NUMBER() OVER (PARTITION BY region ORDER BY thousands
DESC, person) AS region_rank
FROM total_sales
)
SELECT region, person, thousands
FROM ranked_sales
order by rank;
2 Part - B Query Performance
2.1 Question - B1
select
year(so.SalesOrderDate) as SalesYear,
⊘ This is a preview!⊘
Do you want full access?
Subscribe today to unlock all pages.

Trusted by 1+ million students worldwide
1 out of 25
Related Documents
Your All-in-One AI-Powered Toolkit for Academic Success.
+13062052269
info@desklib.com
Available 24*7 on WhatsApp / Email
Unlock your academic potential
Copyright © 2020–2025 A2Z Services. All Rights Reserved. Developed and managed by ZUCOL.


