Comprehensive Trend Analysis of Sri Lanka's GDP Growth (1962-2017)

Verified

Added on  2023/04/07

|9
|1201
|235
Report
AI Summary
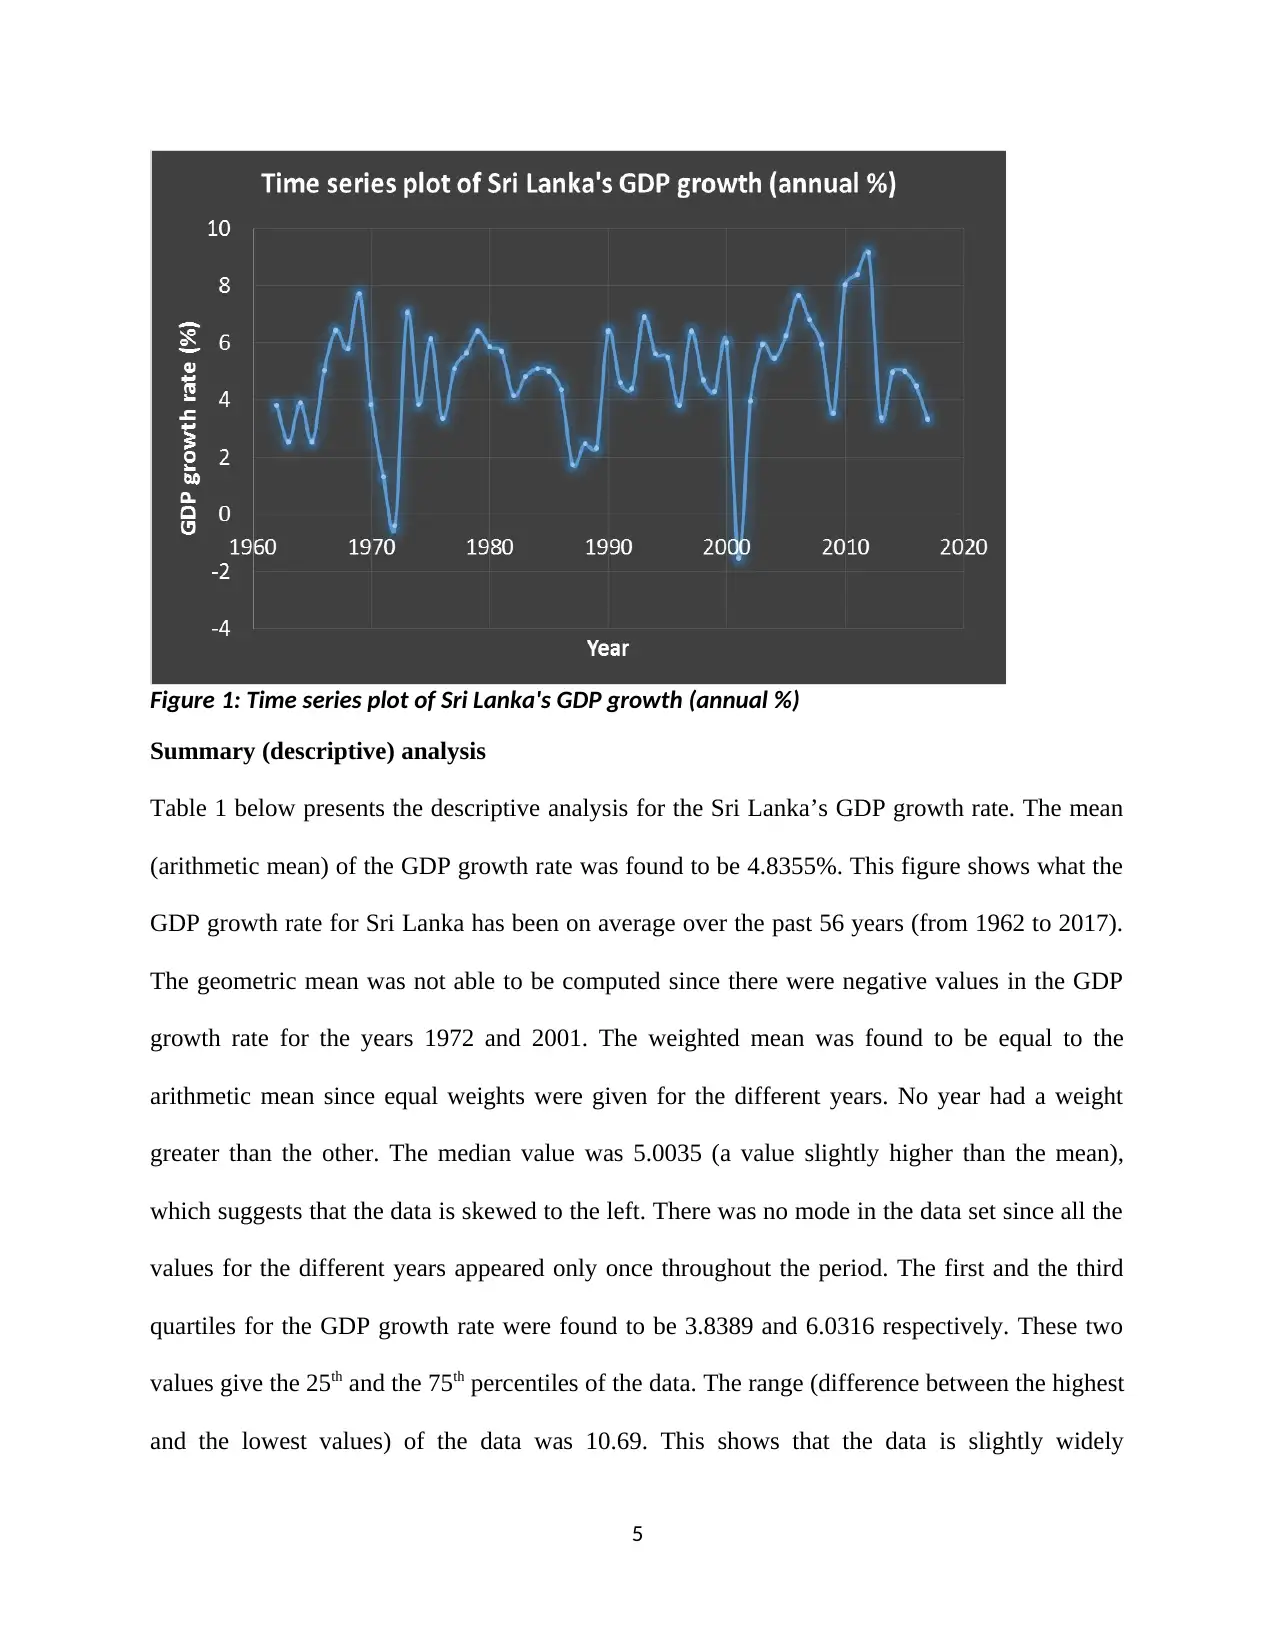
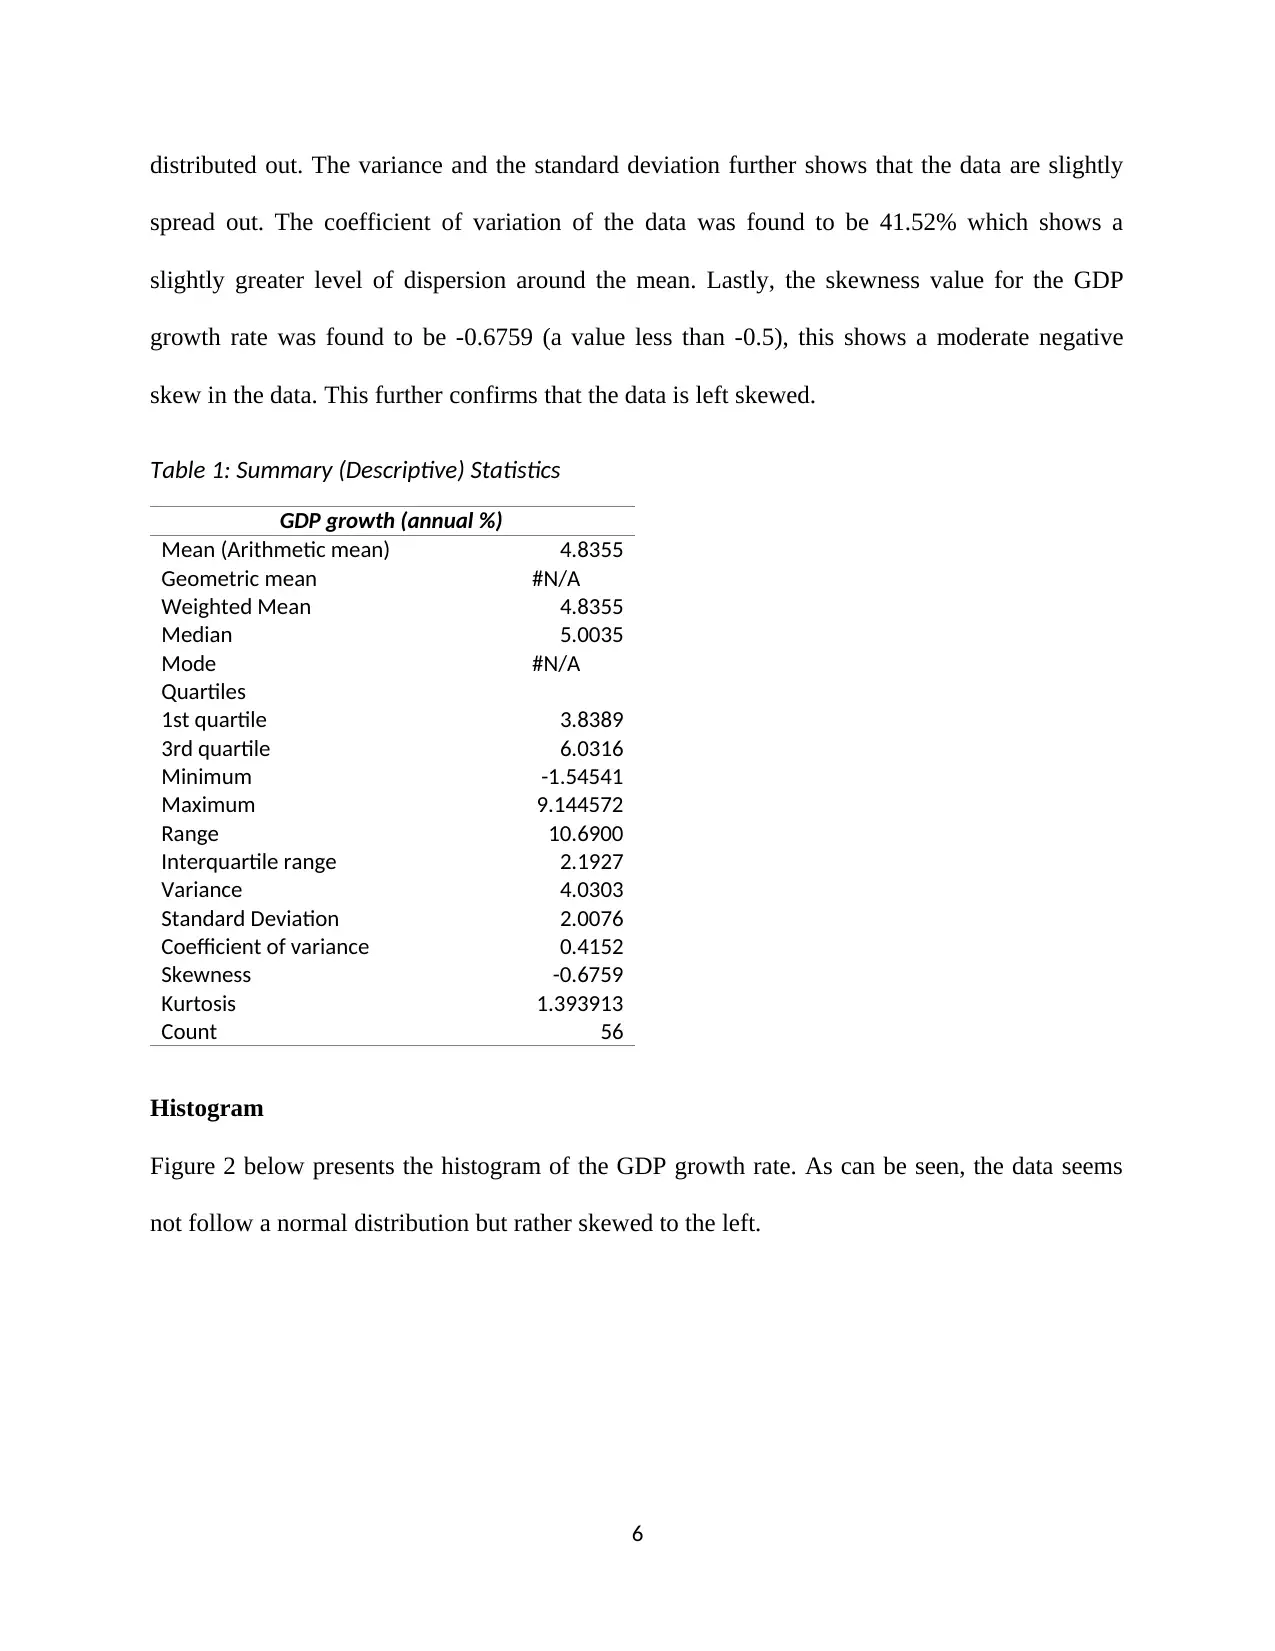
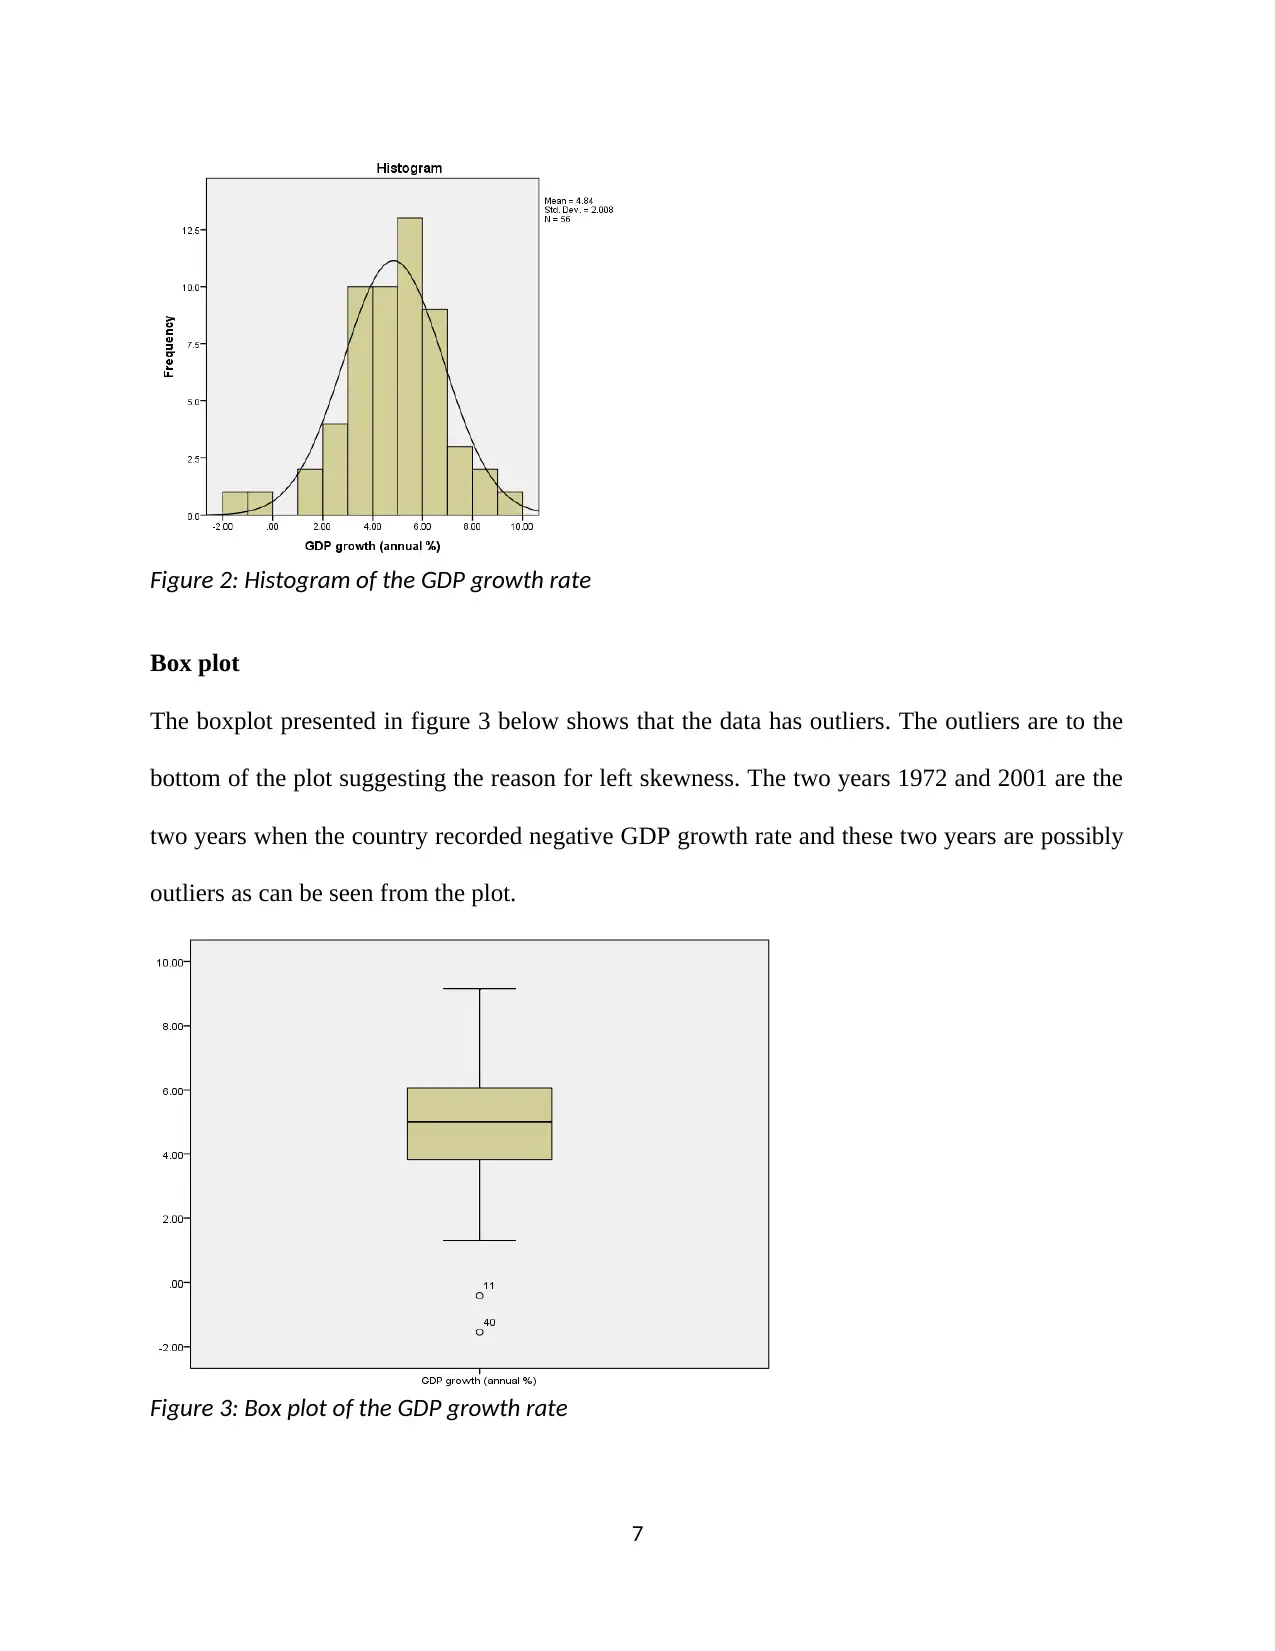
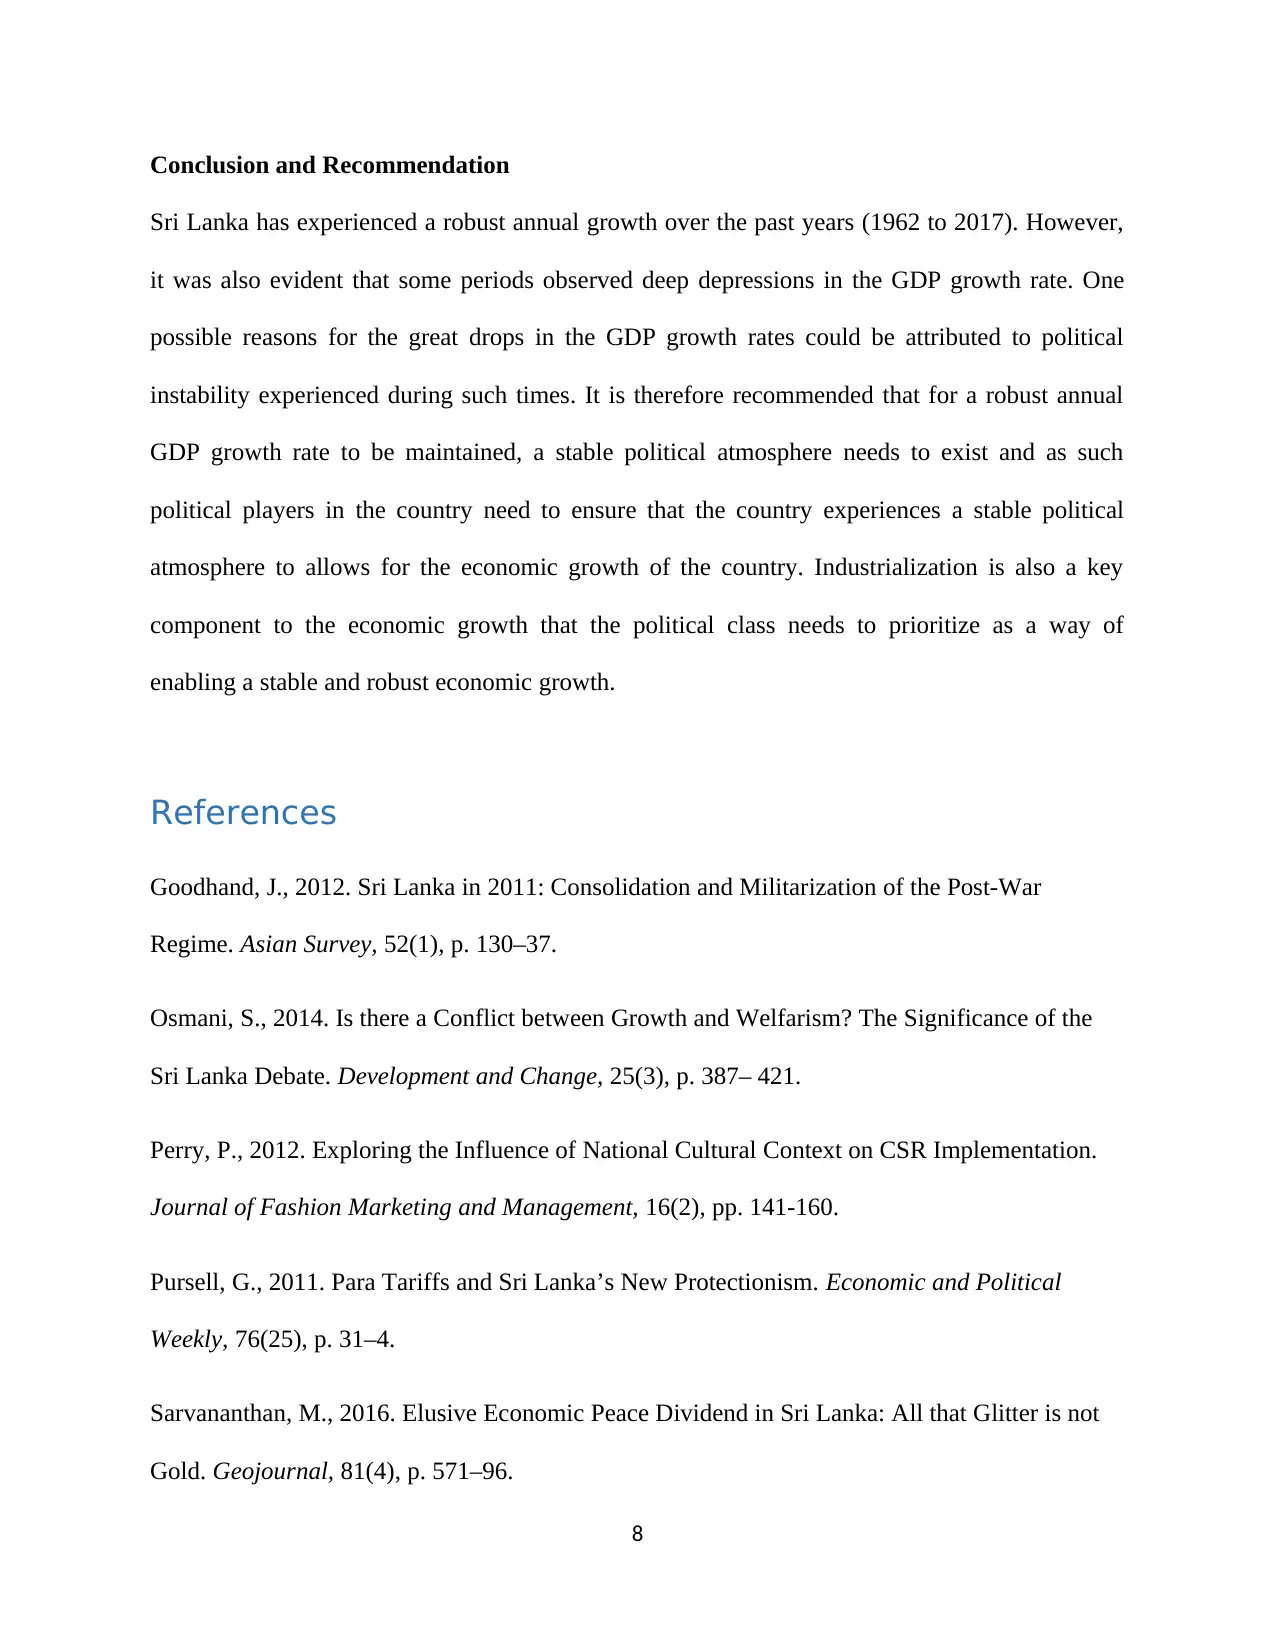
This report presents a trend analysis of Sri Lanka's GDP growth rate from 1962 to 2017. The analysis utilizes descriptive statistics, including mean, median, quartiles, and measures of dispersion to characterize the data. The report includes a time series plot to visualize GDP fluctuations over time, revealing periods of growth and decline. A histogram and box plot are used to assess the distribution and identify outliers in the data. The findings indicate a generally robust annual growth with notable depressions in specific periods. The conclusion highlights the importance of political stability and industrialization for sustaining economic growth and provides recommendations for future development. The report is a comprehensive overview of Sri Lanka's economic performance during the specified period.
Document Page
Trend Analysis of Sri Lanka’s GDP growth rate
Business Statistics
Name:
Institution:
14th March 2019
1
tabler-icon-diamond-filled.svg

Paraphrase This Document

Need a fresh take? Get an instant paraphrase of this document with our AI Paraphraser
Document Page
Table of Contents
Introduction......................................................................................................................................3
Literature Review............................................................................................................................3
Methodology....................................................................................................................................4
Findings...........................................................................................................................................4
Time series plot............................................................................................................................4
Summary (descriptive) analysis...................................................................................................5
Histogram.....................................................................................................................................6
Box plot........................................................................................................................................6
Conclusion and Recommendation...................................................................................................7
References........................................................................................................................................8
2
Document Page
Introduction
Sri Lanka is a developing country located at the southern coast of India. Regardless of long
periods of common war among the citizens, the nation has of late recorded tremendous and solid
development rates. The key sectors of the Sri Lanka's economy are the travel industry, apparel,
tea export, rice and textile production. Foreign remittances additionally form a crucial part of the
nation's income. This paper presents a trend analysis of the country's GDP growth rate dating
from 1962 to 2017.
Literature Review
The rich literature on the economic growth of Sri Lanka points to a sense of good faith at the
independence time in 1948 (Goodhand, 2012). The nation seemed to have the fundamental
elements for fast economic growth, ingredients that were not shared by many other Asian nations
—a vital area in the Indian Ocean, an open and vibrant economy with great export sector, high
literacy levels, a balanced equality and lack of extreme poverty, a moderately very much
developed physical framework, and an expansive based and proficient managerial apparatus
(Perry, 2012). The nation seemed to have a stable and settled political framework, including a
solid, free legal executive and a functioning civil society. Sri Lanka had experienced a fairly
smooth progress to parliamentary majority rule government through a well ordered change from
a colonial framework through a progression of established changes since the turn of the century
(Sarvananthan, 2016). Subsequently the signs were that the nation was very much set to expand
on its exceedingly great introductory conditions while keeping up ethnic amicability and
sociopolitical security (Pursell, 2011). Together these underlying conditions had given the setting
for the great optimism and expectation that, of all post-colonial countries, Sri Lanka come out to
3
Document Page
be the best in Asia. By universal benchmarks, Sri Lanka's economic growth has been generally
solid (Osmani, 2014).
Methodology
For this study, a descriptive analysis approach was employed where the basic features of the data
in the study are described. The report provides simple summaries regarding the sample and the
measures utilized. Together with simple graphics analysis (time series plot as well as the
boxplots and histogram), the study provides a basis of analyzing the quantitative data used in the
study.
Findings
Time series plot
Figure 1 below presents the time series plot for the Sri Lanka’s GDP growth rate from 1962 to
2017. As can be seen, there has never been a constant growth in the GDP for Sri Lanka. Notable
depressions are observed in the early 1972 and 2001. During these two periods, the growth rates
in the GDP were negative. There was also some drop in the GDP growth in 2008 when there was
a serious global financial crisis and this might have affected Sri Lanka as well.
4
tabler-icon-diamond-filled.svg

Paraphrase This Document

Need a fresh take? Get an instant paraphrase of this document with our AI Paraphraser
Document Page
Figure 1: Time series plot of Sri Lanka's GDP growth (annual %)
Summary (descriptive) analysis
Table 1 below presents the descriptive analysis for the Sri Lanka’s GDP growth rate. The mean
(arithmetic mean) of the GDP growth rate was found to be 4.8355%. This figure shows what the
GDP growth rate for Sri Lanka has been on average over the past 56 years (from 1962 to 2017).
The geometric mean was not able to be computed since there were negative values in the GDP
growth rate for the years 1972 and 2001. The weighted mean was found to be equal to the
arithmetic mean since equal weights were given for the different years. No year had a weight
greater than the other. The median value was 5.0035 (a value slightly higher than the mean),
which suggests that the data is skewed to the left. There was no mode in the data set since all the
values for the different years appeared only once throughout the period. The first and the third
quartiles for the GDP growth rate were found to be 3.8389 and 6.0316 respectively. These two
values give the 25th and the 75th percentiles of the data. The range (difference between the highest
and the lowest values) of the data was 10.69. This shows that the data is slightly widely
5
Document Page
distributed out. The variance and the standard deviation further shows that the data are slightly
spread out. The coefficient of variation of the data was found to be 41.52% which shows a
slightly greater level of dispersion around the mean. Lastly, the skewness value for the GDP
growth rate was found to be -0.6759 (a value less than -0.5), this shows a moderate negative
skew in the data. This further confirms that the data is left skewed.
Table 1: Summary (Descriptive) Statistics
GDP growth (annual %)
Mean (Arithmetic mean) 4.8355
Geometric mean #N/A
Weighted Mean 4.8355
Median 5.0035
Mode #N/A
Quartiles
1st quartile 3.8389
3rd quartile 6.0316
Minimum -1.54541
Maximum 9.144572
Range 10.6900
Interquartile range 2.1927
Variance 4.0303
Standard Deviation 2.0076
Coefficient of variance 0.4152
Skewness -0.6759
Kurtosis 1.393913
Count 56
Histogram
Figure 2 below presents the histogram of the GDP growth rate. As can be seen, the data seems
not follow a normal distribution but rather skewed to the left.
6
Document Page
Figure 2: Histogram of the GDP growth rate
Box plot
The boxplot presented in figure 3 below shows that the data has outliers. The outliers are to the
bottom of the plot suggesting the reason for left skewness. The two years 1972 and 2001 are the
two years when the country recorded negative GDP growth rate and these two years are possibly
outliers as can be seen from the plot.
Figure 3: Box plot of the GDP growth rate
7
tabler-icon-diamond-filled.svg

Paraphrase This Document

Need a fresh take? Get an instant paraphrase of this document with our AI Paraphraser
Document Page
Conclusion and Recommendation
Sri Lanka has experienced a robust annual growth over the past years (1962 to 2017). However,
it was also evident that some periods observed deep depressions in the GDP growth rate. One
possible reasons for the great drops in the GDP growth rates could be attributed to political
instability experienced during such times. It is therefore recommended that for a robust annual
GDP growth rate to be maintained, a stable political atmosphere needs to exist and as such
political players in the country need to ensure that the country experiences a stable political
atmosphere to allows for the economic growth of the country. Industrialization is also a key
component to the economic growth that the political class needs to prioritize as a way of
enabling a stable and robust economic growth.
References
Goodhand, J., 2012. Sri Lanka in 2011: Consolidation and Militarization of the Post-War
Regime. Asian Survey, 52(1), p. 130–37.
Osmani, S., 2014. Is there a Conflict between Growth and Welfarism? The Significance of the
Sri Lanka Debate. Development and Change, 25(3), p. 387– 421.
Perry, P., 2012. Exploring the Influence of National Cultural Context on CSR Implementation.
Journal of Fashion Marketing and Management, 16(2), pp. 141-160.
Pursell, G., 2011. Para Tariffs and Sri Lanka’s New Protectionism. Economic and Political
Weekly, 76(25), p. 31–4.
Sarvananthan, M., 2016. Elusive Economic Peace Dividend in Sri Lanka: All that Glitter is not
Gold. Geojournal, 81(4), p. 571–96.
8
Document Page
9
chevron_up_icon
1 out of 9
circle_padding
hide_on_mobile
zoom_out_icon
[object Object]