Business Finance Report: SSHA Project Evaluation and Sensitivity
VerifiedAdded on 2021/06/14
|8
|1525
|41
Report
AI Summary
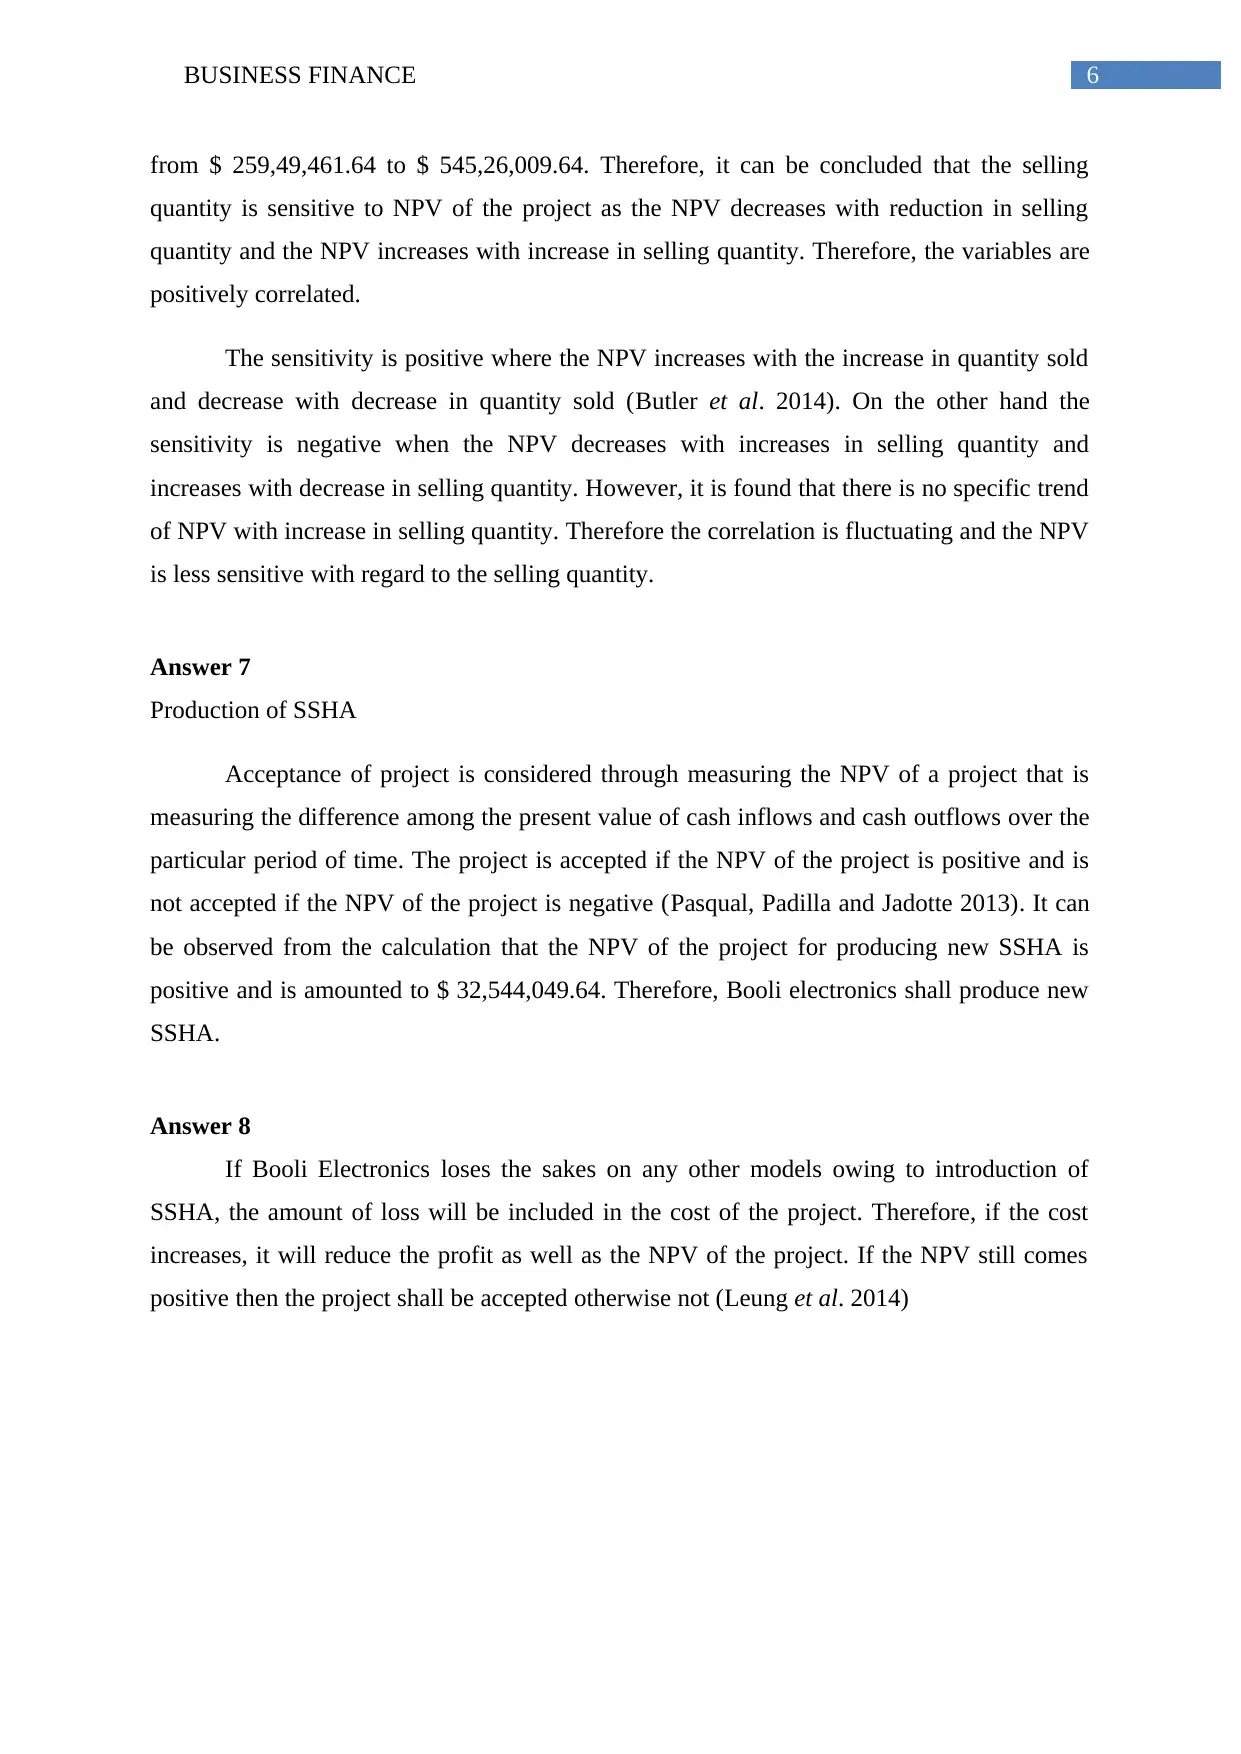
This report provides a comprehensive business finance analysis of a new SSHA project, evaluating its financial viability using various capital budgeting techniques. The analysis includes calculations of the non-discounted payback period, profitability index, IRR, and NPV. The report emphasizes the importance of NPV in project acceptance decisions. Furthermore, it delves into sensitivity analysis, exploring how changes in selling price and sales quantity impact the project's NPV. The analysis reveals the positive correlation between selling price and NPV, as well as sales quantity and NPV. The report concludes that based on the positive NPV, the project should be accepted, while also considering the potential impact of cannibalization on other models' sales. The report utilizes various sources to support the analysis.

Running head: BUSINESS FINANCE
Business finance
Name of the student
Name of the university
Student ID
Author note
Business finance
Name of the student
Name of the university
Student ID
Author note
Paraphrase This Document
Need a fresh take? Get an instant paraphrase of this document with our AI Paraphraser

1BUSINESS FINANCE
Table of Contents
Answer 1....................................................................................................................................2
Answer 2....................................................................................................................................2
Answer 3....................................................................................................................................2
Answer 4....................................................................................................................................2
Answer 5....................................................................................................................................2
Answer 6....................................................................................................................................4
Answer 7....................................................................................................................................6
Answer 8....................................................................................................................................6
Reference....................................................................................................................................7

2BUSINESS FINANCE
Answer 1
Non-discounted payback period
It is the capital budgeting method that does not consider the time value of money
explicitly. The non-discounted payback period not only ignores the time value of money, it
also ignores the cash receivable after the payback period (Gallo 2014). The non-discounted
payback period of the project for new SSHA is 2.21 years.
Answer 2
Profitability index of project
It is the index that recognizes the relationship among the benefits and costs of the
proposed project. The profitability index of the project for new SSHA is 1.72
Answer 3
IRR of the project
It is the interest rate at which the NPV of cash flows from the investment or project is
equal to zero. It is used for evaluating the investment or project’s attractiveness. The IRR of
the project for new SSHA is 20.75%
Answer 4
NPV or net present value of the project is the difference among the present value of
cash inflows and cash outflows over the particular period of time. It is used for capital
budgeting to analyze profitability of the project or projected investment. the NPV of the
project for new SSHA is $ 32,544,049.64 (McAuliffe 2015).
Answer 5
While evaluating the investment project generally the cash flows are forecasted and it
depends on expected costs and revenues. Expected revenue is the function of sales price per
unit and sales volume. In the same way the sales volume depends on the company’s market
share and market size. Cost includes the variable costs that is depended on the sales volume
and variable cost per unit the fixed cost (Iooss and Lemaître 2015). The NPV of the project is
⊘ This is a preview!⊘
Do you want full access?
Subscribe today to unlock all pages.

Trusted by 1+ million students worldwide

3BUSINESS FINANCE
determined through analysis of after tax cash flows calculated by combining the forecasts of
different variables. For determining the NPV of a project, the differences can be worked out
if any of the mentioned forecasts misstated. However, the forecasts can be changed over time
for 3 values at least – expected, pessimistic and optimistic. The project’s NPV are
recalculated as per different assumptions. The method of recalculation of NPV through
changing each of the forecasts is known as sensitivity analysis.
Sensitivity analysis with regard to changes in sales price or sales volume is the
method of analysing the changes in NPV for the given changes in sales price or sales volume.
If the sensitivity is more then the variable is more critical (Baucells and Borgonovo 2013).
Following 3 steps are taken into consideration while doing the sensitivity analysis –
Identification of all the variables that have influence on NPV of the project
Definition of underlying relationship among the variables
Analysing the impact of changes in each of the variables on the NPV of the project.
Sensitivity analysis with the changes in selling price
Selling Price NPV
$ 32,544,049.64
500 $ (11,480,321.15)
515 $ (7,910,777.57)
530 $ (4,341,233.99)
545 $ (771,690.42)
560 $ 2,797,853.16
575 $ 6,367,396.74
590 $ 9,936,940.31
605 $ 13,506,483.89
620 $ 17,076,027.47
635 $ 20,645,571.05
650 $ 24,215,114.62
665 $ 27,784,658.20
680 $ 31,354,201.78
695 $ 34,923,745.35
710 $ 38,493,288.93
725 $ 42,062,832.51
740 $ 45,632,376.08
755 $ 49,201,919.66
770 $ 52,771,463.24
785 $ 56,341,006.81
800 $ 59,910,550.39
815 $ 63,480,093.97
Paraphrase This Document
Need a fresh take? Get an instant paraphrase of this document with our AI Paraphraser

4BUSINESS FINANCE
830 $ 67,049,637.55
845 $ 70,619,181.12
860 $ 74,188,724.70
875 $ 77,758,268.28
890 $ 81,327,811.85
905 $ 84,897,355.43
$(20,000,000.00)
$-
$20,000,000.00
$40,000,000.00
$60,000,000.00
$80,000,000.00
$100,000,000.00
Selling price
N
P
V
It can be identified from the above tables that the under optimistic approach the NPV
is $ 48,012,071.80, under expected approach the NPV is 32,544,049.64 and under the
pessimistic approach the NPV is $ 12,316,636.03. Therefore, it can be concluded that the
selling price is sensitive to NPV of the project as the NPV decreases with reduction in selling
price and the NPV increases with increase in selling price. Therefore, the variables are
positively correlated.
Answer 6
Sensitivity analysis for NPV with the changes in quantity sold
Sensitivity analysis with changes in the quantity sold is carried out to show how the
amount of NPV is changing with the changes in quantity sold. Generally the adverse changes
in the NPV are taken into consideration (Tańczuk and Ulbrich 2013). It is carried out to –

5BUSINESS FINANCE
Identify key variables that have an impact on the benefit and cost streams of the
project
Investigating the consequences of expected adverse alterations in the key variables
Assessing the project decisions that is expected by the changes
Identifying the actions that can eliminate the expected adverse impacts on project.
Sales volume Amount
$ 325,44,049.64
25000 $ 259,49,461.64
45000 $ 281,47,657.64
65000 $ 303,45,853.64
85000 $ 325,44,049.64
105000 $ 347,42,245.64
125000 $ 369,40,441.64
145000 $ 391,38,637.64
165000 $ 413,36,833.64
185000 $ 435,35,029.64
205000 $ 457,33,225.64
225000 $ 479,31,421.64
245000 $ 501,29,617.64
265000 $ 523,27,813.64
285000 $ 545,26,009.64
0 50000 100000 150000 200000 250000 300000
$-
$10,000,000.00
$20,000,000.00
$30,000,000.00
$40,000,000.00
$50,000,000.00
$60,000,000.00
Sales volume
N
P
V
It can be identified from the table that the NPV increases with the increases in sales
quantity and for the sales volume ranged from 25000 unit to 285000 unit the NPV ranged
⊘ This is a preview!⊘
Do you want full access?
Subscribe today to unlock all pages.

Trusted by 1+ million students worldwide

6BUSINESS FINANCE
from $ 259,49,461.64 to $ 545,26,009.64. Therefore, it can be concluded that the selling
quantity is sensitive to NPV of the project as the NPV decreases with reduction in selling
quantity and the NPV increases with increase in selling quantity. Therefore, the variables are
positively correlated.
The sensitivity is positive where the NPV increases with the increase in quantity sold
and decrease with decrease in quantity sold (Butler et al. 2014). On the other hand the
sensitivity is negative when the NPV decreases with increases in selling quantity and
increases with decrease in selling quantity. However, it is found that there is no specific trend
of NPV with increase in selling quantity. Therefore the correlation is fluctuating and the NPV
is less sensitive with regard to the selling quantity.
Answer 7
Production of SSHA
Acceptance of project is considered through measuring the NPV of a project that is
measuring the difference among the present value of cash inflows and cash outflows over the
particular period of time. The project is accepted if the NPV of the project is positive and is
not accepted if the NPV of the project is negative (Pasqual, Padilla and Jadotte 2013). It can
be observed from the calculation that the NPV of the project for producing new SSHA is
positive and is amounted to $ 32,544,049.64. Therefore, Booli electronics shall produce new
SSHA.
Answer 8
If Booli Electronics loses the sakes on any other models owing to introduction of
SSHA, the amount of loss will be included in the cost of the project. Therefore, if the cost
increases, it will reduce the profit as well as the NPV of the project. If the NPV still comes
positive then the project shall be accepted otherwise not (Leung et al. 2014)
Paraphrase This Document
Need a fresh take? Get an instant paraphrase of this document with our AI Paraphraser

7BUSINESS FINANCE
Reference
Baucells, M. and Borgonovo, E., 2013. Invariant probabilistic sensitivity
analysis. Management Science, 59(11), pp.2536-2549.
Butler, M.P., Reed, P.M., Fisher-Vanden, K., Keller, K. and Wagener, T., 2014. Identifying
parametric controls and dependencies in integrated assessment models using global
sensitivity analysis. Environmental modelling & software, 59, pp.10-29.
Gallo, A., 2014. A refresher on net present value. Harvard Business Review, 19.
Iooss, B. and Lemaître, P., 2015. A review on global sensitivity analysis methods.
In Uncertainty management in simulation-optimization of complex systems (pp. 101-122).
Springer, Boston, MA.
Leung, B., Springborn, M.R., Turner, J.A. and Brockerhoff, E.G., 2014. Pathway‐level risk
analysis: the net present value of an invasive species policy in the US. Frontiers in Ecology
and the Environment, 12(5), pp.273-279.
McAuliffe, R.E., 2015. Net Present Value. Wiley Encyclopedia of Management, pp.1-1.
Pasqual, J., Padilla, E. and Jadotte, E., 2013. Equivalence of different profitability criteria
with the net present value. International Journal of Production Economics, 142(1), pp.205-
210.
Tańczuk, M. and Ulbrich, R., 2013. Implementation of a biomass-fired co-generation plant
supplied with an ORC (Organic Rankine Cycle) as a heat source for small scale heat
distribution system–A comparative analysis under Polish and German conditions. Energy, 62,
pp.132-141.
1 out of 8
Related Documents

Your All-in-One AI-Powered Toolkit for Academic Success.
+13062052269
info@desklib.com
Available 24*7 on WhatsApp / Email
Unlock your academic potential
Copyright © 2020–2025 A2Z Services. All Rights Reserved. Developed and managed by ZUCOL.