STA101: Statistics for Business - Confidence Intervals and Hypothesis

Verified

Added on  2021/06/14

|6
|1040
|78
Homework Assignment
AI Summary
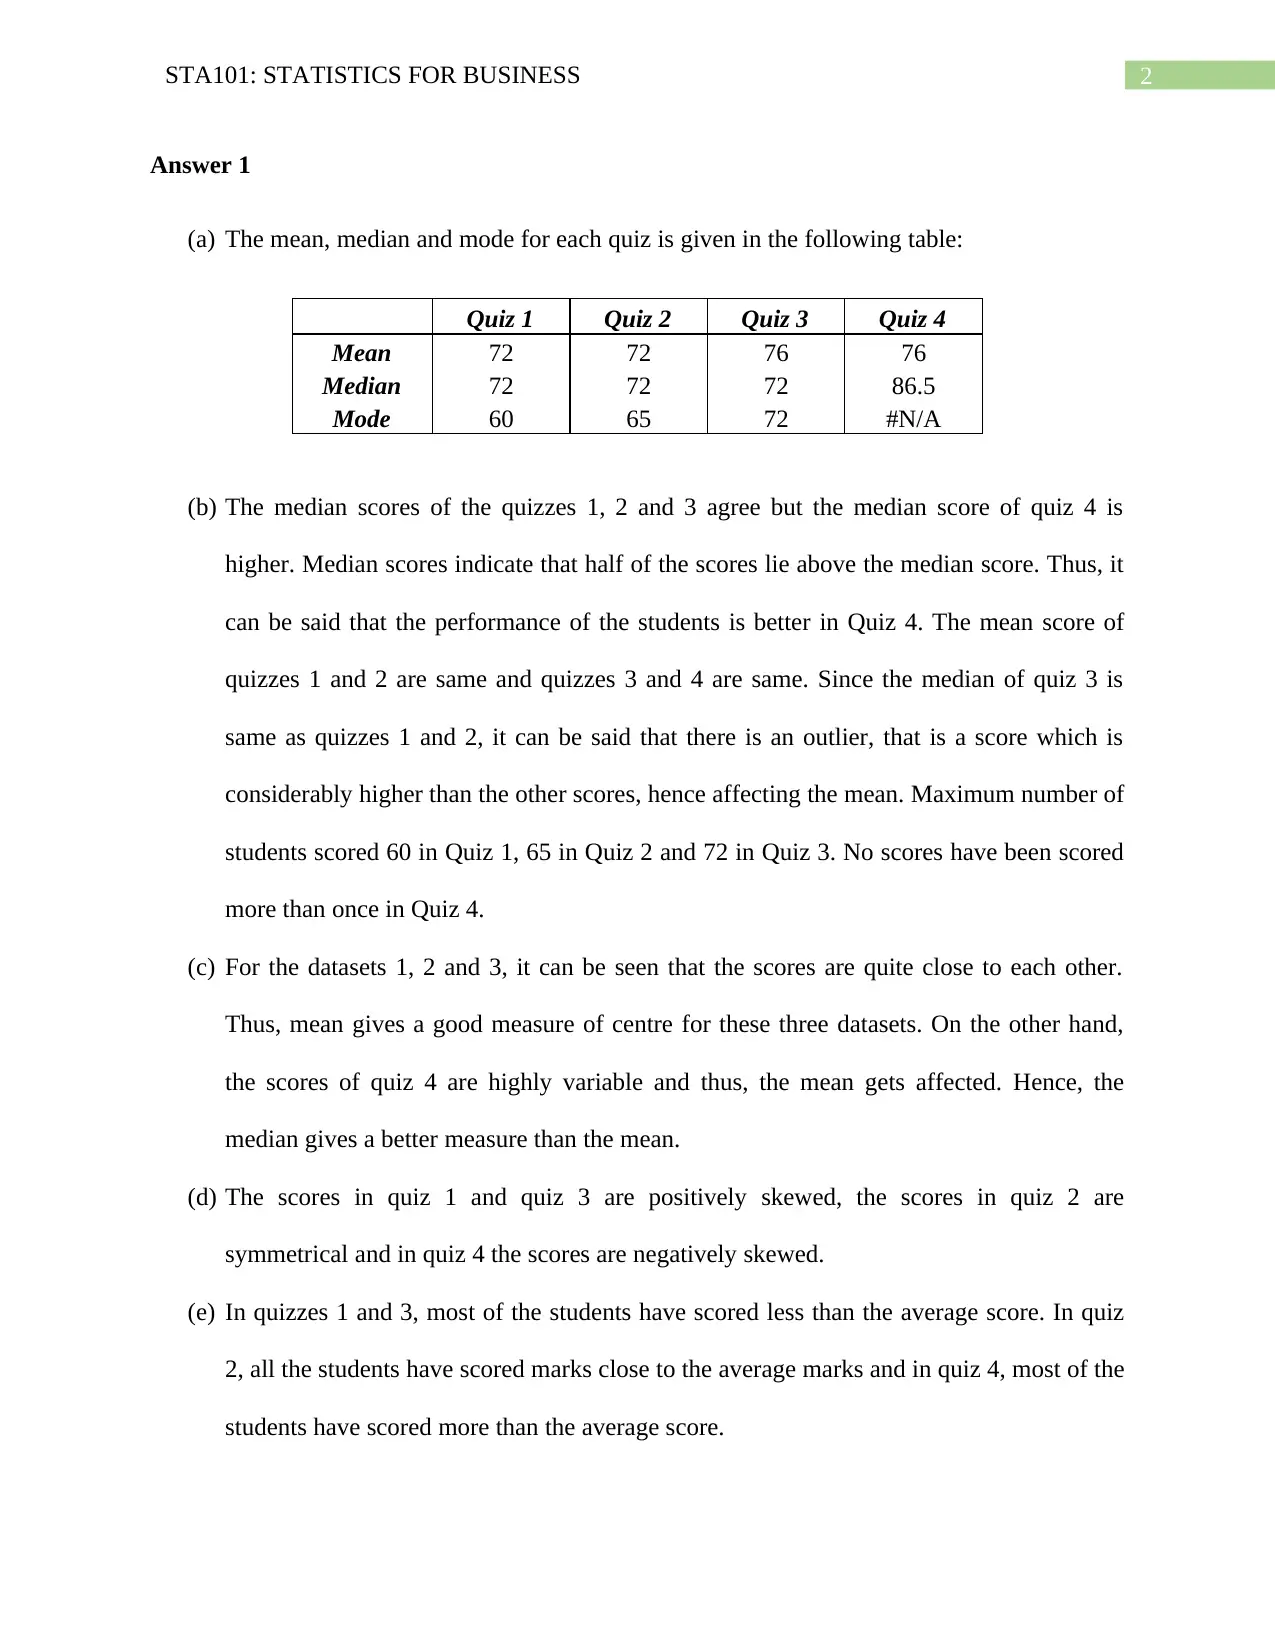
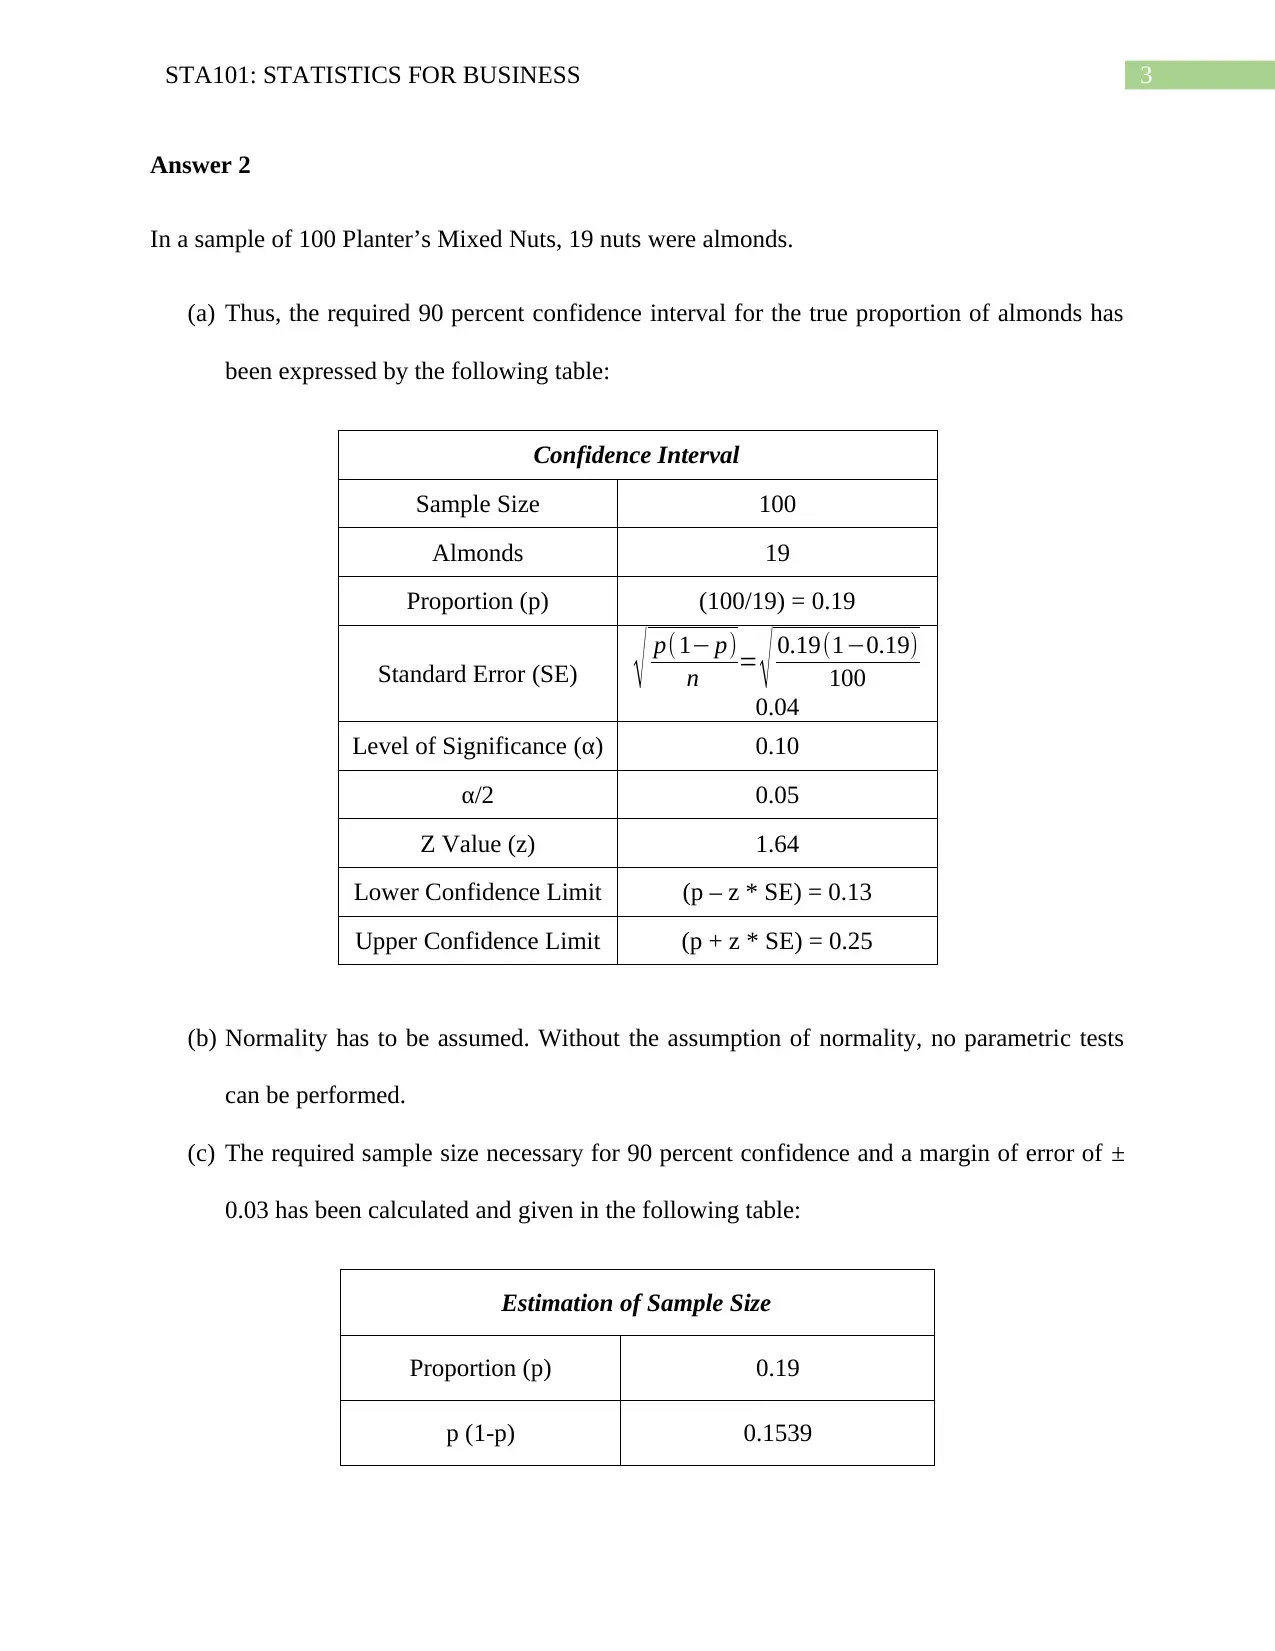
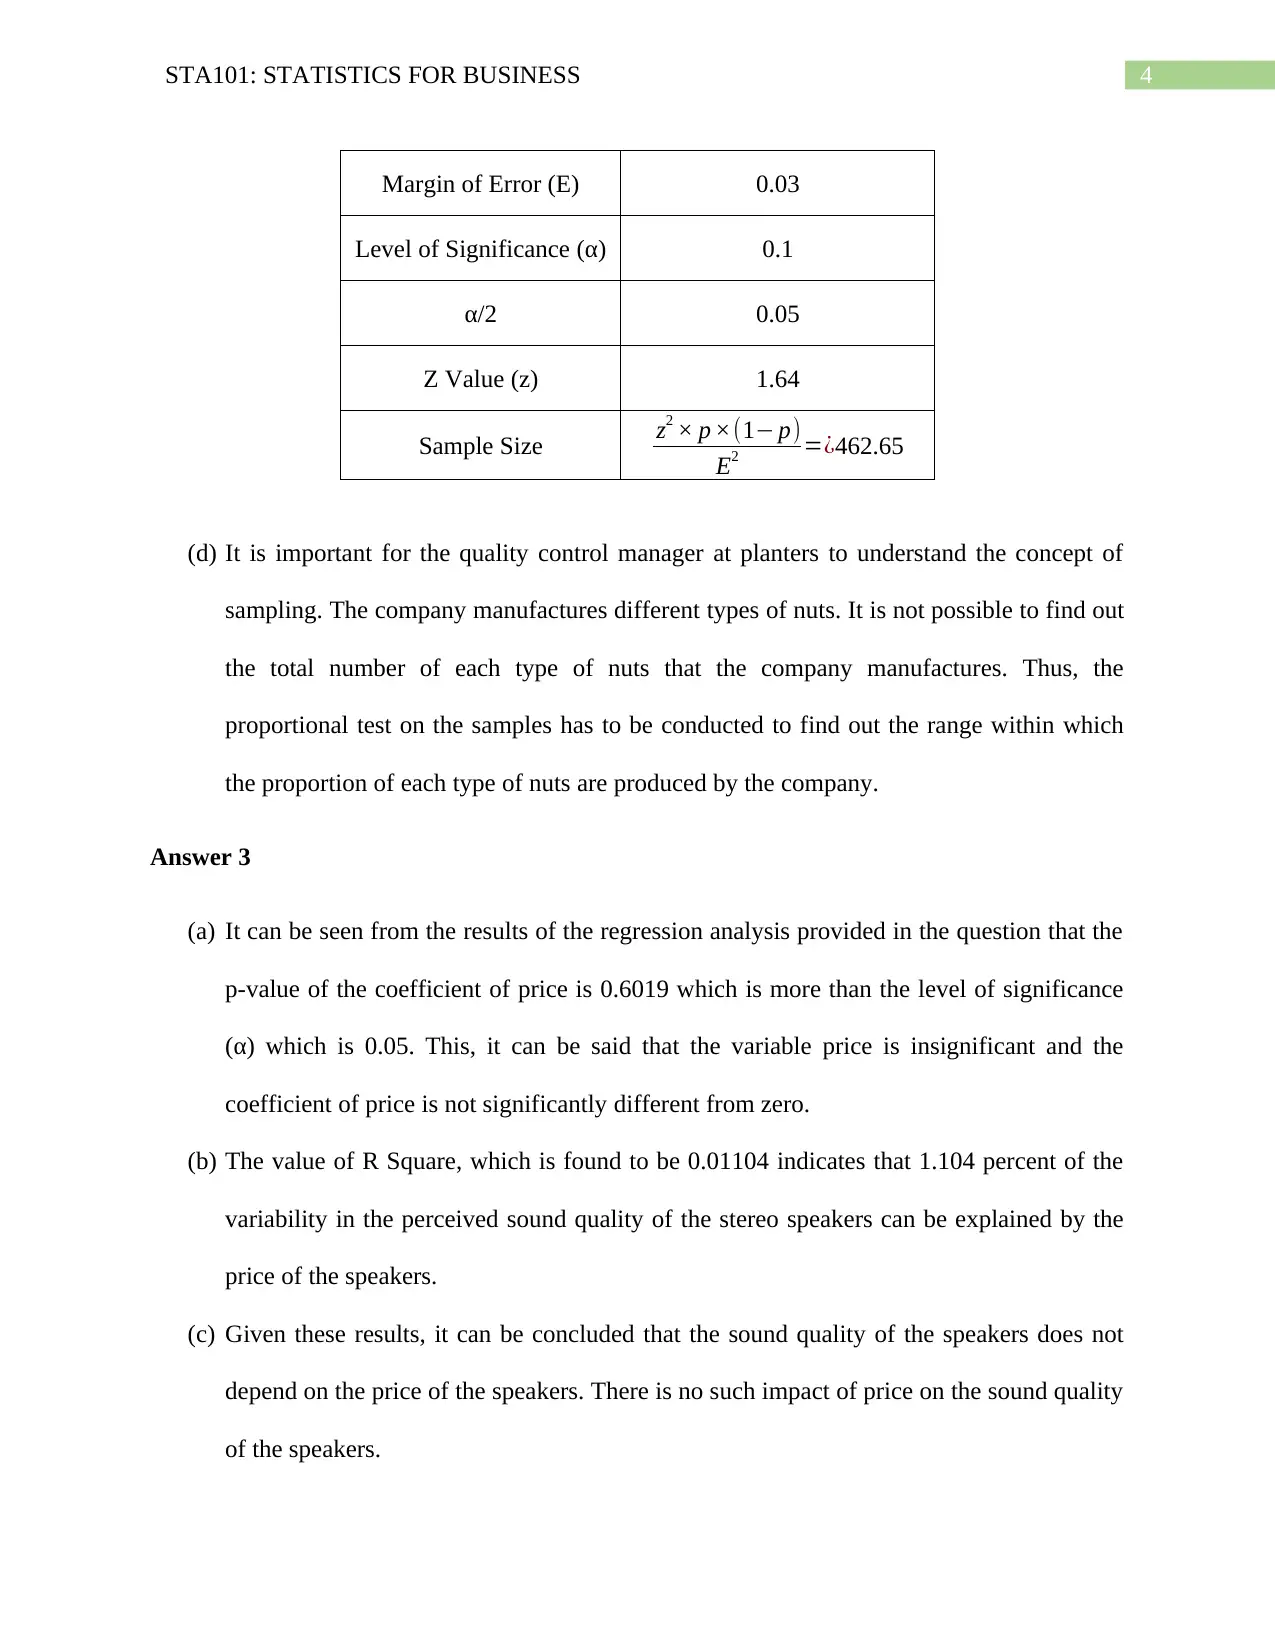
This document presents a comprehensive solution to a STA101 Statistics for Business assignment. The solution includes detailed analysis of quiz results, calculating mean, median, and mode for multiple quizzes, and interpreting the skewness of the data. It then proceeds to calculate a 90% confidence interval for the proportion of almonds in a sample of mixed nuts, including sample size calculations and the importance of sampling for quality control. Furthermore, the assignment addresses regression analysis, interpreting the p-value and R-squared to determine the relationship between price and perceived sound quality of stereo speakers. Finally, the document provides a discussion of hypothesis testing, defining Type I and Type II errors in the context of package delivery times, and analyzing the implications of each error type from both the company and consumer perspectives.
Document Page
Running Head: STA101: STATISTICS FOR BUSINESS
STA101
Statistics for Business
Name of the Student
Name of the University
Author Note
tabler-icon-diamond-filled.svg

Secure Best Marks with AI Grader

Need help grading? Try our AI Grader for instant feedback on your assignments.
Document Page
1STA101: STATISTICS FOR BUSINESS
Table of Contents
Answer 1..........................................................................................................................................2
Answer 2..........................................................................................................................................3
Answer 3..........................................................................................................................................4
Answer 4..........................................................................................................................................5
Document Page
2STA101: STATISTICS FOR BUSINESS
Answer 1
(a) The mean, median and mode for each quiz is given in the following table:
Quiz 1 Quiz 2 Quiz 3 Quiz 4
Mean 72 72 76 76
Median 72 72 72 86.5
Mode 60 65 72 #N/A
(b) The median scores of the quizzes 1, 2 and 3 agree but the median score of quiz 4 is
higher. Median scores indicate that half of the scores lie above the median score. Thus, it
can be said that the performance of the students is better in Quiz 4. The mean score of
quizzes 1 and 2 are same and quizzes 3 and 4 are same. Since the median of quiz 3 is
same as quizzes 1 and 2, it can be said that there is an outlier, that is a score which is
considerably higher than the other scores, hence affecting the mean. Maximum number of
students scored 60 in Quiz 1, 65 in Quiz 2 and 72 in Quiz 3. No scores have been scored
more than once in Quiz 4.
(c) For the datasets 1, 2 and 3, it can be seen that the scores are quite close to each other.
Thus, mean gives a good measure of centre for these three datasets. On the other hand,
the scores of quiz 4 are highly variable and thus, the mean gets affected. Hence, the
median gives a better measure than the mean.
(d) The scores in quiz 1 and quiz 3 are positively skewed, the scores in quiz 2 are
symmetrical and in quiz 4 the scores are negatively skewed.
(e) In quizzes 1 and 3, most of the students have scored less than the average score. In quiz
2, all the students have scored marks close to the average marks and in quiz 4, most of the
students have scored more than the average score.
Document Page
3STA101: STATISTICS FOR BUSINESS
Answer 2
In a sample of 100 Planter’s Mixed Nuts, 19 nuts were almonds.
(a) Thus, the required 90 percent confidence interval for the true proportion of almonds has
been expressed by the following table:
Confidence Interval
Sample Size 100
Almonds 19
Proportion (p) (100/19) = 0.19
Standard Error (SE) p(1 p)
n = 0.19(10.19)
100
0.04
Level of Significance (α) 0.10
α/2 0.05
Z Value (z) 1.64
Lower Confidence Limit (p – z * SE) = 0.13
Upper Confidence Limit (p + z * SE) = 0.25
(b) Normality has to be assumed. Without the assumption of normality, no parametric tests
can be performed.
(c) The required sample size necessary for 90 percent confidence and a margin of error of ±
0.03 has been calculated and given in the following table:
Estimation of Sample Size
Proportion (p) 0.19
p (1-p) 0.1539
tabler-icon-diamond-filled.svg

Secure Best Marks with AI Grader

Need help grading? Try our AI Grader for instant feedback on your assignments.
Document Page
4STA101: STATISTICS FOR BUSINESS
Margin of Error (E) 0.03
Level of Significance (α) 0.1
α/2 0.05
Z Value (z) 1.64
Sample Size z2 × p ×(1 p)
E2 =¿462.65
(d) It is important for the quality control manager at planters to understand the concept of
sampling. The company manufactures different types of nuts. It is not possible to find out
the total number of each type of nuts that the company manufactures. Thus, the
proportional test on the samples has to be conducted to find out the range within which
the proportion of each type of nuts are produced by the company.
Answer 3
(a) It can be seen from the results of the regression analysis provided in the question that the
p-value of the coefficient of price is 0.6019 which is more than the level of significance
(α) which is 0.05. This, it can be said that the variable price is insignificant and the
coefficient of price is not significantly different from zero.
(b) The value of R Square, which is found to be 0.01104 indicates that 1.104 percent of the
variability in the perceived sound quality of the stereo speakers can be explained by the
price of the speakers.
(c) Given these results, it can be concluded that the sound quality of the speakers does not
depend on the price of the speakers. There is no such impact of price on the sound quality
of the speakers.
Document Page
5STA101: STATISTICS FOR BUSINESS
Answer 4
(a) Null Hypothesis: The delivery time of the package is less than or equal to two days on
an average.
Alternative Hypothesis: The delivery time of the package more than two days on an
average.
(b) If it is concluded wrongly that the claim of the company that the average delivery
time is within two days, then the true null hypothesis will be rejected. This is Type I
error. With this type of error, the company will be wrongly accused about the delivery
service and the orders received by the company might decrease due to the longer delivery
time as found from the test.
(c) Now, the true fact was that the delivery time is longer than two days and by
testing, it has been concluded that the delivery time is within 2 days. This type of error is
termed as Type II error as the false null hypothesis is accepted. For the company this will
be good fact as their delivery time will be termed as less when that is not actually the
case. This will be beneficial for the company.
(d) Thus, from the company’s standpoint, Type I error is worse as that error will be affecting
the business of the company.
(e) From the standpoint of the consumer, Type II error will be worse as this will be affecting
the service received by the consumers.
chevron_up_icon
1 out of 6
circle_padding
hide_on_mobile
zoom_out_icon
[object Object]