STA101 Statistics for Business: Detailed Quiz Analysis and Testing

Verified

Added on  2023/06/11

|2
|734
|311
Homework Assignment
AI Summary
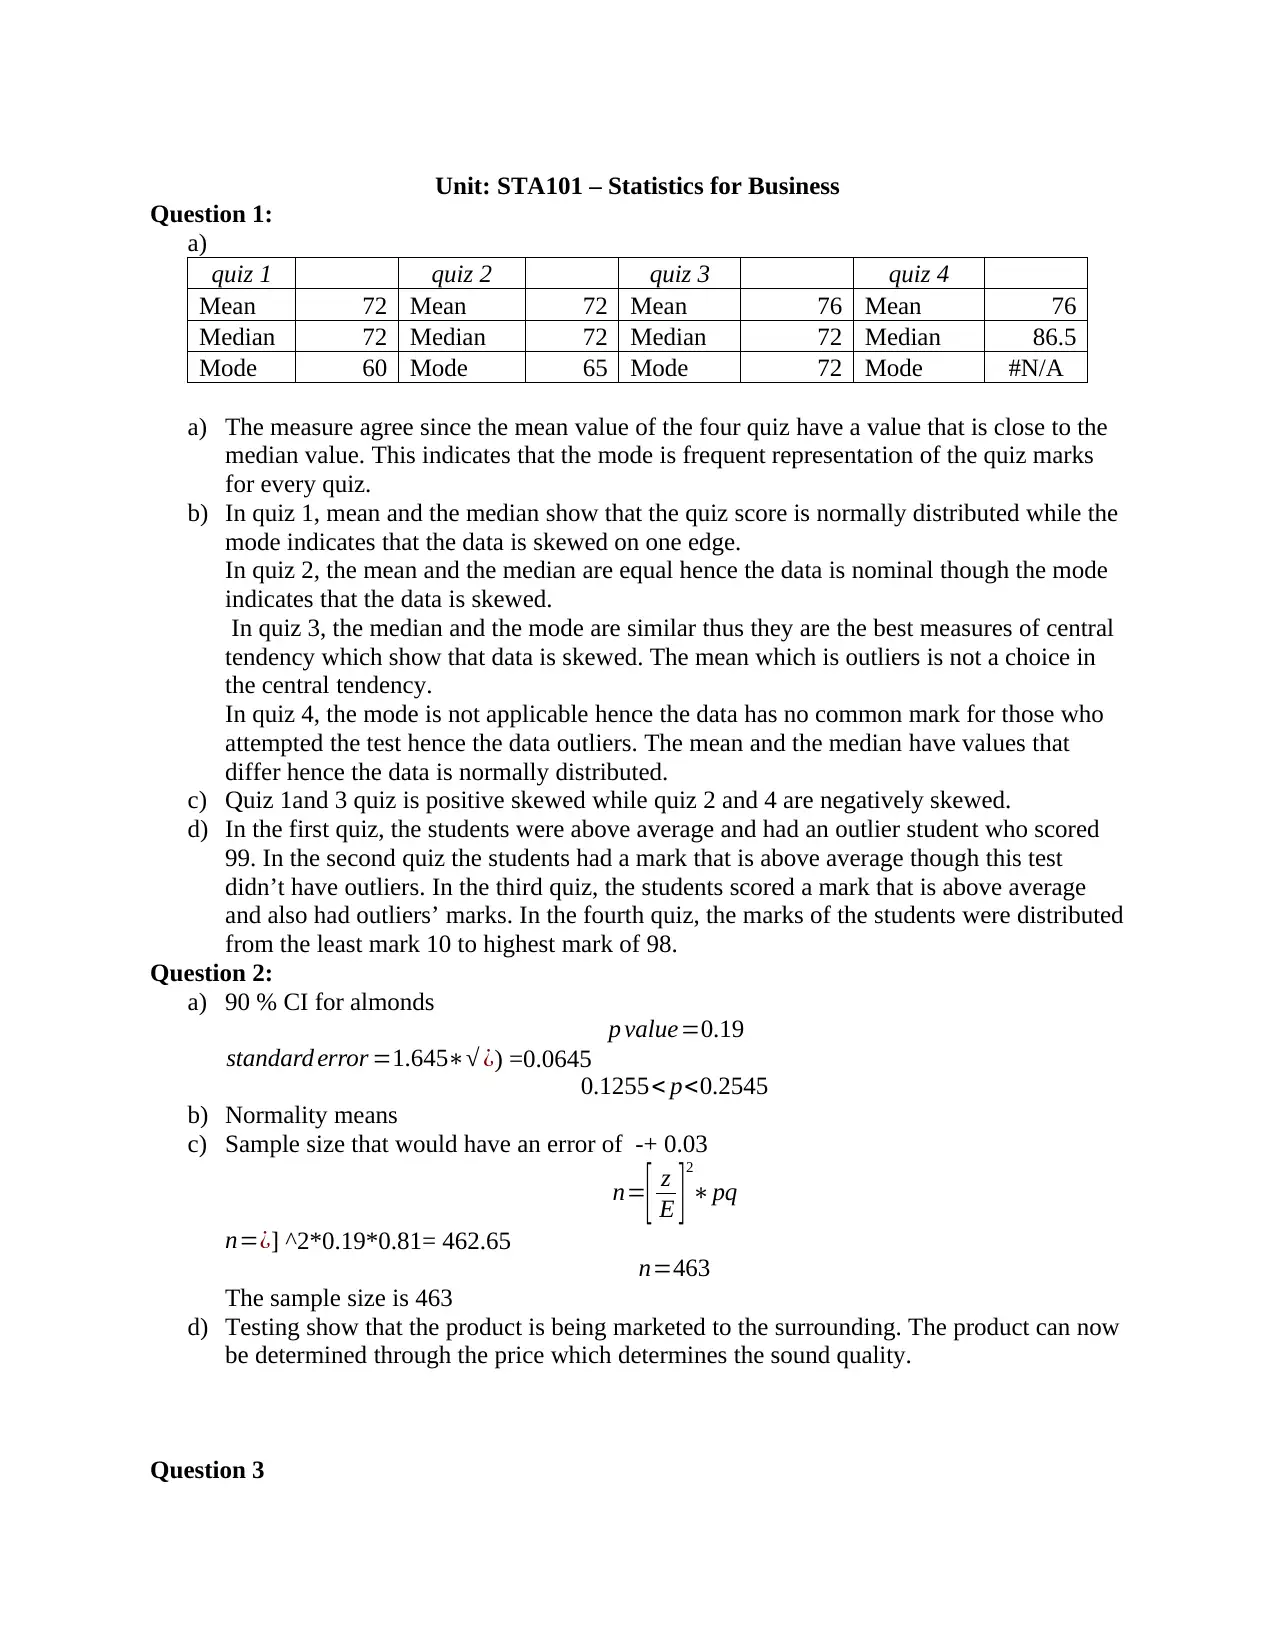
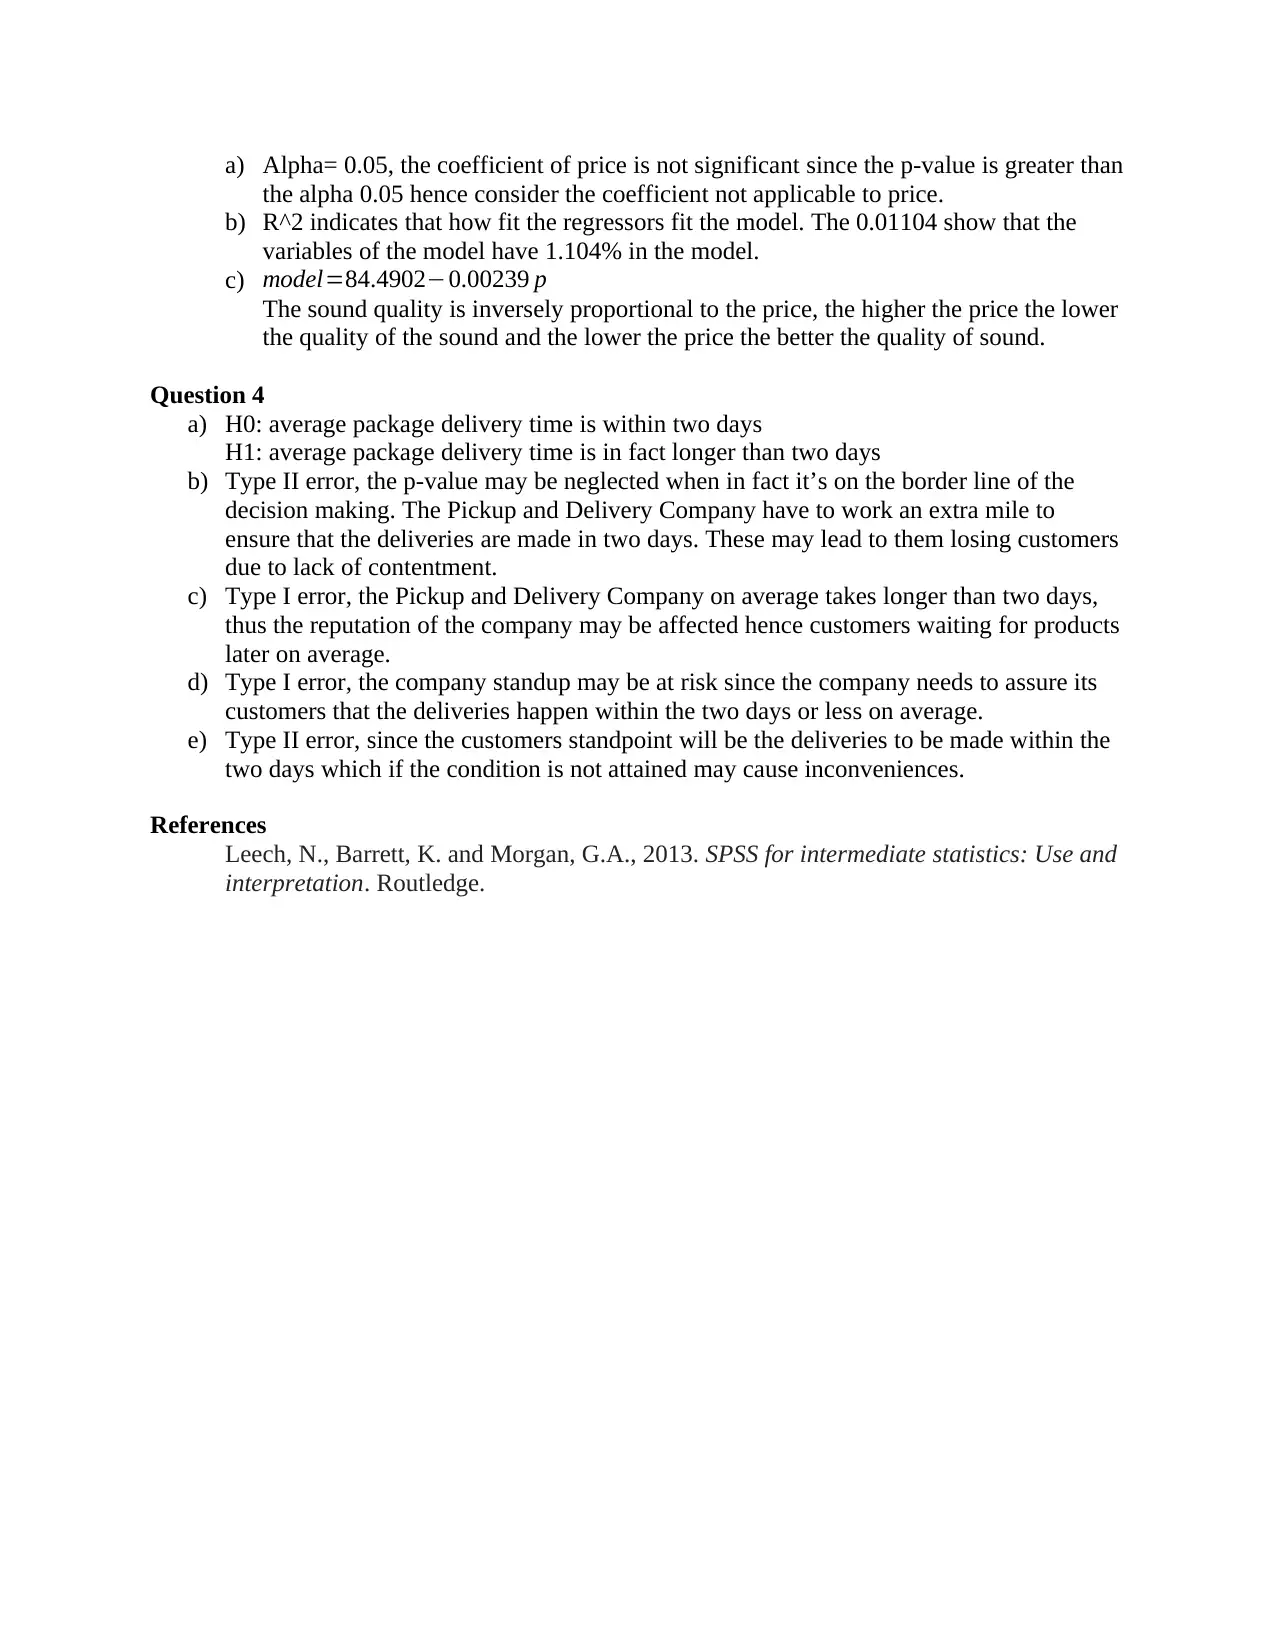
This assignment solution for STA101 Statistics for Business covers a range of statistical concepts through the analysis of quiz data and hypothesis testing. The solution includes calculating the mean, median, and mode for four different quizzes, discussing the agreement and strengths/weaknesses of these measures of central tendency, and determining the skewness of the data. Additionally, the assignment involves constructing a confidence interval for a proportion, determining the required sample size for a given margin of error, and interpreting the significance of a coefficient in a regression model. Hypothesis testing is addressed by formulating null and alternative hypotheses, as well as identifying Type I and Type II errors in the context of package delivery times. The document provides detailed calculations and explanations for each question, offering a comprehensive understanding of the statistical methods applied. Desklib provides a platform for students to access this solution and explore a wealth of other academic resources.
Document Page
Unit: STA101 – Statistics for Business
Question 1:
a)
quiz 1 quiz 2 quiz 3 quiz 4
Mean 72 Mean 72 Mean 76 Mean 76
Median 72 Median 72 Median 72 Median 86.5
Mode 60 Mode 65 Mode 72 Mode #N/A
a) The measure agree since the mean value of the four quiz have a value that is close to the
median value. This indicates that the mode is frequent representation of the quiz marks
for every quiz.
b) In quiz 1, mean and the median show that the quiz score is normally distributed while the
mode indicates that the data is skewed on one edge.
In quiz 2, the mean and the median are equal hence the data is nominal though the mode
indicates that the data is skewed.
In quiz 3, the median and the mode are similar thus they are the best measures of central
tendency which show that data is skewed. The mean which is outliers is not a choice in
the central tendency.
In quiz 4, the mode is not applicable hence the data has no common mark for those who
attempted the test hence the data outliers. The mean and the median have values that
differ hence the data is normally distributed.
c) Quiz 1and 3 quiz is positive skewed while quiz 2 and 4 are negatively skewed.
d) In the first quiz, the students were above average and had an outlier student who scored
99. In the second quiz the students had a mark that is above average though this test
didn’t have outliers. In the third quiz, the students scored a mark that is above average
and also had outliers’ marks. In the fourth quiz, the marks of the students were distributed
from the least mark 10 to highest mark of 98.
Question 2:
a) 90 % CI for almonds
p value=0.19
standard error =1.645 ¿) =0.0645
0.1255< p<0.2545
b) Normality means
c) Sample size that would have an error of -+ 0.03
n=
[ z
E ]2
pq
n=¿] ^2*0.19*0.81= 462.65
n=463
The sample size is 463
d) Testing show that the product is being marketed to the surrounding. The product can now
be determined through the price which determines the sound quality.
Question 3
tabler-icon-diamond-filled.svg

Secure Best Marks with AI Grader

Need help grading? Try our AI Grader for instant feedback on your assignments.
Document Page
a) Alpha= 0.05, the coefficient of price is not significant since the p-value is greater than
the alpha 0.05 hence consider the coefficient not applicable to price.
b) R^2 indicates that how fit the regressors fit the model. The 0.01104 show that the
variables of the model have 1.104% in the model.
c) model=84.49020.00239 p
The sound quality is inversely proportional to the price, the higher the price the lower
the quality of the sound and the lower the price the better the quality of sound.
Question 4
a) H0: average package delivery time is within two days
H1: average package delivery time is in fact longer than two days
b) Type II error, the p-value may be neglected when in fact it’s on the border line of the
decision making. The Pickup and Delivery Company have to work an extra mile to
ensure that the deliveries are made in two days. These may lead to them losing customers
due to lack of contentment.
c) Type I error, the Pickup and Delivery Company on average takes longer than two days,
thus the reputation of the company may be affected hence customers waiting for products
later on average.
d) Type I error, the company standup may be at risk since the company needs to assure its
customers that the deliveries happen within the two days or less on average.
e) Type II error, since the customers standpoint will be the deliveries to be made within the
two days which if the condition is not attained may cause inconveniences.
References
Leech, N., Barrett, K. and Morgan, G.A., 2013. SPSS for intermediate statistics: Use and
interpretation. Routledge.
chevron_up_icon
1 out of 2
circle_padding
hide_on_mobile
zoom_out_icon
[object Object]