STA101 Statistics for Business - Detailed Assignment Solution

Verified

Added on  2023/06/03

|7
|700
|252
Homework Assignment
AI Summary
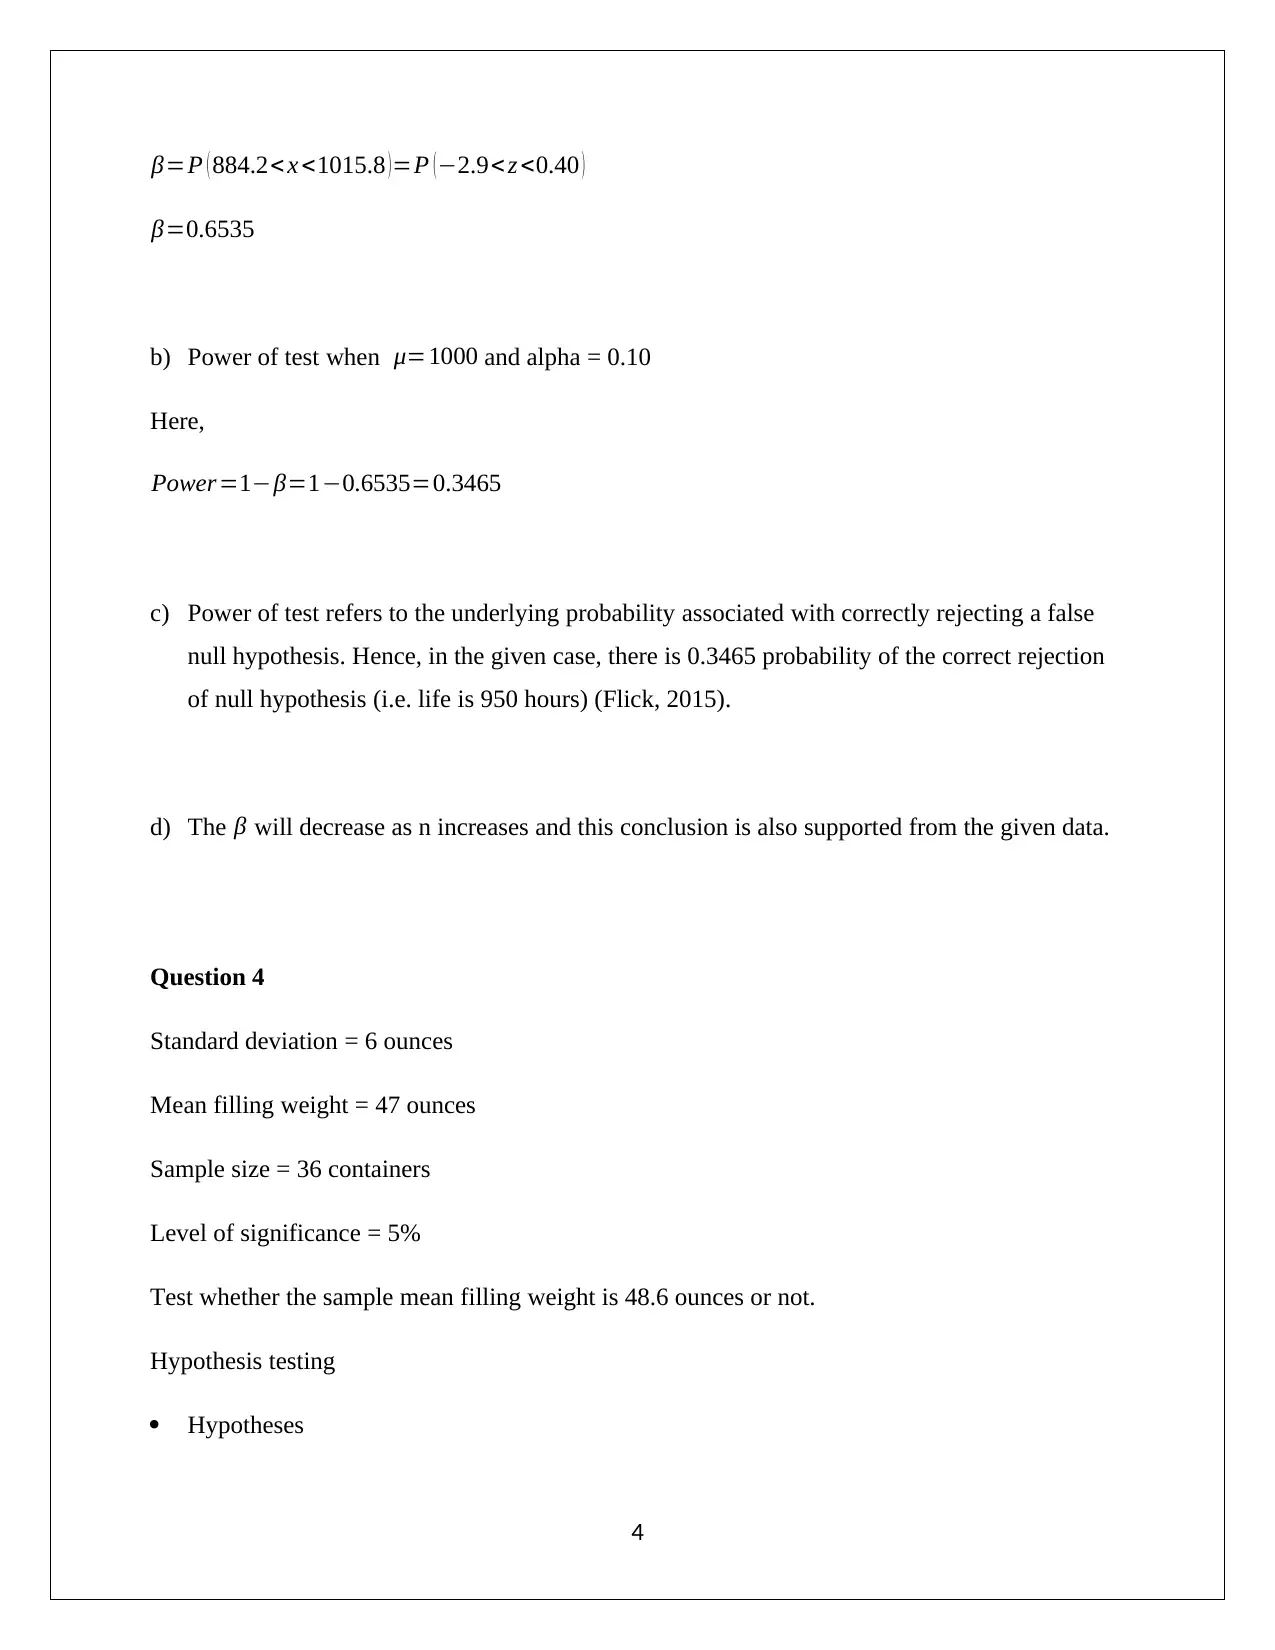
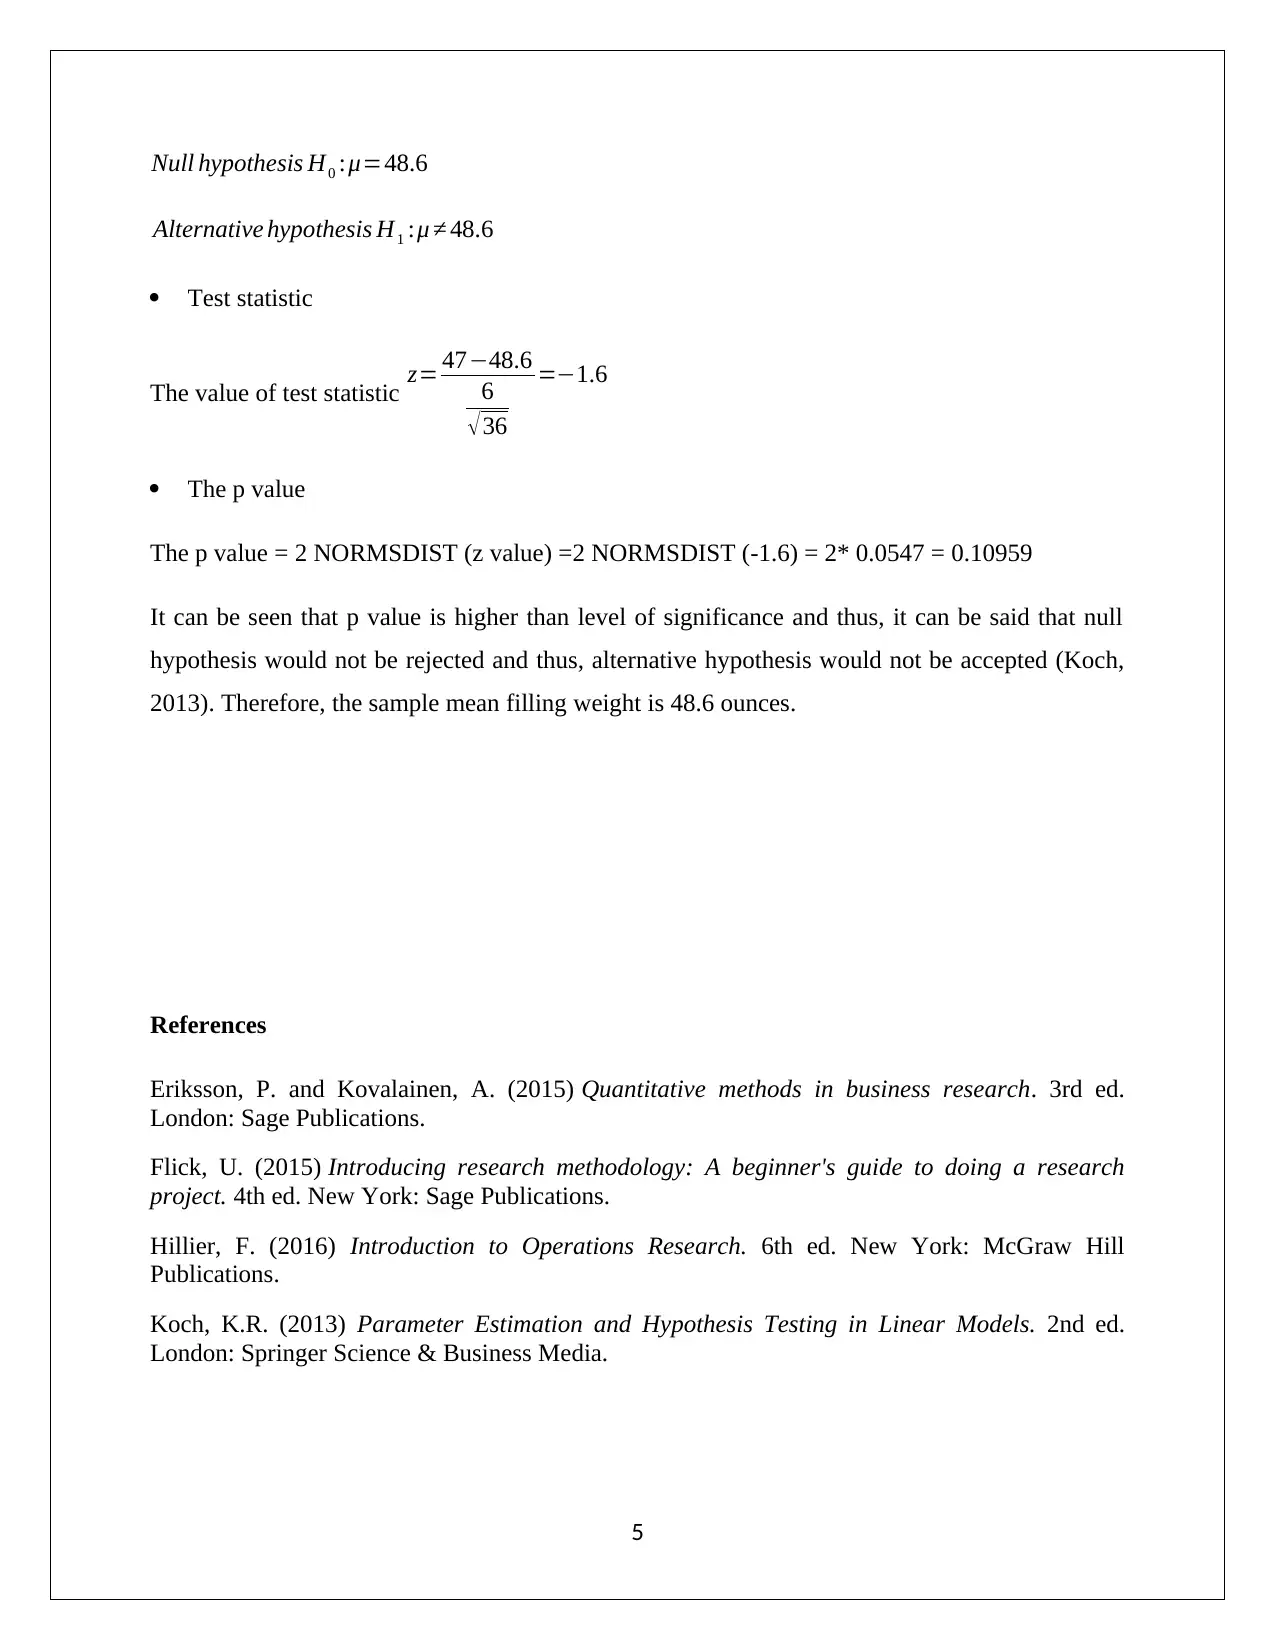
This document presents a solved assignment for a Statistics for Business course (STA101). It includes detailed solutions to four questions covering key statistical concepts. Question 1 involves calculating and interpreting covariance and correlation coefficient between years of experience and salary data, explaining the negative relationship observed. Question 2 focuses on exponential distribution, calculating probabilities related to customer waiting times. Question 3 deals with hypothesis testing, including calculating Type II error probability and power of the test. Question 4 involves hypothesis testing to determine if the sample mean filling weight of containers is a specific value. The assignment uses statistical formulas and interpretations to arrive at the solutions, referencing relevant academic sources.
Document Page
Statistics for Business
Assignment
STUDENT NAME/ID
[Pick the date]
tabler-icon-diamond-filled.svg

Paraphrase This Document

Need a fresh take? Get an instant paraphrase of this document with our AI Paraphraser
Document Page
Question 1
Variable description
X = Years of experiences
Y = Salary ($’000)
(a) Covariance
X bar = 44/8 = 5.5
Y bar = 148/8 = 18.5
Covariance= 1
n1 ¿ ¿
1
Document Page
(b) The covariance is negative primarily because the sample observations may belong to a
profession where the salaries are inversely proportional to the age.
(c) Calculation of correlation coefficient
Correlation coefficient= ¿ ¿ ¿
Interpretation: The value of correlation coefficient implies that a perfect negative correlation is
present between the variables. The strength of association is very strong which indicates that as
the year of experiences (x) is increased then the salary (y) would be decreased (Eriksson and
Kovalainen, 2015).
The relationship can also be seen from the scatter plot shown below.
1 2 3 4 5 6 7 8 9 10
0
5
10
15
20
25
30
Scatter Plot
Year of experience
Salary ($'000)
2
Document Page
(d) The reason behind the negative relationship is due to the fact that as the experience in years
tends to rise, there is a drop in the salary levels (Hillier, 2016).
Question 2
a) Value of ƛ
Here, =3
ƛ= 1
3
b) Proportion of customers that hold more than 1.5 min will hang up before placing an order
P ( x>1.5 )=e0.5=0.6065
c) Waiting time at which only 10% of customers will continue to hold
P ( X > x )=e ƛx
e
x
3 =0.10
x=6.908 minutes
d) Probability that a randomly selected caller would be placed on hold for 3 to 6 min
P ( 3< x< 6 ) =e
3
3 -e
6
3 =e1e2=0.2325
Question 3
a) Probability of type II error, when μ=1000 and alpha = 0.10
3
tabler-icon-diamond-filled.svg

Paraphrase This Document

Need a fresh take? Get an instant paraphrase of this document with our AI Paraphraser
Document Page
β=P ( 884.2< x <1015.8 )=P (2.9< z <0.40 )
β=0.6535
b) Power of test when μ=1000 and alpha = 0.10
Here,
Power=1β=10.6535=0.3465
c) Power of test refers to the underlying probability associated with correctly rejecting a false
null hypothesis. Hence, in the given case, there is 0.3465 probability of the correct rejection
of null hypothesis (i.e. life is 950 hours) (Flick, 2015).
d) The β will decrease as n increases and this conclusion is also supported from the given data.
Question 4
Standard deviation = 6 ounces
Mean filling weight = 47 ounces
Sample size = 36 containers
Level of significance = 5%
Test whether the sample mean filling weight is 48.6 ounces or not.
Hypothesis testing
Hypotheses
4
Document Page
Null hypothesis H0 :μ=48.6
Alternative hypothesis H1 :μ 48.6
Test statistic
The value of test statistic z= 4748.6
6
36
=1.6
The p value
The p value = 2 NORMSDIST (z value) =2 NORMSDIST (-1.6) = 2* 0.0547 = 0.10959
It can be seen that p value is higher than level of significance and thus, it can be said that null
hypothesis would not be rejected and thus, alternative hypothesis would not be accepted (Koch,
2013). Therefore, the sample mean filling weight is 48.6 ounces.
References
Eriksson, P. and Kovalainen, A. (2015) Quantitative methods in business research. 3rd ed.
London: Sage Publications.
Flick, U. (2015) Introducing research methodology: A beginner's guide to doing a research
project. 4th ed. New York: Sage Publications.
Hillier, F. (2016) Introduction to Operations Research. 6th ed. New York: McGraw Hill
Publications.
Koch, K.R. (2013) Parameter Estimation and Hypothesis Testing in Linear Models. 2nd ed.
London: Springer Science & Business Media.
5
Document Page
6
chevron_up_icon
1 out of 7
circle_padding
hide_on_mobile
zoom_out_icon
[object Object]