STA101 Statistics for Business: Descriptive Statistics and Testing
VerifiedAdded on 2023/06/11
|9
|1219
|281
Homework Assignment
AI Summary
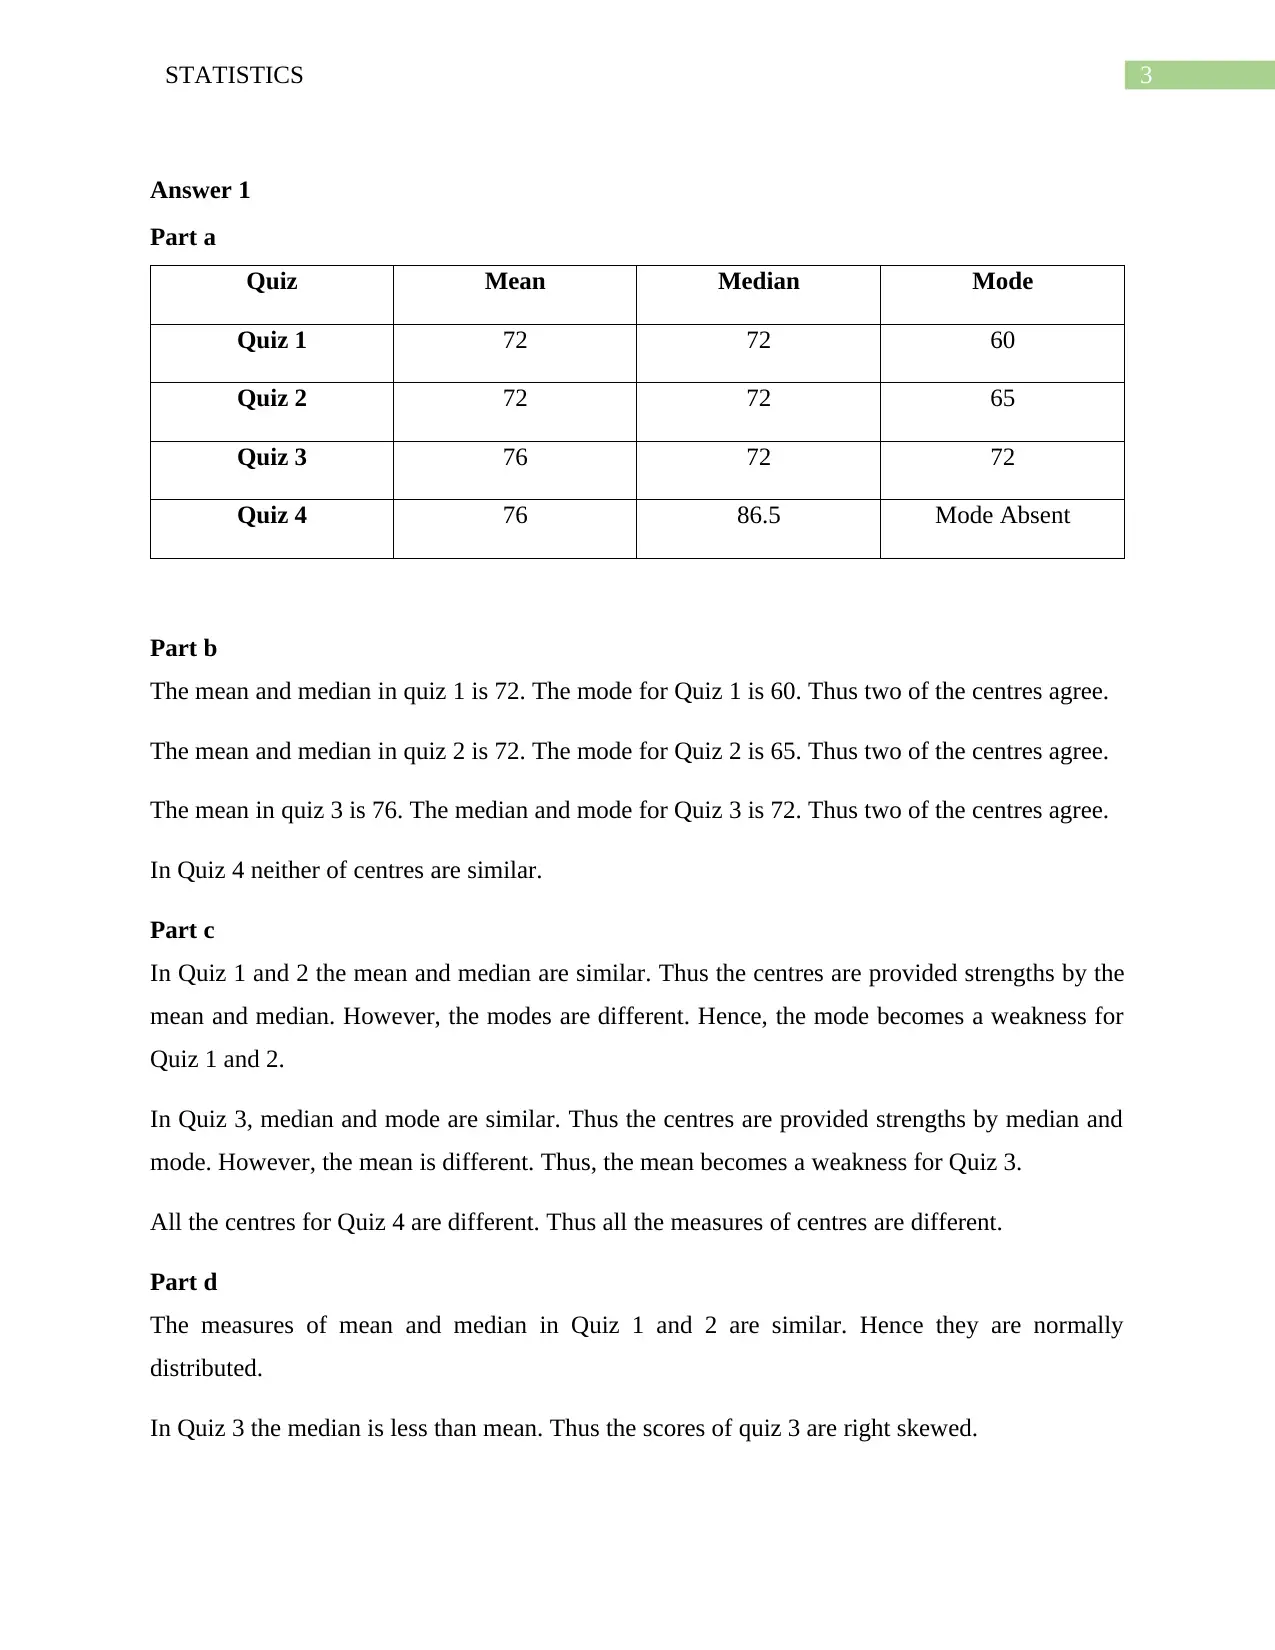
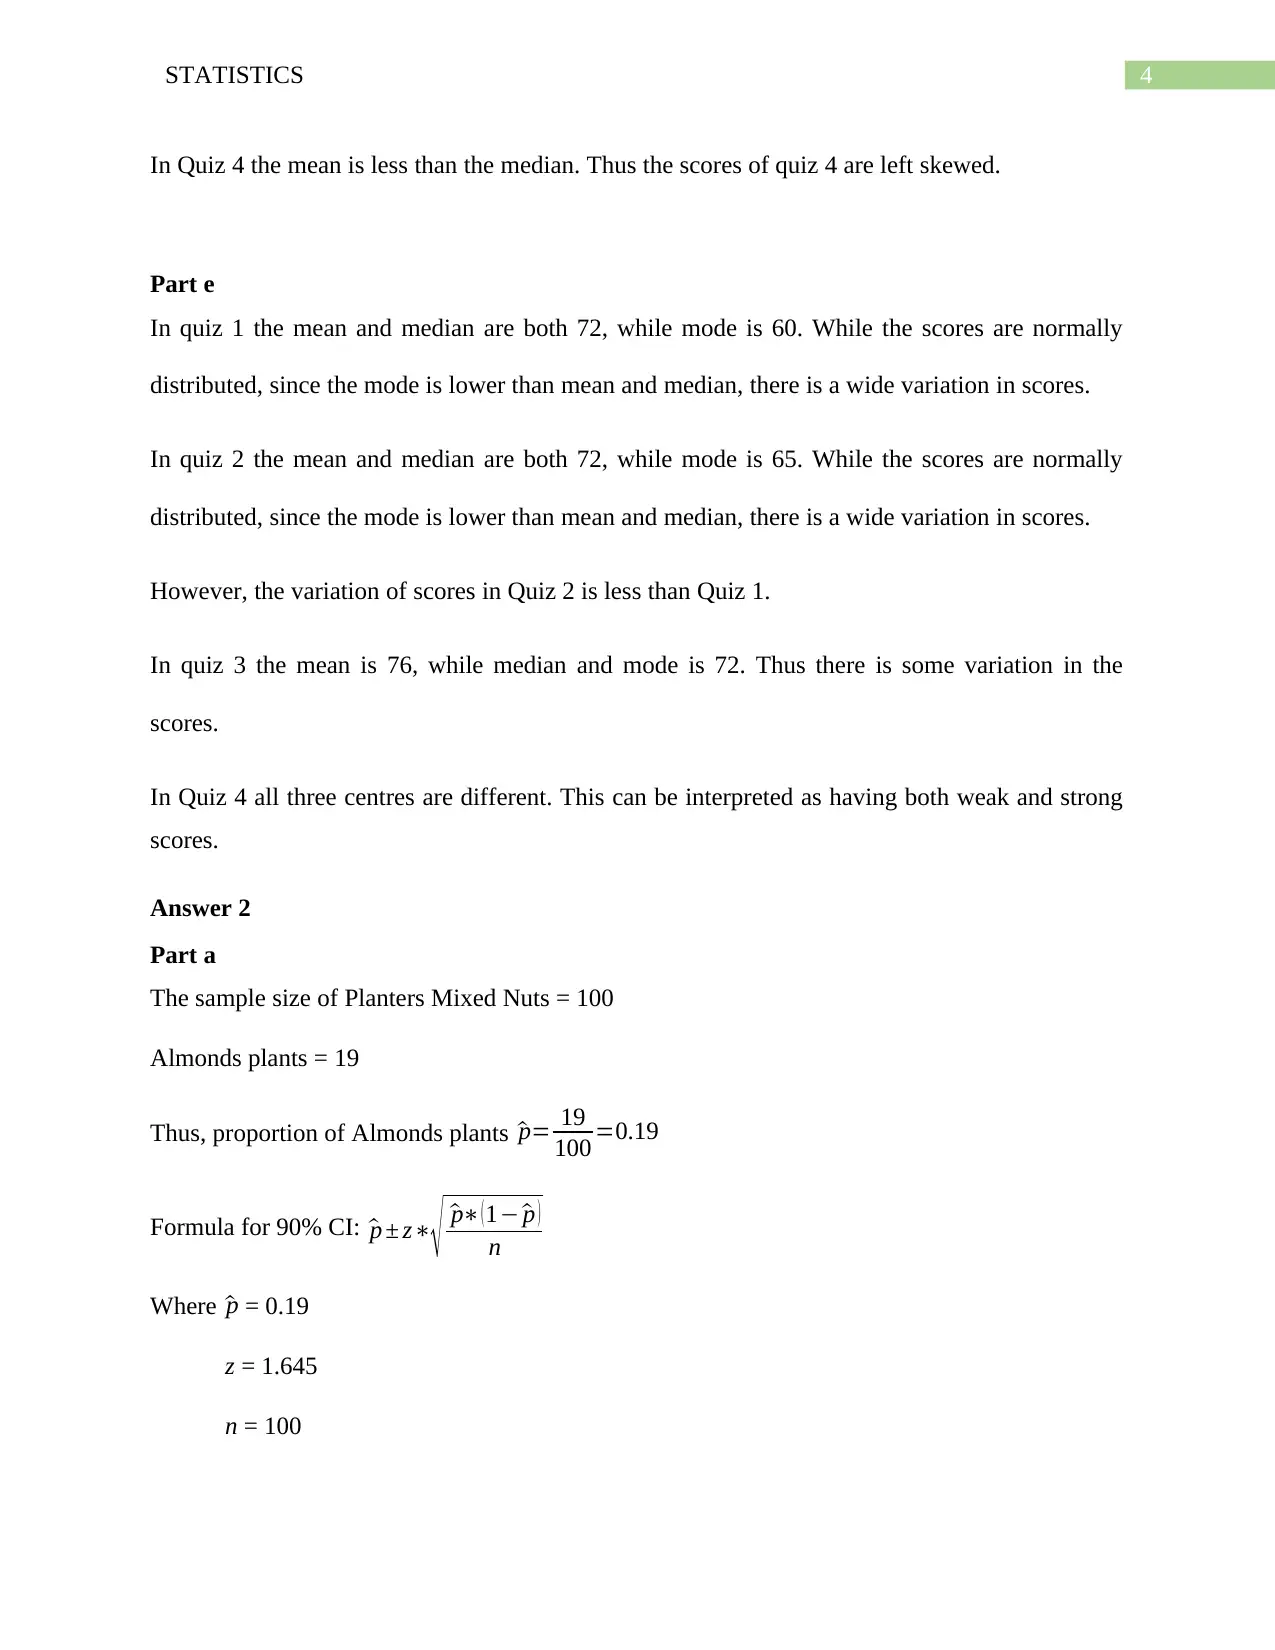
This assignment solution covers several key statistical concepts. It includes a descriptive analysis of four quizzes, calculating measures of central tendency (mean, median, mode) and discussing their strengths and weaknesses, as well as the distribution of scores. Confidence intervals are calculated for the proportion of almond plants in a sample of mixed nuts, including determining the required sample size for a given margin of error. A regression analysis is performed to assess the relationship between price and sound quality, including hypothesis testing on the price coefficient and interpreting the coefficient of determination. Finally, the assignment discusses Type I and Type II errors in the context of hypothesis testing related to package delivery times, considering the perspectives of both the company and the customer.

Running Head: STATISTICS
Statistics
Name of the Student
Name of the University
Author Note
Statistics
Name of the Student
Name of the University
Author Note
Paraphrase This Document
Need a fresh take? Get an instant paraphrase of this document with our AI Paraphraser

1STATISTICS
Table of Contents
Answer 1..........................................................................................................................................3
Part a............................................................................................................................................3
Part b............................................................................................................................................3
Part c............................................................................................................................................3
Part d............................................................................................................................................3
Part e............................................................................................................................................4
Answer 2..........................................................................................................................................4
Part a............................................................................................................................................4
Part b............................................................................................................................................5
Part c............................................................................................................................................5
Part d............................................................................................................................................5
Answer 3..........................................................................................................................................5
Part a............................................................................................................................................5
Part b............................................................................................................................................6
Part c............................................................................................................................................6
Answer 4..........................................................................................................................................6
Part a............................................................................................................................................6
Part b............................................................................................................................................6

2STATISTICS
Part c............................................................................................................................................7
Part d............................................................................................................................................7
Part e............................................................................................................................................7
⊘ This is a preview!⊘
Do you want full access?
Subscribe today to unlock all pages.

Trusted by 1+ million students worldwide

3STATISTICS
Answer 1
Part a
Quiz Mean Median Mode
Quiz 1 72 72 60
Quiz 2 72 72 65
Quiz 3 76 72 72
Quiz 4 76 86.5 Mode Absent
Part b
The mean and median in quiz 1 is 72. The mode for Quiz 1 is 60. Thus two of the centres agree.
The mean and median in quiz 2 is 72. The mode for Quiz 2 is 65. Thus two of the centres agree.
The mean in quiz 3 is 76. The median and mode for Quiz 3 is 72. Thus two of the centres agree.
In Quiz 4 neither of centres are similar.
Part c
In Quiz 1 and 2 the mean and median are similar. Thus the centres are provided strengths by the
mean and median. However, the modes are different. Hence, the mode becomes a weakness for
Quiz 1 and 2.
In Quiz 3, median and mode are similar. Thus the centres are provided strengths by median and
mode. However, the mean is different. Thus, the mean becomes a weakness for Quiz 3.
All the centres for Quiz 4 are different. Thus all the measures of centres are different.
Part d
The measures of mean and median in Quiz 1 and 2 are similar. Hence they are normally
distributed.
In Quiz 3 the median is less than mean. Thus the scores of quiz 3 are right skewed.
Paraphrase This Document
Need a fresh take? Get an instant paraphrase of this document with our AI Paraphraser

4STATISTICS
In Quiz 4 the mean is less than the median. Thus the scores of quiz 4 are left skewed.
Part e
In quiz 1 the mean and median are both 72, while mode is 60. While the scores are normally
distributed, since the mode is lower than mean and median, there is a wide variation in scores.
In quiz 2 the mean and median are both 72, while mode is 65. While the scores are normally
distributed, since the mode is lower than mean and median, there is a wide variation in scores.
However, the variation of scores in Quiz 2 is less than Quiz 1.
In quiz 3 the mean is 76, while median and mode is 72. Thus there is some variation in the
scores.
In Quiz 4 all three centres are different. This can be interpreted as having both weak and strong
scores.
Answer 2
Part a
The sample size of Planters Mixed Nuts = 100
Almonds plants = 19
Thus, proportion of Almonds plants ^p= 19
100 =0.19
Formula for 90% CI: ^p ± z∗
√ ^p∗ (1− ^p )
n
Where ^p = 0.19
z = 1.645
n = 100

5STATISTICS
Thus, 90% CI ¿ 0.19 ±1.645∗
√ 0.19∗( 1−0.19 )
100 =0.19 ±1.645∗√0.001539
¿ 0.19 ±1.645∗0.039=¿ 0.19 ±0.064
Lower Limit of 90% CI = 0.126
Upper Limit of 90% CI = 0.254
Part b
n = 100
π = 0.19
Thus, nπ =100∗0.19=19
Since nπ ≥ 10 hence the normality may be assumed
Part c
The required sample size ¿ ( z
Error )
2
∗ ^p∗( 1− ^p ) =( 1.645
0.03 )
2
∗0.19∗0.81
54.832∗0.19∗0.81=462.67 ≈ 463
Sample size needed for 90 percent confidence with an error of ± 0.03 is 463 plants.
Part d
The information tells us that there are 19 almond plants for every 100 mixed nuts plants.
Sampling would enable the qc manager to justify the above number of almond plants.
Answer 3
Regression
Statistics
R Square 0.01104
Standard Error 4.02545
Observations 27
⊘ This is a preview!⊘
Do you want full access?
Subscribe today to unlock all pages.

Trusted by 1+ million students worldwide

6STATISTICS
Statistic Coefficients Std Error t Stat P-value Lower 95% Upper 95%
Intercept 88.4902 1.67814 52.731 0.0000 85.0340 91.9464
Price −0.00239 0.00453 −0.528 0.6019 −0.01172 0.00693
Part a
Null Hypothesis: The coefficient for Price is equal to zero
H0 : β1=0
Alternate Hypothesis: The coefficient for Price is not equal to zero
H A : β1 ≠ 0
For the independent variable “price” p-value is 0.6019. Since p-value > 0.05, we do not reject the
null hypothesis.
Thus, the coefficient of “price” is equal to zero.
Part b
The value of R2 is 0.01104.
Thus, the coefficient of determination provides us with the information that “price” can
explain 1.104% variation in sound quality.
Part c
The coefficient of Price is -0.00239. the coefficient of “price” is negative. Hence, for one-dollar
increase in “price” sound quality decreases by 0.00239 units.
It, is found that increase in “price” decreases sound quality.
Answer 4
Part a
Null Hypothesis: Average time required for delivery of package is 2 days
H0 : μ=2 days
Alternate Hypothesis: Average time required for delivery of package is more than 2 days
Paraphrase This Document
Need a fresh take? Get an instant paraphrase of this document with our AI Paraphraser

7STATISTICS
H A : μ>2 days
Part b
This is a type II error. The Null hypothesis is accepted when it should have been rejected.
Under, the above circumstance when a type II error occurs, the delivery of package would take
more than 2 days on an average.
Part c
This is a type I error. The Null hypothesis is rejected when it should have been accepted.
Under, the above circumstance when a type I error occurs, the delivery of package would take
within 2 days on an average.
Part d
From the company’s point of view having a type I error harms the image of the organization.
When a type I error occurs then the alternate hypothesis is accepted. In other words, this mean
the average delivery time would be more than 2 days. The company would always want to
maintain an average delivery time of less than or equal to 2 days.
Part e
From the customer’s point of view having a type II error means the customer would get the
delivery later than 2 days. When a type II error occurs then the null hypothesis is accepted,
although it should have been rejected. In other words, the average delivery time is more than 2
days. The customer is in a false belief that the delivery would take place with 2 days.

8STATISTICS
⊘ This is a preview!⊘
Do you want full access?
Subscribe today to unlock all pages.

Trusted by 1+ million students worldwide
1 out of 9
Related Documents

Your All-in-One AI-Powered Toolkit for Academic Success.
+13062052269
info@desklib.com
Available 24*7 on WhatsApp / Email
Unlock your academic potential
Copyright © 2020–2025 A2Z Services. All Rights Reserved. Developed and managed by ZUCOL.