STA1100: Probability, Random Variables, and Time Series Assignment

Verified

Added on  2022/07/28

|6
|703
|25
Homework Assignment
AI Summary
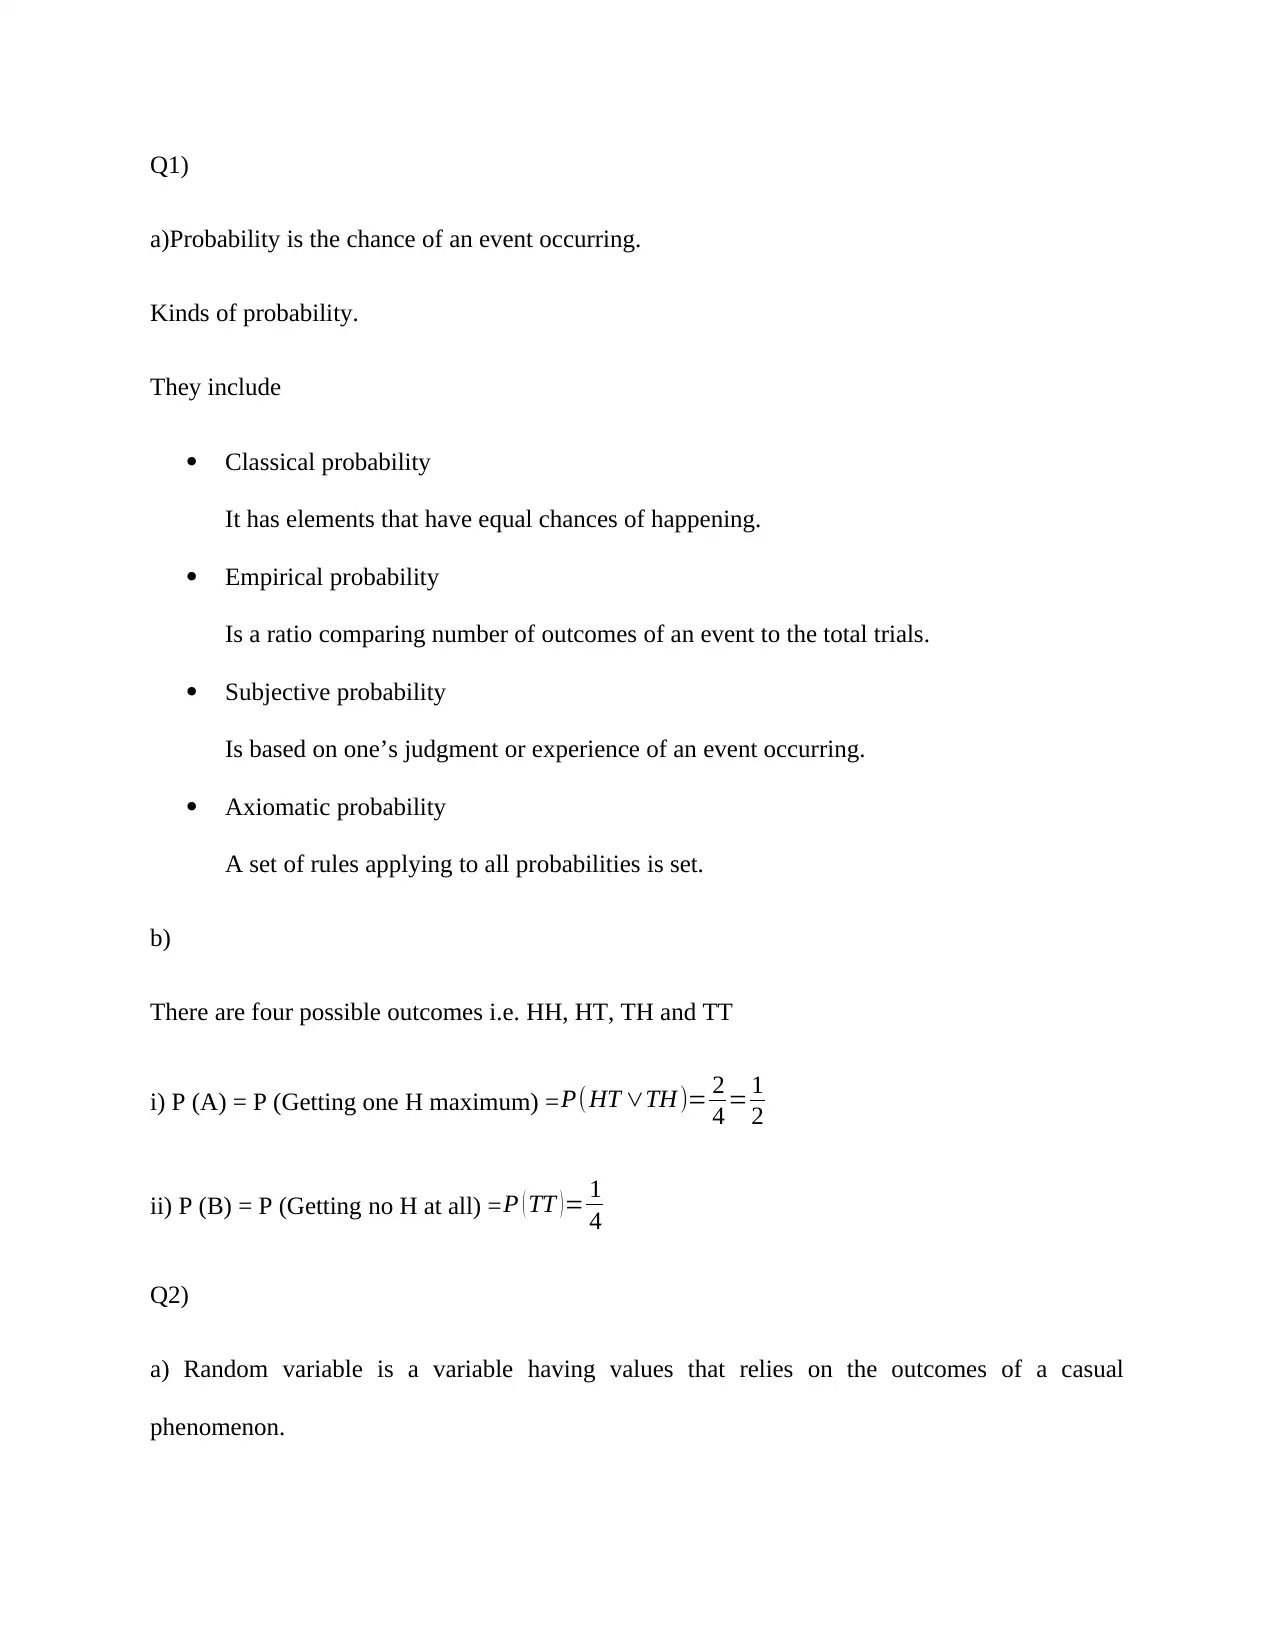
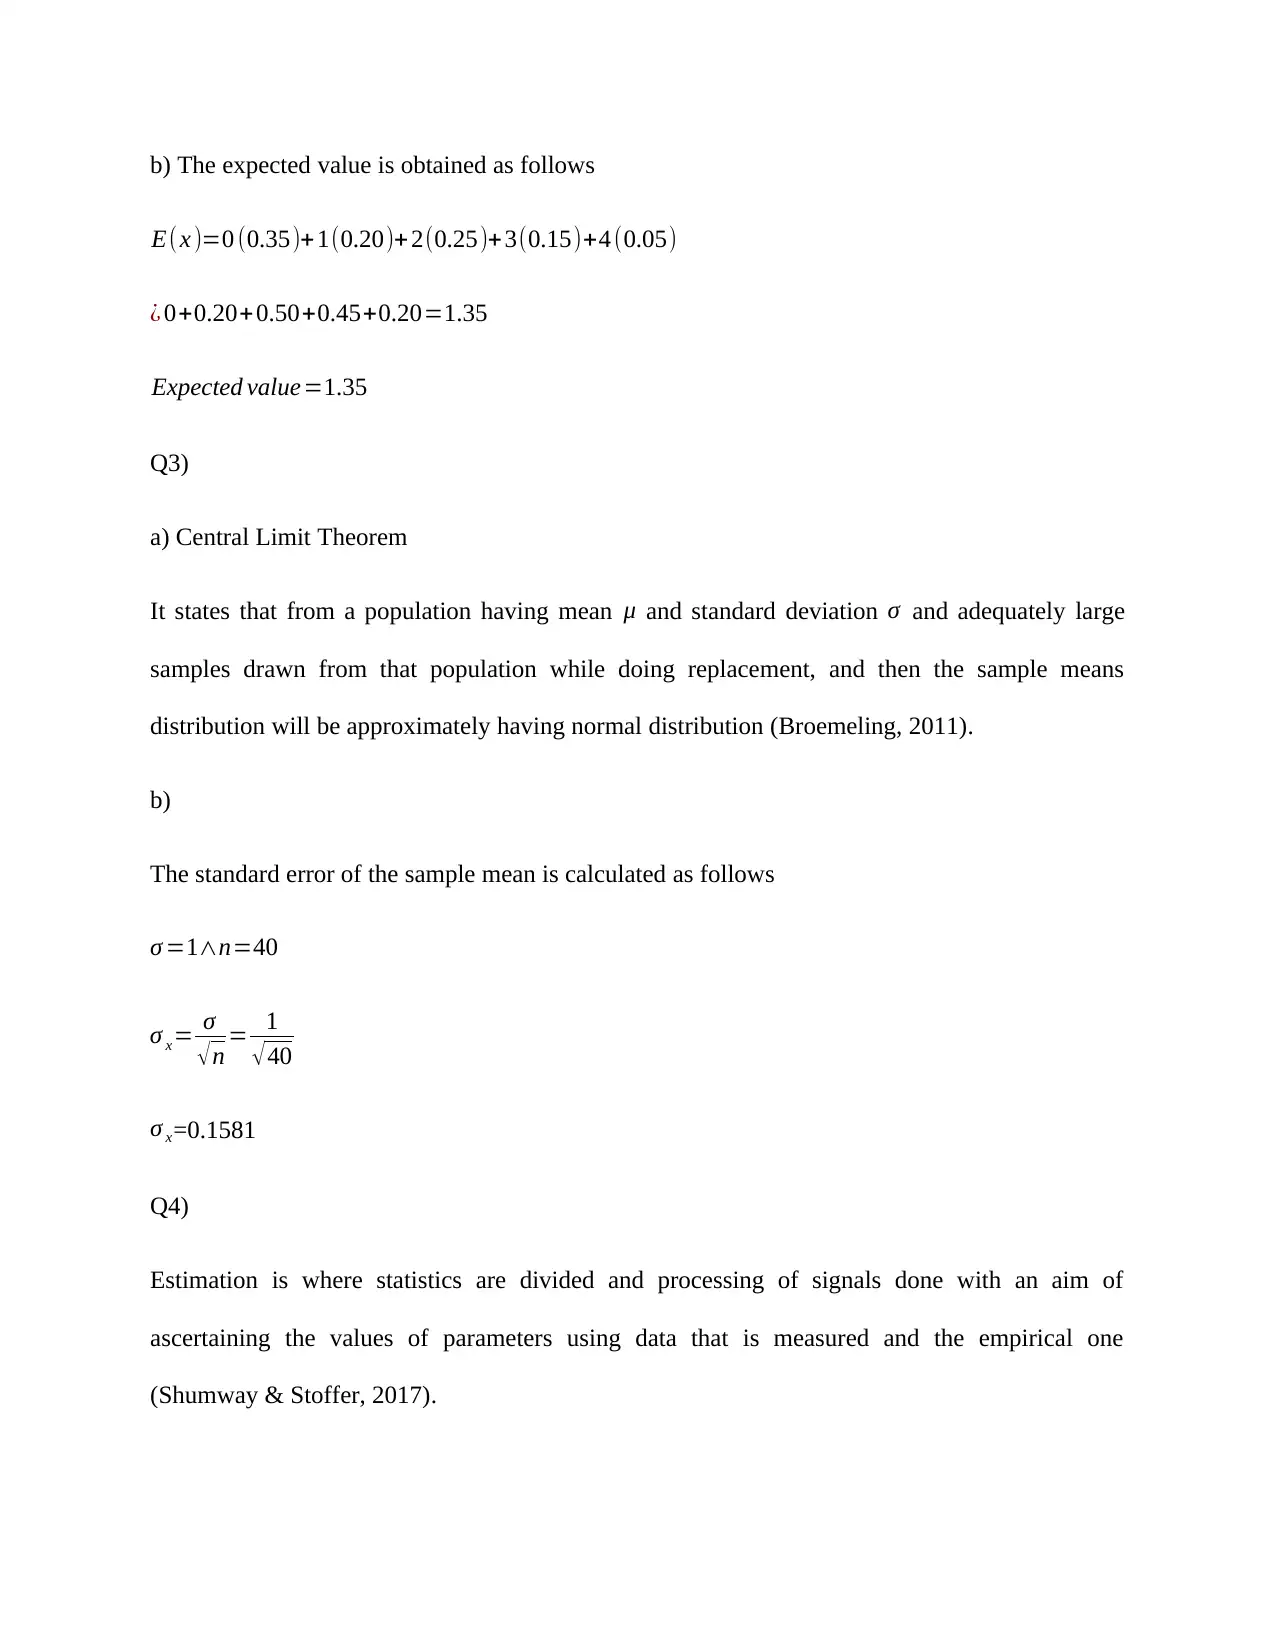
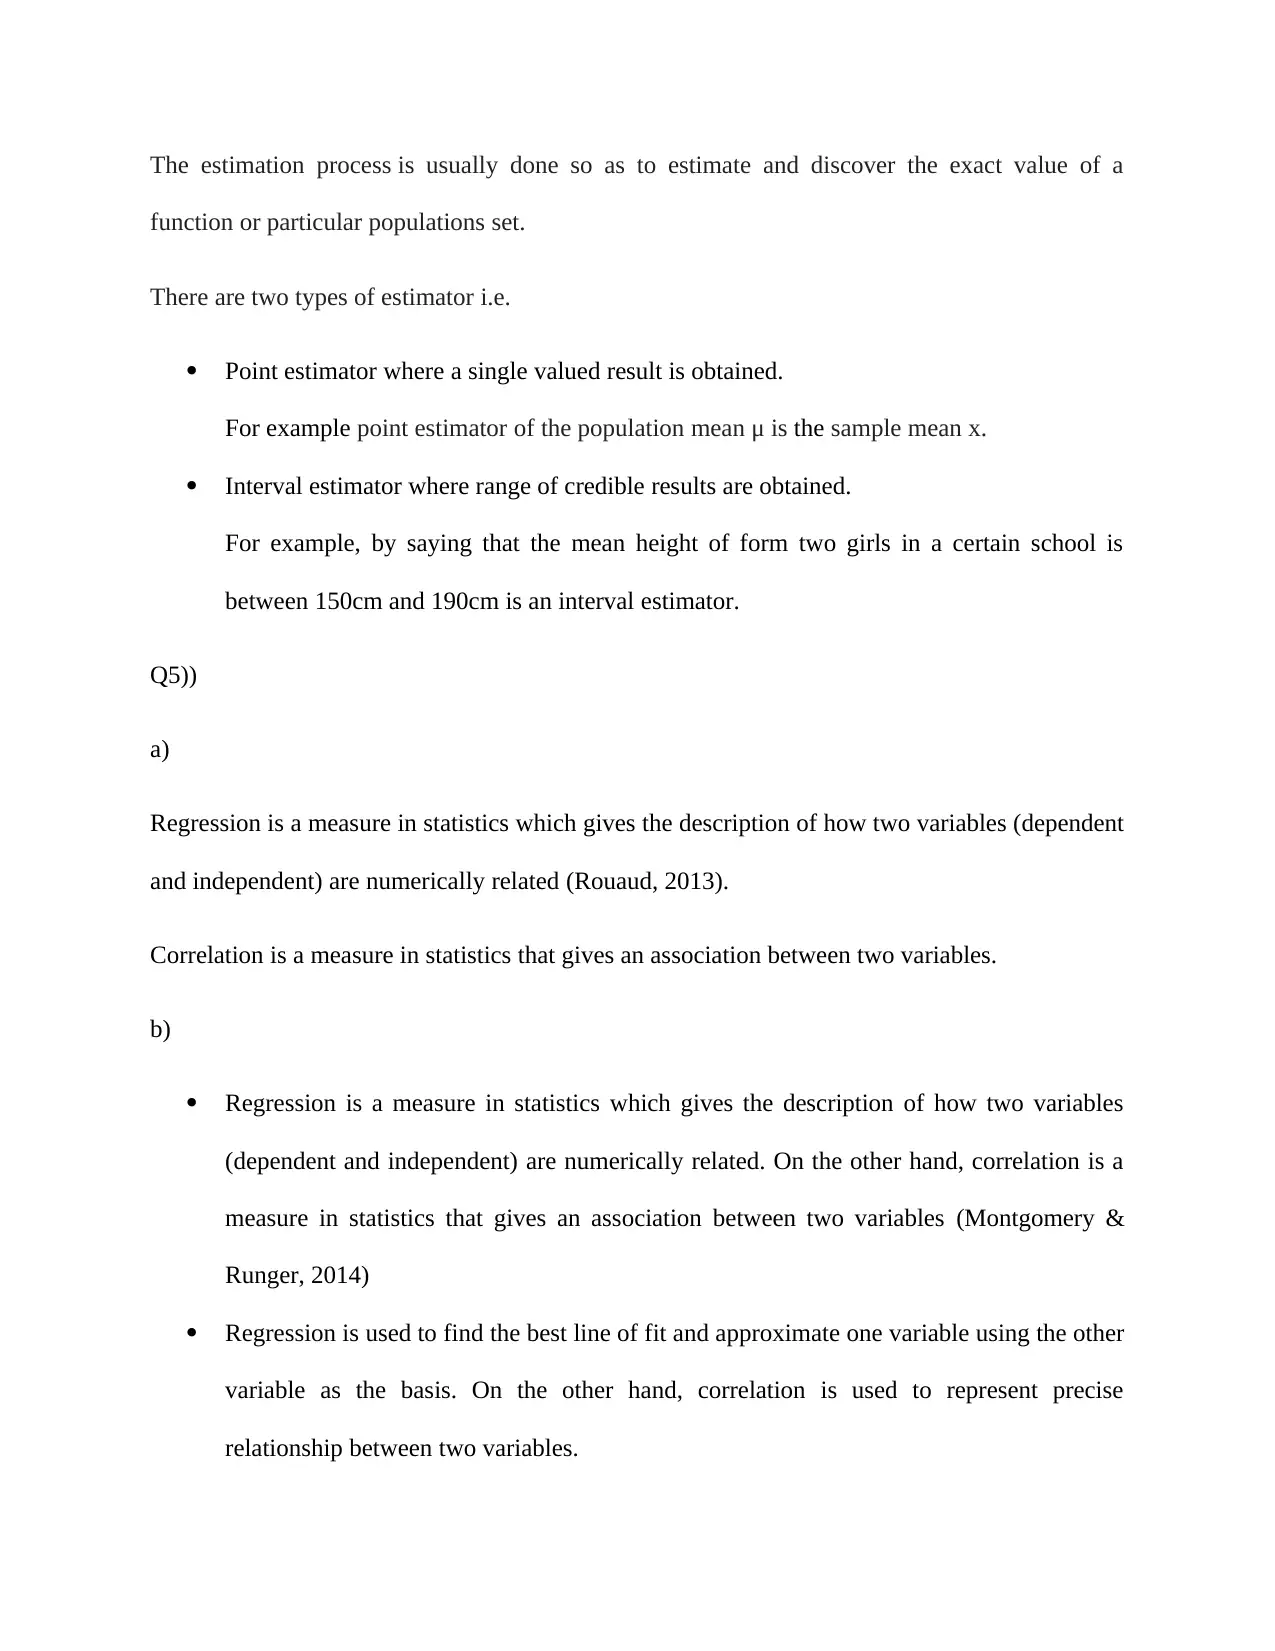
This homework assignment provides solutions to a statistics assignment (STA1100), covering various topics in probability and statistics. The assignment addresses key concepts such as probability definitions, including classical, empirical, subjective, and axiomatic probability, and applies these to coin toss scenarios. It also explores random variables and their expected values, along with the Central Limit Theorem and its implications for sample means. Furthermore, the assignment delves into statistical estimation, differentiating between point and interval estimators. It clarifies the differences between regression and correlation, explaining their roles in analyzing relationships between variables. Finally, the assignment discusses time series analysis, outlining its components and applications in predicting future values based on historical data. The provided solutions include detailed workings, formulas, and references to support the answers.
Document Page
Mathematics Assignment:
Student Name:
Instructor Name:
Course Number:
16th April 2020
tabler-icon-diamond-filled.svg

Paraphrase This Document

Need a fresh take? Get an instant paraphrase of this document with our AI Paraphraser
Document Page
Q1)
a)Probability is the chance of an event occurring.
Kinds of probability.
They include
Classical probability
It has elements that have equal chances of happening.
Empirical probability
Is a ratio comparing number of outcomes of an event to the total trials.
Subjective probability
Is based on one’s judgment or experience of an event occurring.
Axiomatic probability
A set of rules applying to all probabilities is set.
b)
There are four possible outcomes i.e. HH, HT, TH and TT
i) P (A) = P (Getting one H maximum) = P(HT TH )= 2
4 = 1
2
ii) P (B) = P (Getting no H at all) =P ( TT )= 1
4
Q2)
a) Random variable is a variable having values that relies on the outcomes of a casual
phenomenon.
Document Page
b) The expected value is obtained as follows
E(x )=0 (0.35)+1(0.20)+ 2(0.25)+3(0.15)+4 (0.05)
¿ 0+0.20+0.50+0.45+0.20=1.35
Expected value=1.35
Q3)
a) Central Limit Theorem
It states that from a population having mean μ and standard deviation σ and adequately large
samples drawn from that population while doing replacement, and then the sample means
distribution will be approximately having normal distribution (Broemeling, 2011).
b)
The standard error of the sample mean is calculated as follows
σ =1n=40
σ x= σ
n = 1
40
σ x=0.1581
Q4)
Estimation is where statistics are divided and processing of signals done with an aim of
ascertaining the values of parameters using data that is measured and the empirical one
(Shumway & Stoffer, 2017).
Document Page
The estimation process is usually done so as to estimate and discover the exact value of a
function or particular populations set.
There are two types of estimator i.e.
Point estimator where a single valued result is obtained.
For example point estimator of the population mean μ is the sample mean x.
Interval estimator where range of credible results are obtained.
For example, by saying that the mean height of form two girls in a certain school is
between 150cm and 190cm is an interval estimator.
Q5))
a)
Regression is a measure in statistics which gives the description of how two variables (dependent
and independent) are numerically related (Rouaud, 2013).
Correlation is a measure in statistics that gives an association between two variables.
b)
Regression is a measure in statistics which gives the description of how two variables
(dependent and independent) are numerically related. On the other hand, correlation is a
measure in statistics that gives an association between two variables (Montgomery &
Runger, 2014)
Regression is used to find the best line of fit and approximate one variable using the other
variable as the basis. On the other hand, correlation is used to represent precise
relationship between two variables.
tabler-icon-diamond-filled.svg

Paraphrase This Document

Need a fresh take? Get an instant paraphrase of this document with our AI Paraphraser
Document Page
Regression uses different variables while correlation uses the same variables.
Q6)
Time series is a series where data points are recorded in order of time.
It is used to predict future values while relying on the previously observed values (Hamming,
2012).
Components of time series are
The trend variations.
It usually moves up or down in a predicted pattern.
The seasonal variations.
They repeat themselves over specific period.
The cyclical variations
Document Page
References
Broemeling, L. D., 2011. An Account of Early Statistical Inference in Arab Cryptology. The
American Statistician, 65(4), p. 255–257.
Hamming, R., 2012. Numerical methods for scientists and engineers. s.l.:Courier Corporation.
Montgomery, D. C. & Runger, G. C., 2014. Applied Statistics and Probability for Engineers (6th
ed.). s.l.:Wiley.
Rouaud, M., 2013. Probability, Statistics and Estimation. s.l.:s.n.
Shumway, R. & Stoffer, D. S., 2017. Time Series Analysis and its Applications: With R
Examples (ed. 4). s.l.:Springer.
chevron_up_icon
1 out of 6
circle_padding
hide_on_mobile
zoom_out_icon
[object Object]