STA117 Assignment: Data Analysis and Interpretation, MNU, Term 1, 2019

Verified

Added on  2023/01/19

|8
|891
|53
Homework Assignment
AI Summary
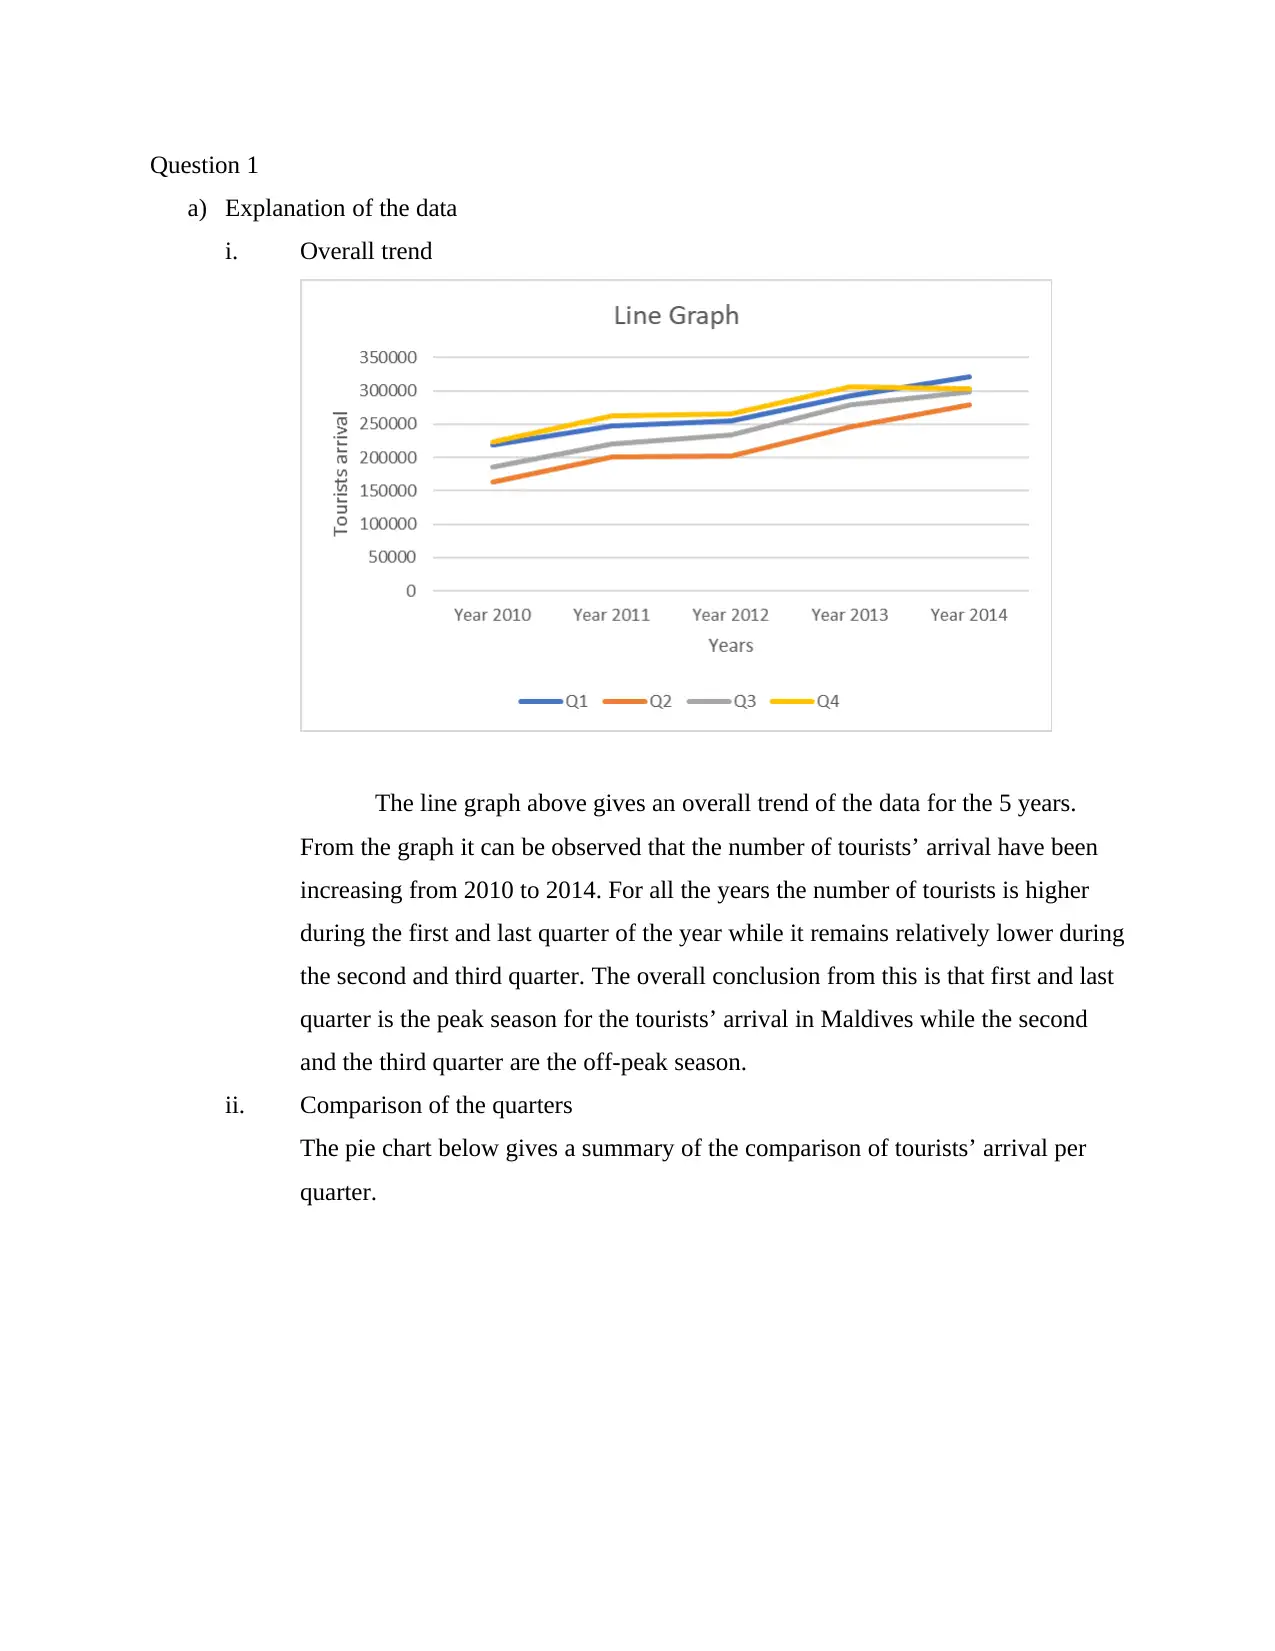
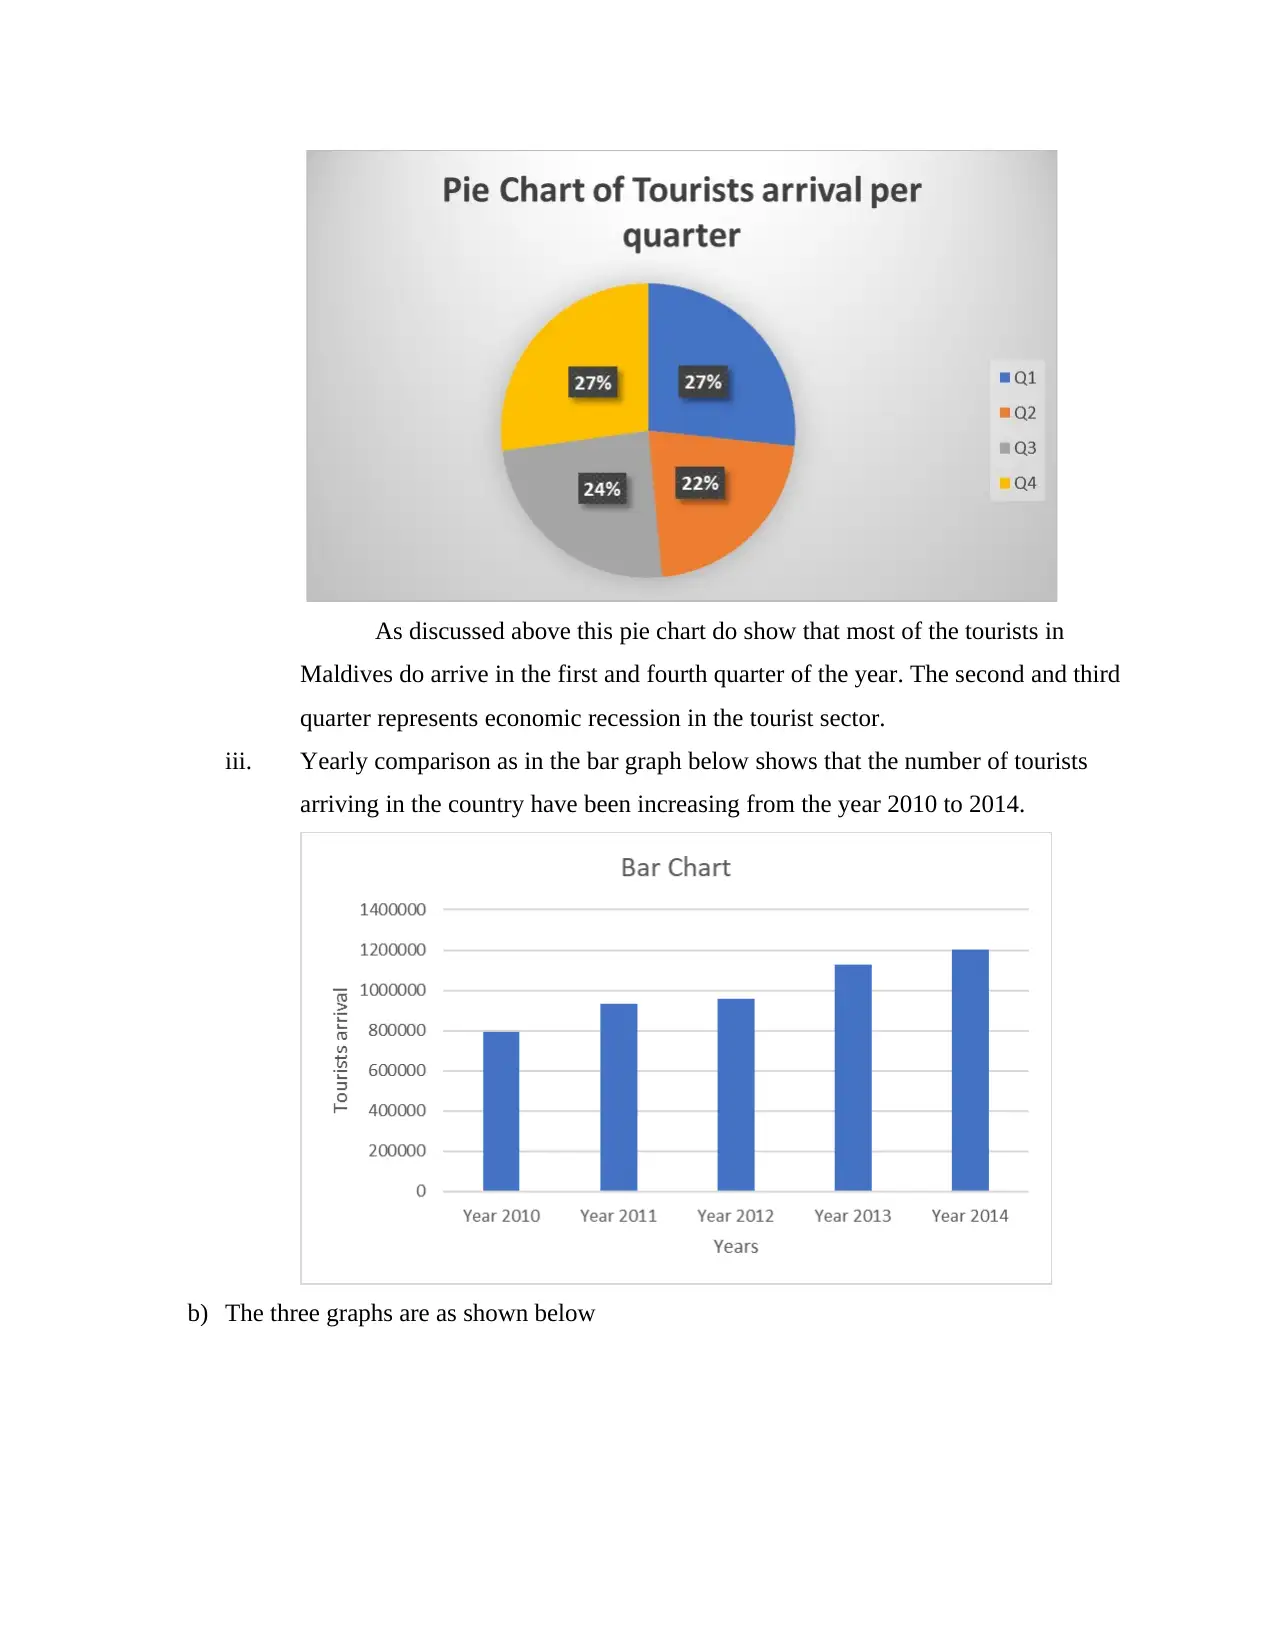
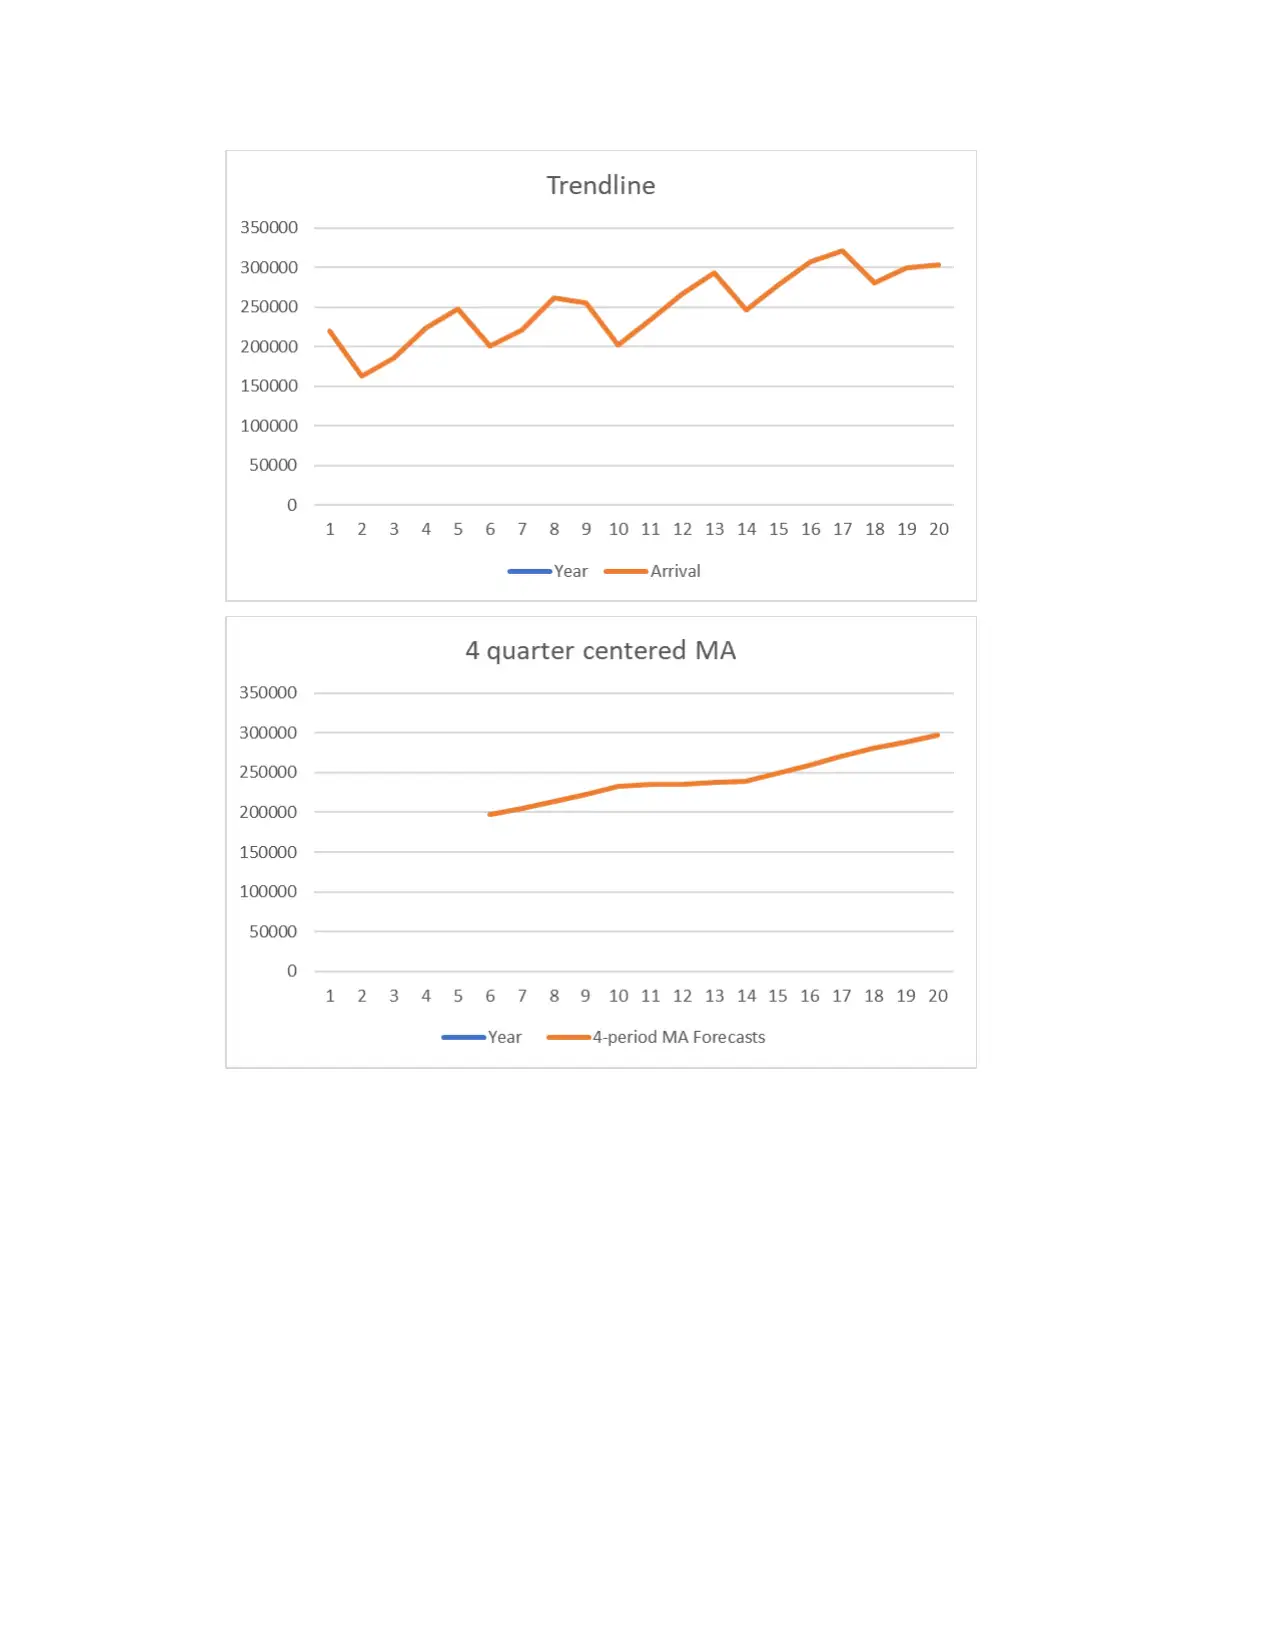
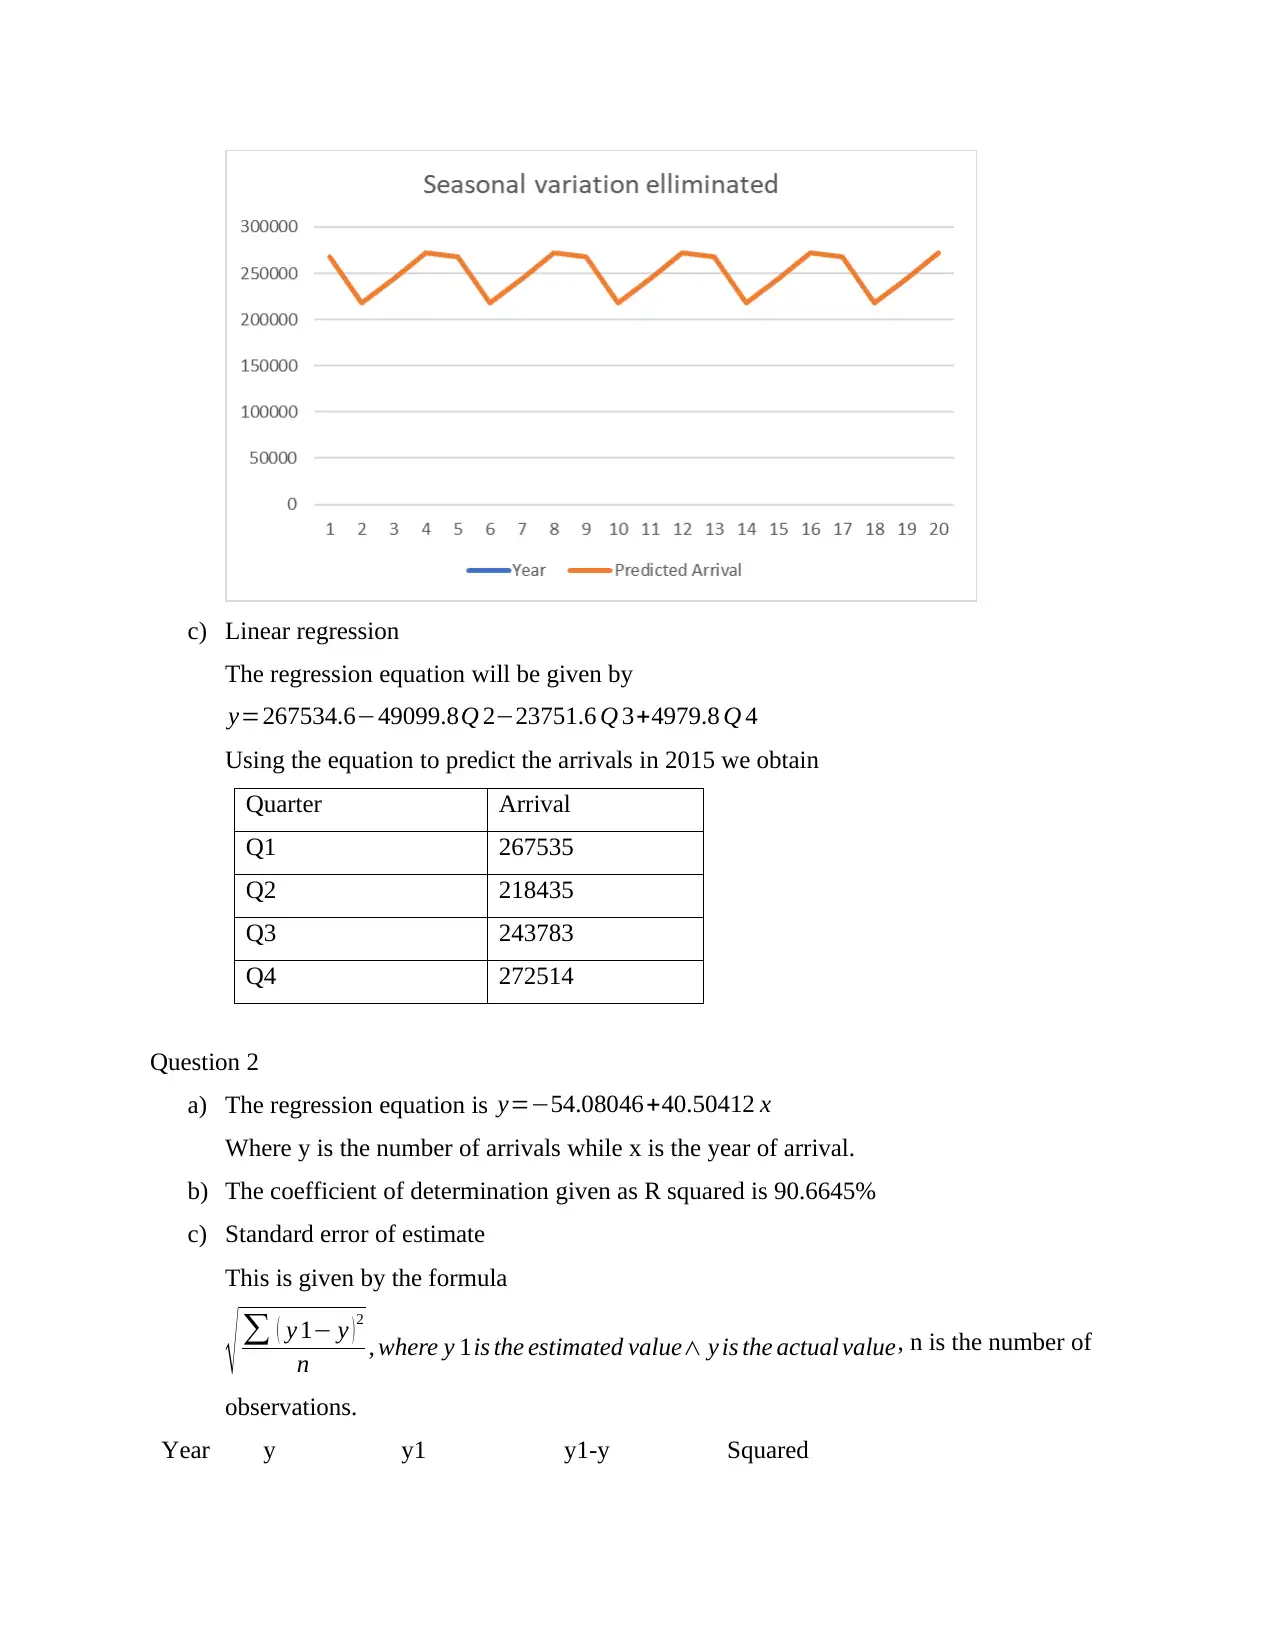
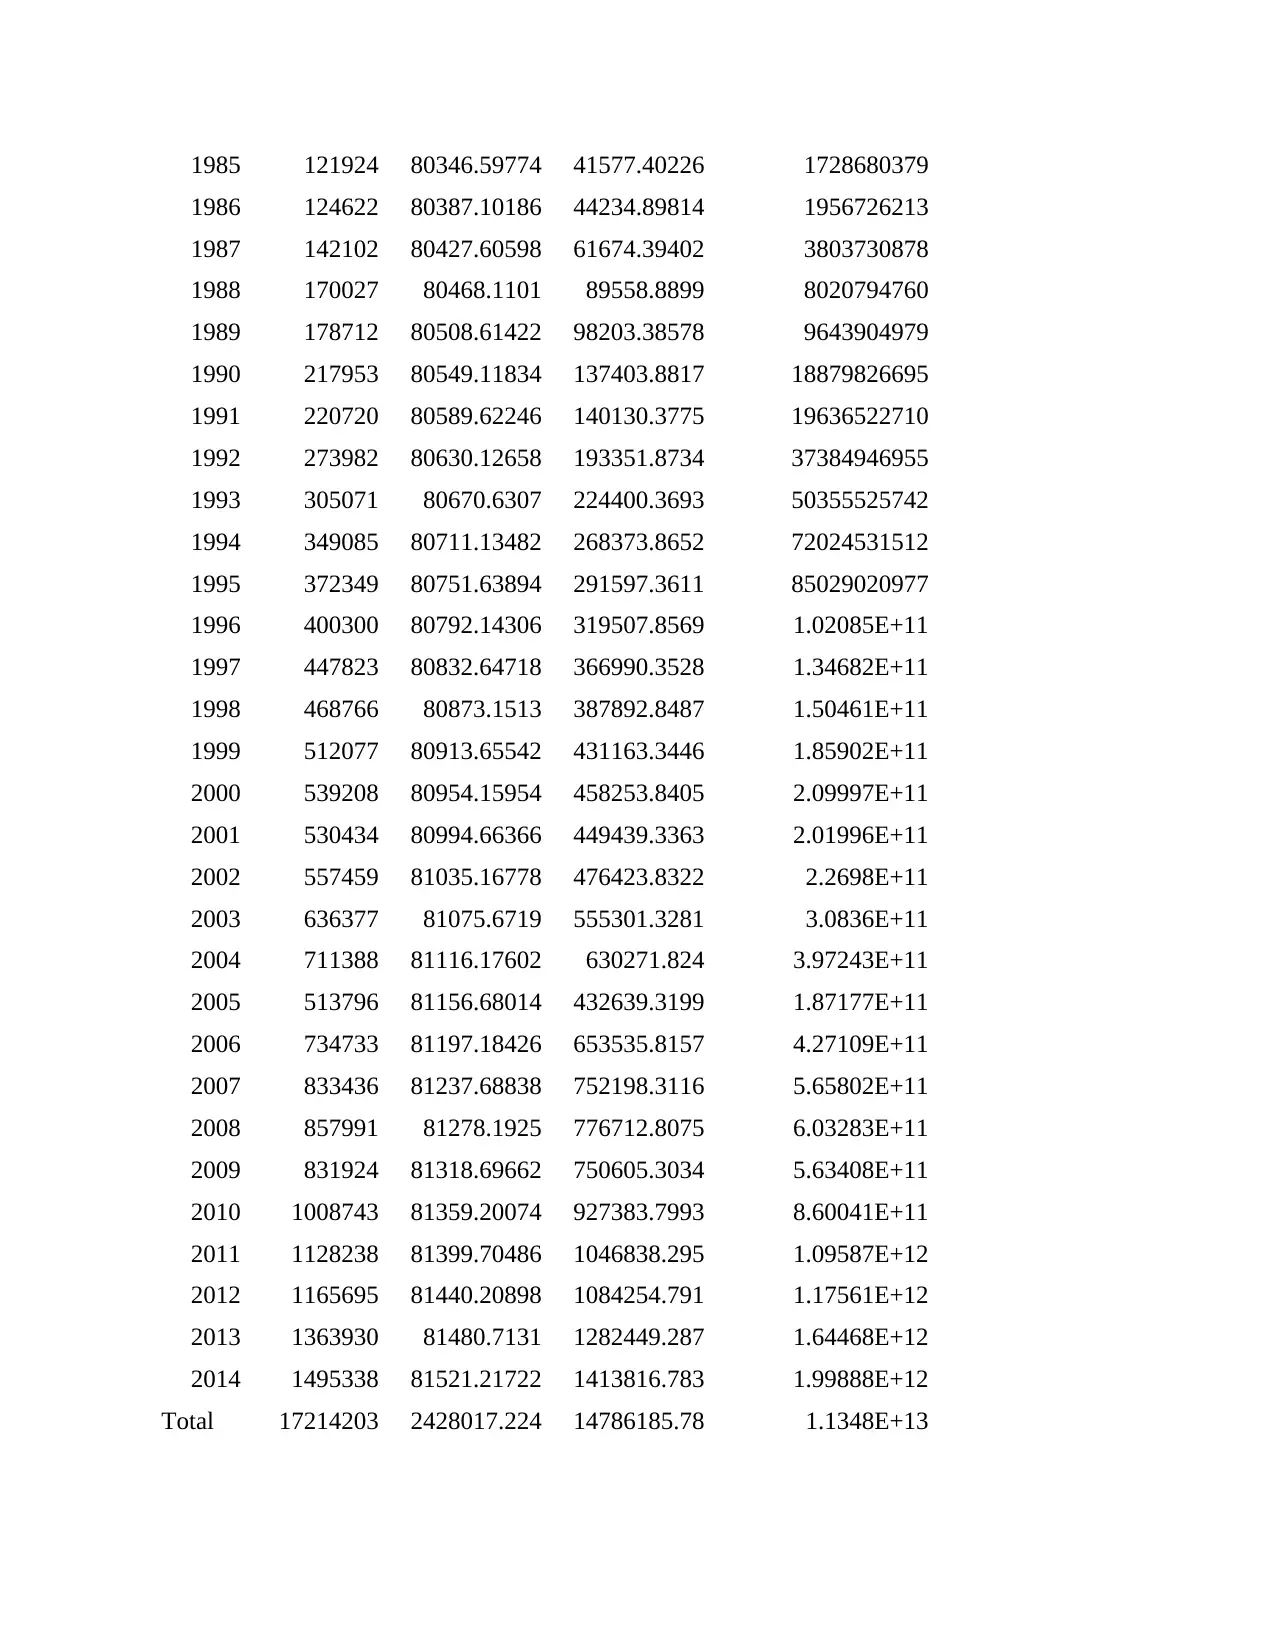
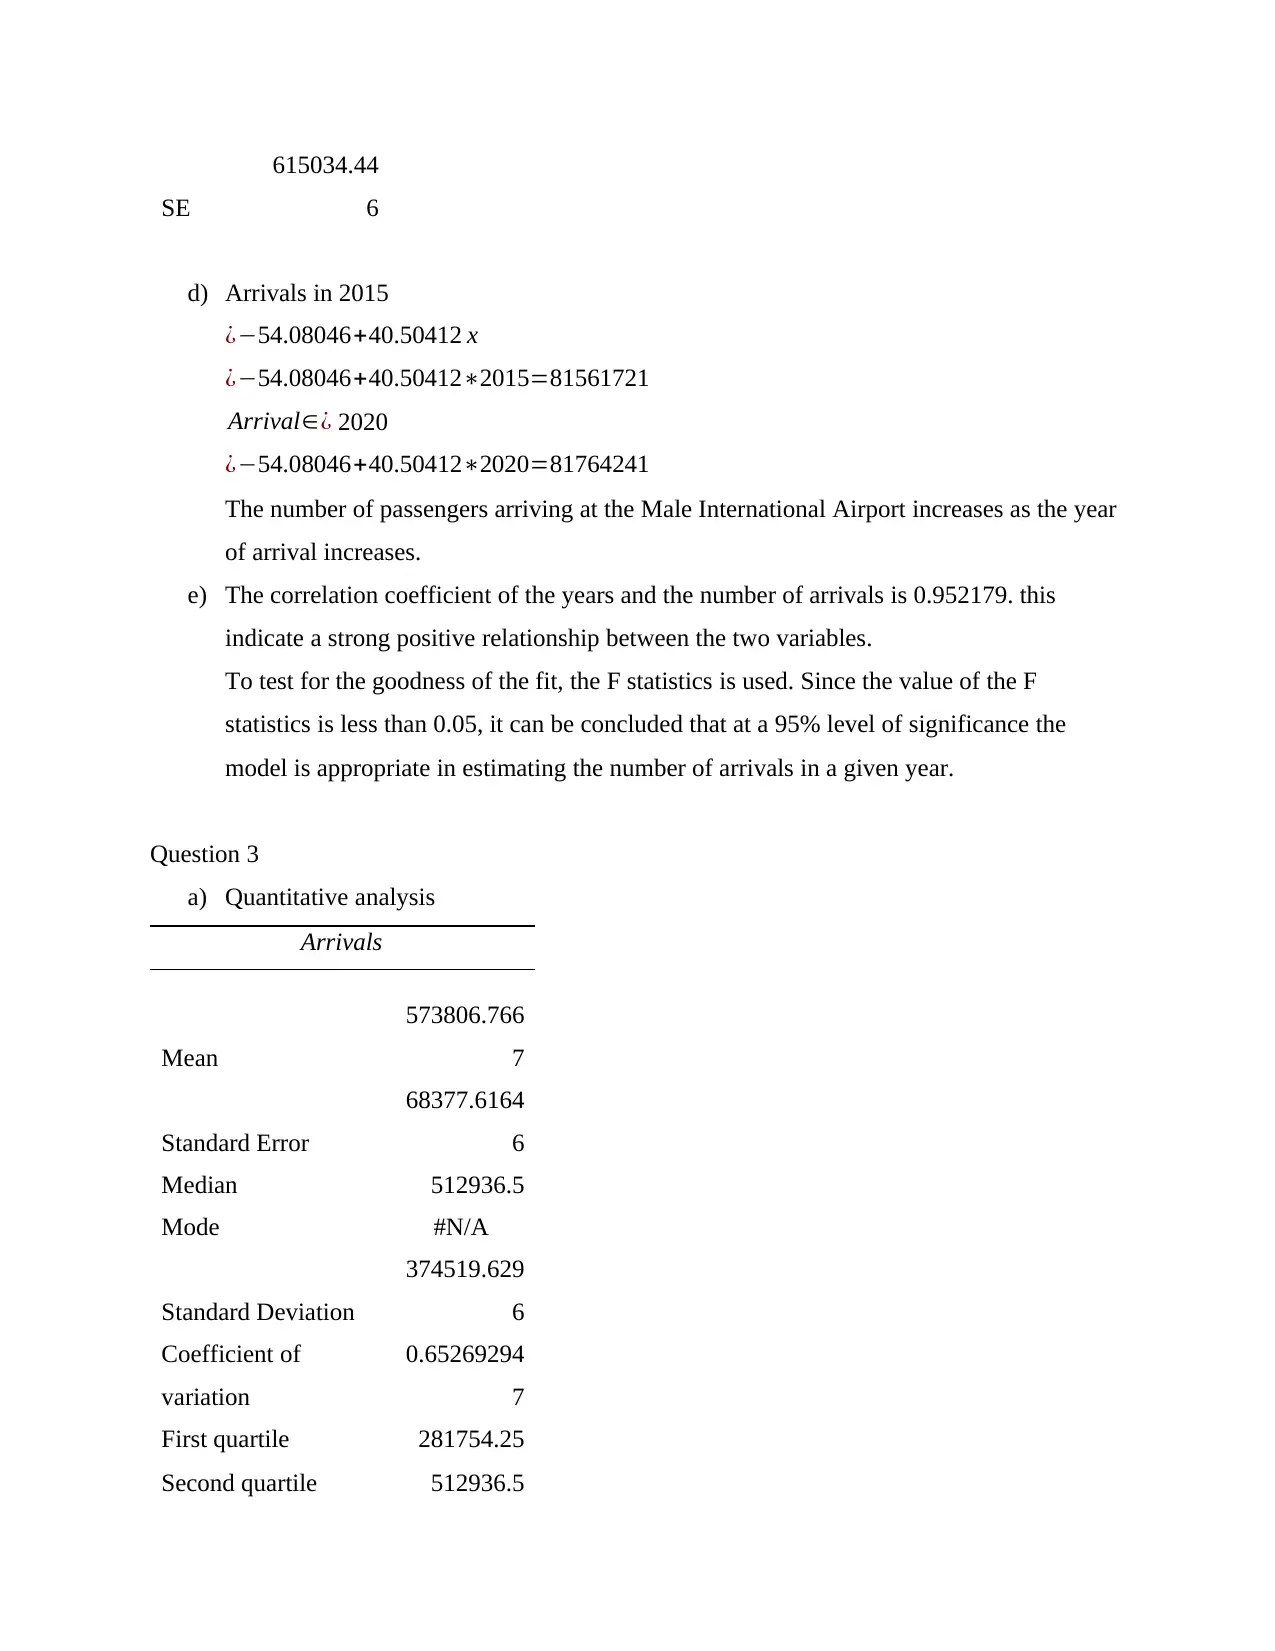
This STA117 assignment, completed for Maldives National University's Term 1 in 2019, presents a detailed statistical analysis of tourist arrival data. The assignment begins with an explanation of the data, including overall trends, quarterly comparisons, and yearly comparisons using line graphs, pie charts, and bar graphs. It then delves into linear regression, providing regression equations and predictions for future arrivals. The solution includes calculations for the coefficient of determination, standard error of estimate, and correlation coefficient. The analysis concludes with a quantitative analysis, descriptive statistics, and a comprehensive report summarizing the findings, highlighting the strong positive correlation between the year and the number of arrivals, and the use of regression models for prediction. The assignment addresses three key questions, offering a comprehensive understanding of the statistical techniques and their application to real-world scenarios.
Document Page
STA117: Assignment
Student Name
Institution Name
Date
tabler-icon-diamond-filled.svg

Paraphrase This Document

Need a fresh take? Get an instant paraphrase of this document with our AI Paraphraser
Document Page
Question 1
a) Explanation of the data
i. Overall trend
The line graph above gives an overall trend of the data for the 5 years.
From the graph it can be observed that the number of tourists’ arrival have been
increasing from 2010 to 2014. For all the years the number of tourists is higher
during the first and last quarter of the year while it remains relatively lower during
the second and third quarter. The overall conclusion from this is that first and last
quarter is the peak season for the tourists’ arrival in Maldives while the second
and the third quarter are the off-peak season.
ii. Comparison of the quarters
The pie chart below gives a summary of the comparison of tourists’ arrival per
quarter.
Document Page
As discussed above this pie chart do show that most of the tourists in
Maldives do arrive in the first and fourth quarter of the year. The second and third
quarter represents economic recession in the tourist sector.
iii. Yearly comparison as in the bar graph below shows that the number of tourists
arriving in the country have been increasing from the year 2010 to 2014.
b) The three graphs are as shown below
Document Page
tabler-icon-diamond-filled.svg

Paraphrase This Document

Need a fresh take? Get an instant paraphrase of this document with our AI Paraphraser
Document Page
c) Linear regression
The regression equation will be given by
y=267534.649099.8Q 223751.6 Q 3+4979.8 Q 4
Using the equation to predict the arrivals in 2015 we obtain
Quarter Arrival
Q1 267535
Q2 218435
Q3 243783
Q4 272514
Question 2
a) The regression equation is y=54.08046+40.50412 x
Where y is the number of arrivals while x is the year of arrival.
b) The coefficient of determination given as R squared is 90.6645%
c) Standard error of estimate
This is given by the formula
( y 1 y )2
n , where y 1is the estimated value y is the actual value, n is the number of
observations.
Year y y1 y1-y Squared
Document Page
1985 121924 80346.59774 41577.40226 1728680379
1986 124622 80387.10186 44234.89814 1956726213
1987 142102 80427.60598 61674.39402 3803730878
1988 170027 80468.1101 89558.8899 8020794760
1989 178712 80508.61422 98203.38578 9643904979
1990 217953 80549.11834 137403.8817 18879826695
1991 220720 80589.62246 140130.3775 19636522710
1992 273982 80630.12658 193351.8734 37384946955
1993 305071 80670.6307 224400.3693 50355525742
1994 349085 80711.13482 268373.8652 72024531512
1995 372349 80751.63894 291597.3611 85029020977
1996 400300 80792.14306 319507.8569 1.02085E+11
1997 447823 80832.64718 366990.3528 1.34682E+11
1998 468766 80873.1513 387892.8487 1.50461E+11
1999 512077 80913.65542 431163.3446 1.85902E+11
2000 539208 80954.15954 458253.8405 2.09997E+11
2001 530434 80994.66366 449439.3363 2.01996E+11
2002 557459 81035.16778 476423.8322 2.2698E+11
2003 636377 81075.6719 555301.3281 3.0836E+11
2004 711388 81116.17602 630271.824 3.97243E+11
2005 513796 81156.68014 432639.3199 1.87177E+11
2006 734733 81197.18426 653535.8157 4.27109E+11
2007 833436 81237.68838 752198.3116 5.65802E+11
2008 857991 81278.1925 776712.8075 6.03283E+11
2009 831924 81318.69662 750605.3034 5.63408E+11
2010 1008743 81359.20074 927383.7993 8.60041E+11
2011 1128238 81399.70486 1046838.295 1.09587E+12
2012 1165695 81440.20898 1084254.791 1.17561E+12
2013 1363930 81480.7131 1282449.287 1.64468E+12
2014 1495338 81521.21722 1413816.783 1.99888E+12
Total 17214203 2428017.224 14786185.78 1.1348E+13
Document Page
SE
615034.44
6
d) Arrivals in 2015
¿54.08046+40.50412 x
¿54.08046+40.504122015=81561721
Arrival¿ 2020
¿54.08046+40.504122020=81764241
The number of passengers arriving at the Male International Airport increases as the year
of arrival increases.
e) The correlation coefficient of the years and the number of arrivals is 0.952179. this
indicate a strong positive relationship between the two variables.
To test for the goodness of the fit, the F statistics is used. Since the value of the F
statistics is less than 0.05, it can be concluded that at a 95% level of significance the
model is appropriate in estimating the number of arrivals in a given year.
Question 3
a) Quantitative analysis
Arrivals
Mean
573806.766
7
Standard Error
68377.6164
6
Median 512936.5
Mode #N/A
Standard Deviation
374519.629
6
Coefficient of
variation
0.65269294
7
First quartile 281754.25
Second quartile 512936.5
tabler-icon-diamond-filled.svg

Paraphrase This Document

Need a fresh take? Get an instant paraphrase of this document with our AI Paraphraser
Document Page
Third quartile 807626.25
The values are in (‘000)
b) Report
Passengers arrival
From the year 1985 onwards to 2014, the number of passengers arriving in Male
international airport have been increasing annually. Using the regression of the 30 years and the
number of arrivals per annum, it’s evident that the two variables have strong positive correlation.
At least 90.66% of the difference in an annual arrival of passengers in the airport can be
explained by the different in years. From the regression output the equation
y=54.08+40.504 x can be used to predict the number of arrivals in a given year. The variable
y represents the arrivals while x the year of arrival. From this equation we note that at the y
intercept is 54,080. The coefficient of the equation is 40,504 indicating a change of time by a
single unit increases the number of passengers arriving in the airport by 40,504.
Taking a descriptive analysis of the annual passengers’ arrivals, we obtain an average
arrival of 573,806,766 per year. The arrivals had standard deviation of 374519629. Being that the
value of standard deviation is very large it can be interpreted as most values of the arrivals are
scattered far away from the mean values. For this reason, the median which is 512936500 is the
best estimate for the annual arrivals.
chevron_up_icon
1 out of 8
circle_padding
hide_on_mobile
zoom_out_icon
[object Object]