STA2300 Data Analysis Assignment: Cardiac Arrest, Gender, and Stats
VerifiedAdded on 2023/04/25
|15
|2212
|105
Homework Assignment
AI Summary
This assignment provides a comprehensive data analysis of cardiac arrest, focusing on the relationship between gender and various cardiac conditions. It includes contingency tables, conditional distributions, and tests of association to determine the dependence between gender and type of cardiac arrest. The analysis extends to patient heights, using histograms to illustrate distribution, calculating descriptive statistics like mean, median, standard deviation, and interquartile range, and discussing the impact of outliers. An experimental study on cholesterol levels is examined, identifying response variables, factors, and confounding variables. Furthermore, the assignment analyzes resting heart rates of marathon runners using probability calculations and explores the relationship between cardiac index and hemoglobin levels through scatter plots, correlation coefficients, and regression analysis. Finally, it applies the binomial model to analyze the probability of patients experiencing side effects from a drug, demonstrating statistical techniques and interpretations relevant to healthcare data. Desklib offers this solution and many more to help students excel.
Running Head: STA2300 DATA ANALYSIS
STA2300 Data Analysis
Name of the Student
Name of the University
Student ID
STA2300 Data Analysis
Name of the Student
Name of the University
Student ID
Paraphrase This Document
Need a fresh take? Get an instant paraphrase of this document with our AI Paraphraser
1STA2300 DATA ANALYSIS
Table of Contents
Answer 1....................................................................................................................................3
Part A.....................................................................................................................................3
Part B......................................................................................................................................3
Part C......................................................................................................................................3
Part D.....................................................................................................................................4
Answer 2....................................................................................................................................5
Part A.....................................................................................................................................5
Part B......................................................................................................................................5
Part C......................................................................................................................................5
Part D.....................................................................................................................................6
Part E......................................................................................................................................6
Answer 3....................................................................................................................................7
Part A.....................................................................................................................................7
Part B......................................................................................................................................7
Part C......................................................................................................................................7
Part D.....................................................................................................................................7
Answer 4....................................................................................................................................8
Part A.....................................................................................................................................8
Part B......................................................................................................................................8
Part C......................................................................................................................................8
2STA2300 DATA ANALYSIS
Part D.....................................................................................................................................9
Answer 5..................................................................................................................................10
Part A...................................................................................................................................10
Part B....................................................................................................................................10
Part C....................................................................................................................................10
Part D...................................................................................................................................10
Part E....................................................................................................................................11
Part F....................................................................................................................................11
Part G...................................................................................................................................12
Answer 6..................................................................................................................................13
Part A...................................................................................................................................13
Part B....................................................................................................................................13
Part C....................................................................................................................................13
Part D...................................................................................................................................13
Part E....................................................................................................................................14
⊘ This is a preview!⊘
Do you want full access?
Subscribe today to unlock all pages.
Trusted by 1+ million students worldwide
3STA2300 DATA ANALYSIS
Answer 1
This study is conducted to understand the if there is any association between the type
of Cardiac arrest and the gender of the patients. In order to understand that the following
analysis has been conducted.
Part A
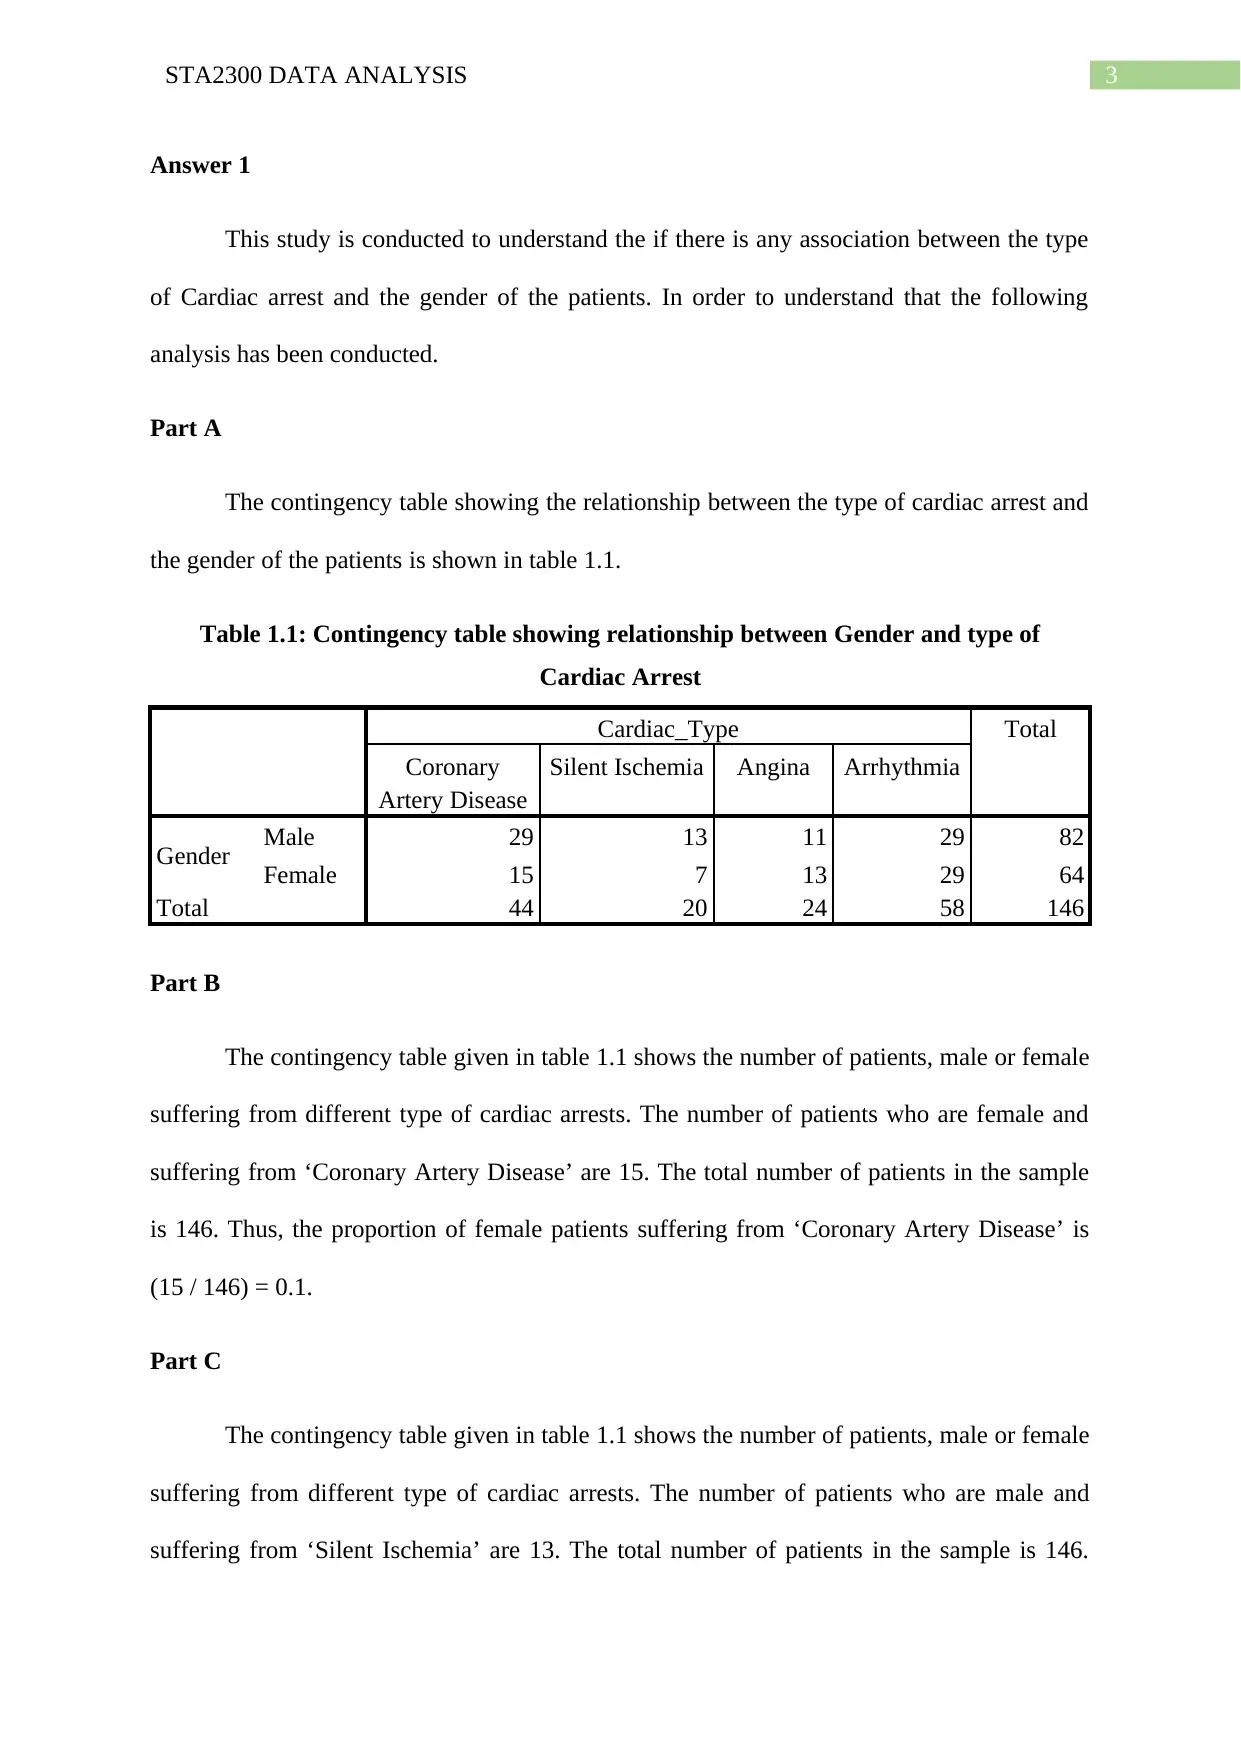
The contingency table showing the relationship between the type of cardiac arrest and
the gender of the patients is shown in table 1.1.
Table 1.1: Contingency table showing relationship between Gender and type of
Cardiac Arrest
Cardiac_Type Total
Coronary
Artery Disease
Silent Ischemia Angina Arrhythmia
Gender Male 29 13 11 29 82
Female 15 7 13 29 64
Total 44 20 24 58 146
Part B
The contingency table given in table 1.1 shows the number of patients, male or female
suffering from different type of cardiac arrests. The number of patients who are female and
suffering from ‘Coronary Artery Disease’ are 15. The total number of patients in the sample
is 146. Thus, the proportion of female patients suffering from ‘Coronary Artery Disease’ is
(15 / 146) = 0.1.
Part C
The contingency table given in table 1.1 shows the number of patients, male or female
suffering from different type of cardiac arrests. The number of patients who are male and
suffering from ‘Silent Ischemia’ are 13. The total number of patients in the sample is 146.
Answer 1
This study is conducted to understand the if there is any association between the type
of Cardiac arrest and the gender of the patients. In order to understand that the following
analysis has been conducted.
Part A
The contingency table showing the relationship between the type of cardiac arrest and
the gender of the patients is shown in table 1.1.
Table 1.1: Contingency table showing relationship between Gender and type of
Cardiac Arrest
Cardiac_Type Total
Coronary
Artery Disease
Silent Ischemia Angina Arrhythmia
Gender Male 29 13 11 29 82
Female 15 7 13 29 64
Total 44 20 24 58 146
Part B
The contingency table given in table 1.1 shows the number of patients, male or female
suffering from different type of cardiac arrests. The number of patients who are female and
suffering from ‘Coronary Artery Disease’ are 15. The total number of patients in the sample
is 146. Thus, the proportion of female patients suffering from ‘Coronary Artery Disease’ is
(15 / 146) = 0.1.
Part C
The contingency table given in table 1.1 shows the number of patients, male or female
suffering from different type of cardiac arrests. The number of patients who are male and
suffering from ‘Silent Ischemia’ are 13. The total number of patients in the sample is 146.
Paraphrase This Document
Need a fresh take? Get an instant paraphrase of this document with our AI Paraphraser
4STA2300 DATA ANALYSIS
Thus, the proportion of female patients suffering from ‘Coronary Artery Disease’ is (13 /
146) = 0.09.
Part D
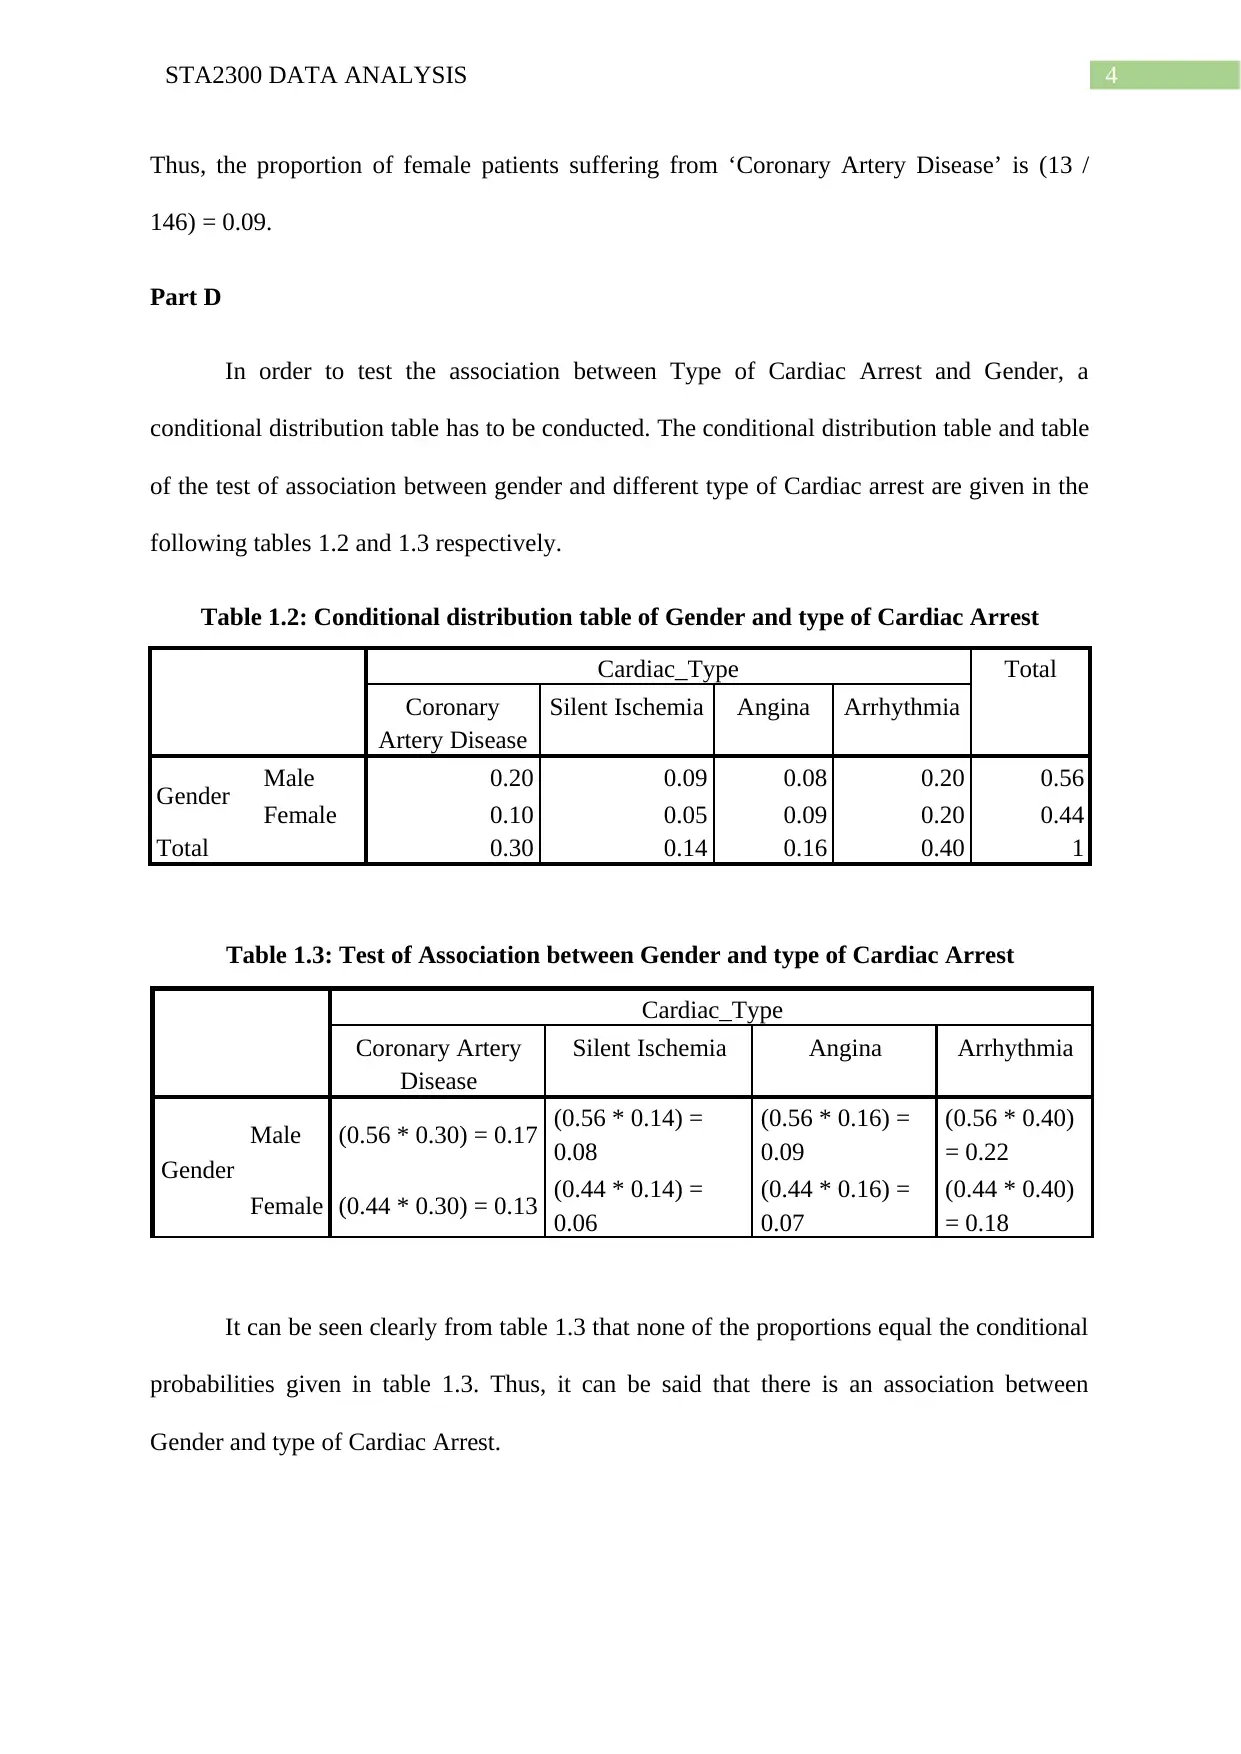
In order to test the association between Type of Cardiac Arrest and Gender, a
conditional distribution table has to be conducted. The conditional distribution table and table
of the test of association between gender and different type of Cardiac arrest are given in the
following tables 1.2 and 1.3 respectively.
Table 1.2: Conditional distribution table of Gender and type of Cardiac Arrest
Cardiac_Type Total
Coronary
Artery Disease
Silent Ischemia Angina Arrhythmia
Gender Male 0.20 0.09 0.08 0.20 0.56
Female 0.10 0.05 0.09 0.20 0.44
Total 0.30 0.14 0.16 0.40 1
Table 1.3: Test of Association between Gender and type of Cardiac Arrest
Cardiac_Type
Coronary Artery
Disease
Silent Ischemia Angina Arrhythmia
Gender
Male (0.56 * 0.30) = 0.17 (0.56 * 0.14) =
0.08
(0.56 * 0.16) =
0.09
(0.56 * 0.40)
= 0.22
Female (0.44 * 0.30) = 0.13 (0.44 * 0.14) =
0.06
(0.44 * 0.16) =
0.07
(0.44 * 0.40)
= 0.18
It can be seen clearly from table 1.3 that none of the proportions equal the conditional
probabilities given in table 1.3. Thus, it can be said that there is an association between
Gender and type of Cardiac Arrest.
Thus, the proportion of female patients suffering from ‘Coronary Artery Disease’ is (13 /
146) = 0.09.
Part D
In order to test the association between Type of Cardiac Arrest and Gender, a
conditional distribution table has to be conducted. The conditional distribution table and table
of the test of association between gender and different type of Cardiac arrest are given in the
following tables 1.2 and 1.3 respectively.
Table 1.2: Conditional distribution table of Gender and type of Cardiac Arrest
Cardiac_Type Total
Coronary
Artery Disease
Silent Ischemia Angina Arrhythmia
Gender Male 0.20 0.09 0.08 0.20 0.56
Female 0.10 0.05 0.09 0.20 0.44
Total 0.30 0.14 0.16 0.40 1
Table 1.3: Test of Association between Gender and type of Cardiac Arrest
Cardiac_Type
Coronary Artery
Disease
Silent Ischemia Angina Arrhythmia
Gender
Male (0.56 * 0.30) = 0.17 (0.56 * 0.14) =
0.08
(0.56 * 0.16) =
0.09
(0.56 * 0.40)
= 0.22
Female (0.44 * 0.30) = 0.13 (0.44 * 0.14) =
0.06
(0.44 * 0.16) =
0.07
(0.44 * 0.40)
= 0.18
It can be seen clearly from table 1.3 that none of the proportions equal the conditional
probabilities given in table 1.3. Thus, it can be said that there is an association between
Gender and type of Cardiac Arrest.
5STA2300 DATA ANALYSIS
Answer 2
Part A
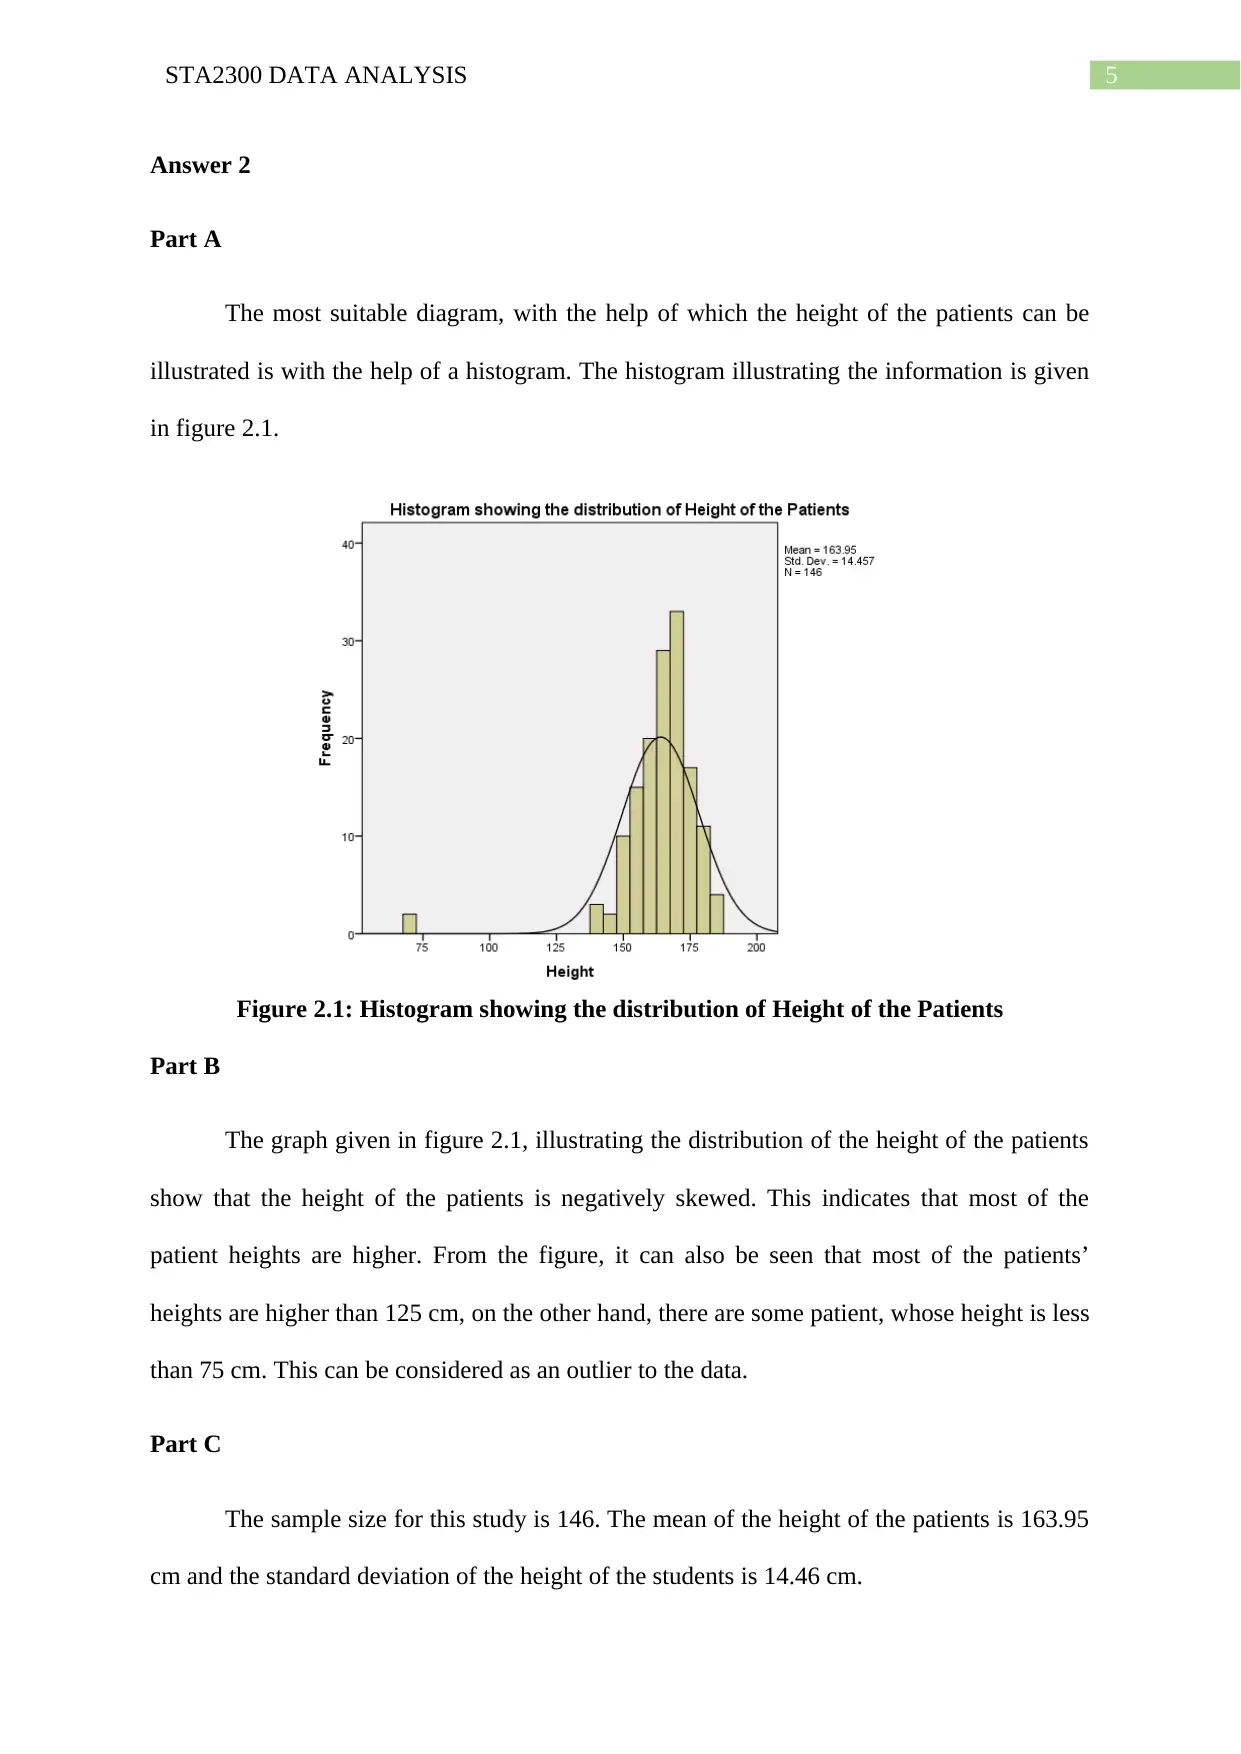
The most suitable diagram, with the help of which the height of the patients can be
illustrated is with the help of a histogram. The histogram illustrating the information is given
in figure 2.1.
Figure 2.1: Histogram showing the distribution of Height of the Patients
Part B
The graph given in figure 2.1, illustrating the distribution of the height of the patients
show that the height of the patients is negatively skewed. This indicates that most of the
patient heights are higher. From the figure, it can also be seen that most of the patients’
heights are higher than 125 cm, on the other hand, there are some patient, whose height is less
than 75 cm. This can be considered as an outlier to the data.
Part C
The sample size for this study is 146. The mean of the height of the patients is 163.95
cm and the standard deviation of the height of the students is 14.46 cm.
Answer 2
Part A
The most suitable diagram, with the help of which the height of the patients can be
illustrated is with the help of a histogram. The histogram illustrating the information is given
in figure 2.1.
Figure 2.1: Histogram showing the distribution of Height of the Patients
Part B
The graph given in figure 2.1, illustrating the distribution of the height of the patients
show that the height of the patients is negatively skewed. This indicates that most of the
patient heights are higher. From the figure, it can also be seen that most of the patients’
heights are higher than 125 cm, on the other hand, there are some patient, whose height is less
than 75 cm. This can be considered as an outlier to the data.
Part C
The sample size for this study is 146. The mean of the height of the patients is 163.95
cm and the standard deviation of the height of the students is 14.46 cm.
⊘ This is a preview!⊘
Do you want full access?
Subscribe today to unlock all pages.
Trusted by 1+ million students worldwide
6STA2300 DATA ANALYSIS
Part D
The median of the height of the patients in this study is 165 cm. The first quartile of
the height of the patients is 160 cm and the third quartile of the height of the patients is 171
cm. Thus, the inter quartile range (IQR) of the distribution of heights of the patients for this
study is (171 – 160) cm = 11 cm.
Part E
It has already been observed that there is an outlier to the data. Hence by comparing
the results obtained from Parts C and D, it can be seen that the median is providing a more
accurate measure of the centre and the IQR has been providing a more accurate measure of
spread. The mean and the standard deviation of a data are affected by the presence of outliers.
The presence of outliers does not affect the median and the quartiles to a data. Thus, Median
and IQR are a better measure of centre and spread to a data.
Paraphrase This Document
Need a fresh take? Get an instant paraphrase of this document with our AI Paraphraser
7STA2300 DATA ANALYSIS
Answer 3
Part A
From the extract above. It can be said that the study involved is an experimental study
as the participants were subjected to two different types of treatments and the outcome of the
treatment was just studied to draw an inference.
Part B
i) The response variable in this study is the cholesterol level.
ii) The factor in this study is the juice and it has two different levels – the two types of
juice.
iii) The sample size for this research is 19.
Part C
The experiment conducted is random, as the 19 participants are randomly assigned to
two different treatments. The treatments have been replicated as well. Thus, the first two
principles of experimental design have been used. The design is also controlled as the
experiment is conducted by creating different blocks and balancing the treatments
accordingly. Thus, it can be said that the four principles of experimental design have been
satisfied.
Part D
A variable, that is used to mask or distort a relationship between the variables that are
to be measured in an experiment is known as a confounding variable. In this study,
application of the two different kinds of juices has not shown any significant difference in the
cholesterol level. Thus, the treatment effects are the confounding variables.
8STA2300 DATA ANALYSIS
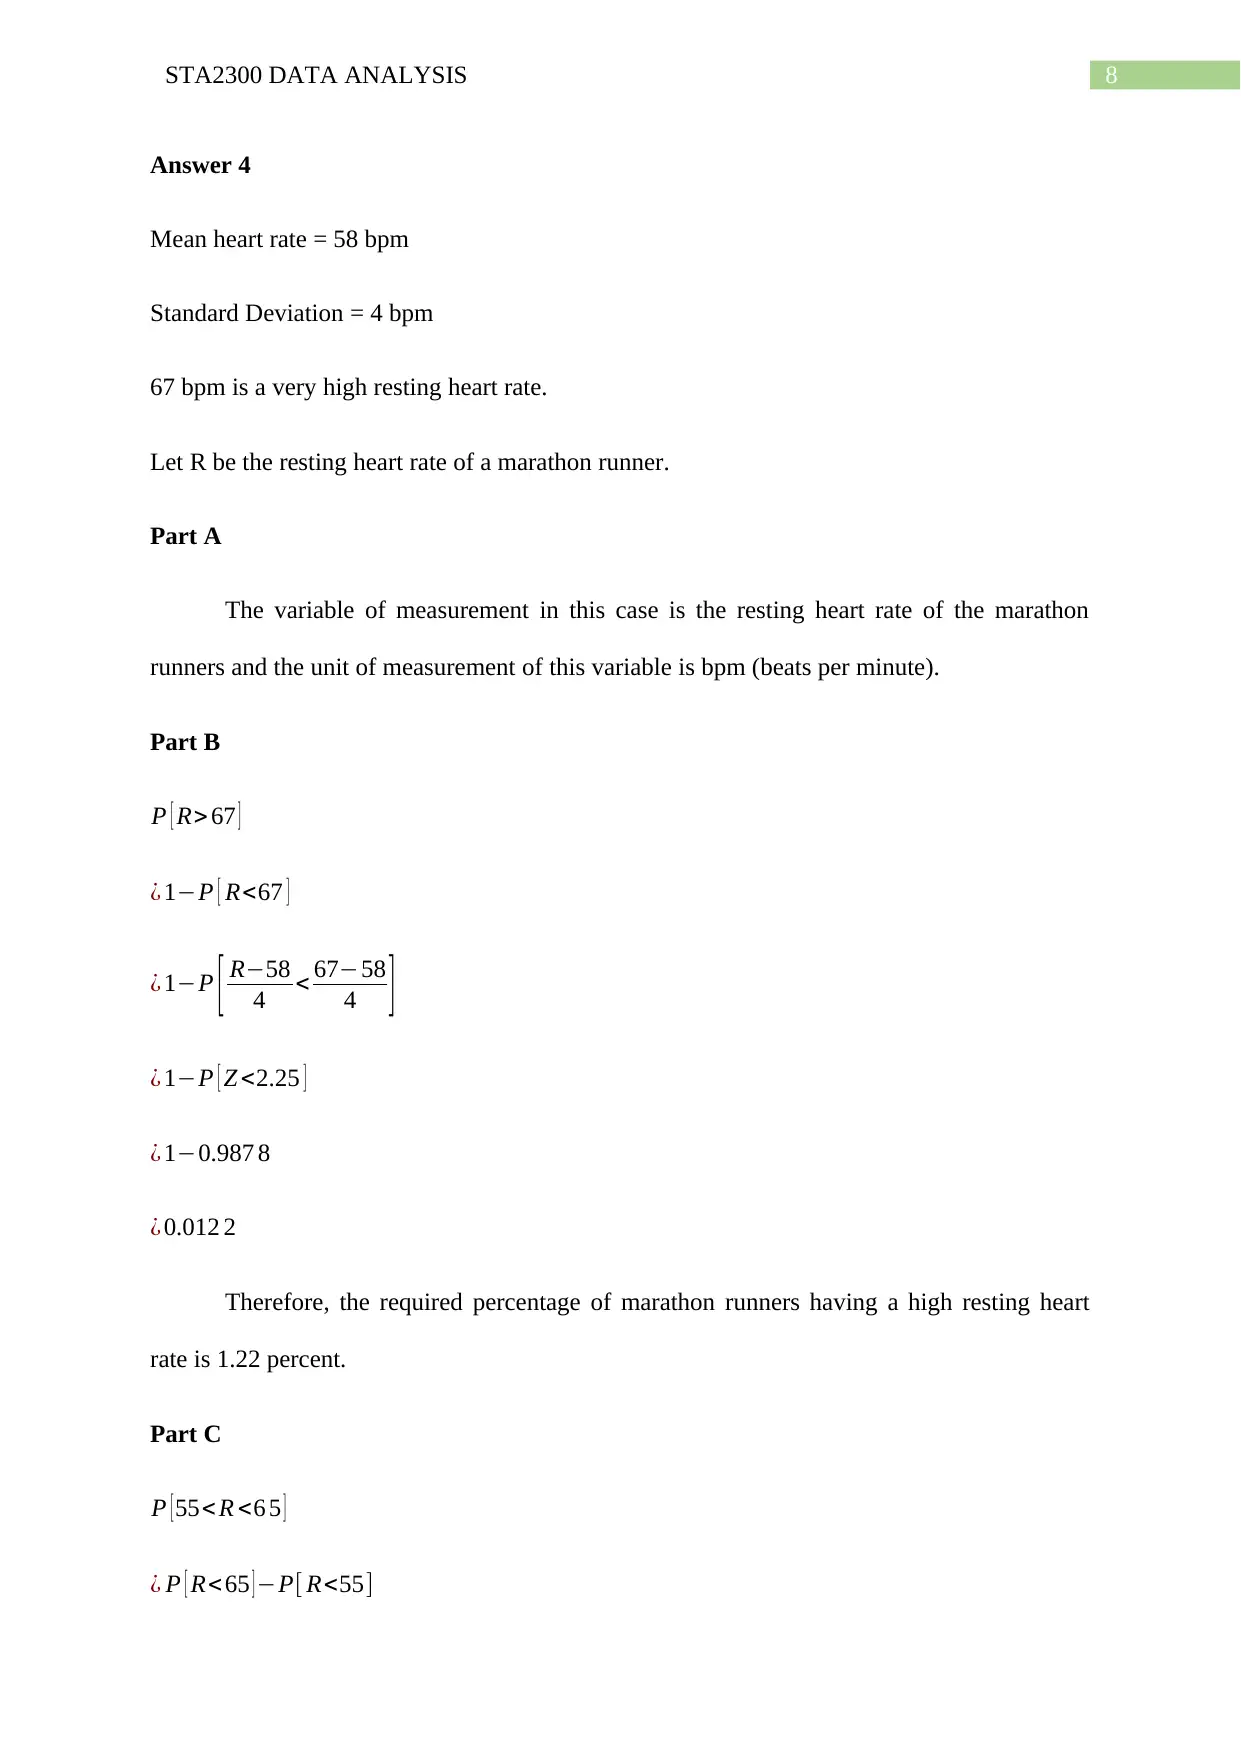
Answer 4
Mean heart rate = 58 bpm
Standard Deviation = 4 bpm
67 bpm is a very high resting heart rate.
Let R be the resting heart rate of a marathon runner.
Part A
The variable of measurement in this case is the resting heart rate of the marathon
runners and the unit of measurement of this variable is bpm (beats per minute).
Part B
P [ R> 67 ]
¿ 1−P [ R<67 ]
¿ 1−P [ R−58
4 < 67−58
4 ]
¿ 1−P [ Z <2.25 ]
¿ 1−0.987 8
¿ 0.012 2
Therefore, the required percentage of marathon runners having a high resting heart
rate is 1.22 percent.
Part C
P [ 55< R <6 5 ]
¿ P [ R<65 ] −P[ R<55]
⊘ This is a preview!⊘
Do you want full access?
Subscribe today to unlock all pages.
Trusted by 1+ million students worldwide
9STA2300 DATA ANALYSIS
¿ P [ R−58
4 <65−58
4 ]−P [ R−58
4 < 55−58
4 ]
¿ [ Z <1.75 ]−P [ Z <−0.75 ]
¿ 0.9599−0.2266
¿ 0. 7333
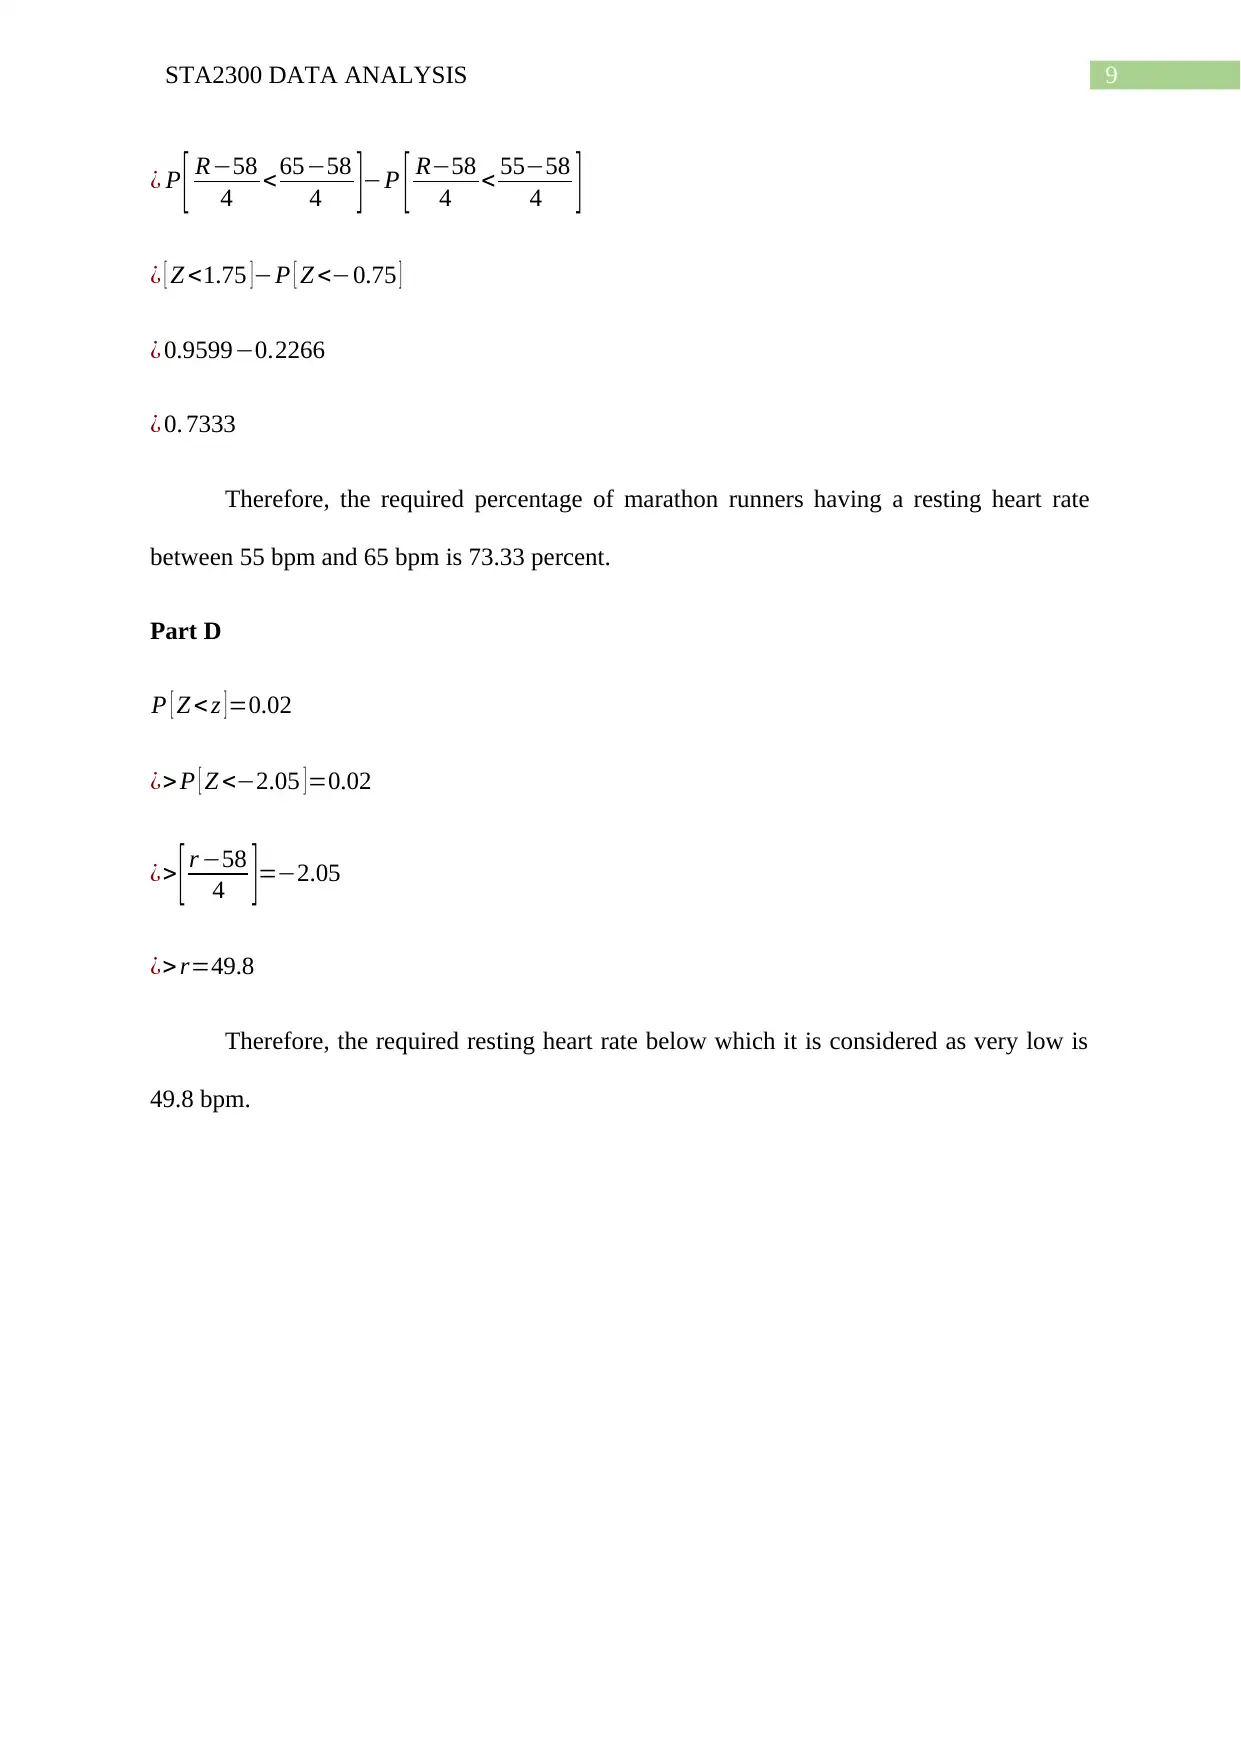
Therefore, the required percentage of marathon runners having a resting heart rate
between 55 bpm and 65 bpm is 73.33 percent.
Part D
P [ Z < z ] =0.02
¿> P [ Z <−2.05 ]=0.02
¿> [ r −58
4 ]=−2.05
¿> r=49.8
Therefore, the required resting heart rate below which it is considered as very low is
49.8 bpm.
¿ P [ R−58
4 <65−58
4 ]−P [ R−58
4 < 55−58
4 ]
¿ [ Z <1.75 ]−P [ Z <−0.75 ]
¿ 0.9599−0.2266
¿ 0. 7333
Therefore, the required percentage of marathon runners having a resting heart rate
between 55 bpm and 65 bpm is 73.33 percent.
Part D
P [ Z < z ] =0.02
¿> P [ Z <−2.05 ]=0.02
¿> [ r −58
4 ]=−2.05
¿> r=49.8
Therefore, the required resting heart rate below which it is considered as very low is
49.8 bpm.
Paraphrase This Document
Need a fresh take? Get an instant paraphrase of this document with our AI Paraphraser
10STA2300 DATA ANALYSIS
Answer 5
Part A
The two variables that will be included in the analysis are cardiac index and the
haemoglobin level of the patients who died of cardiac arrest after being admitted to the
hospital. Both the variables are continuous variables.
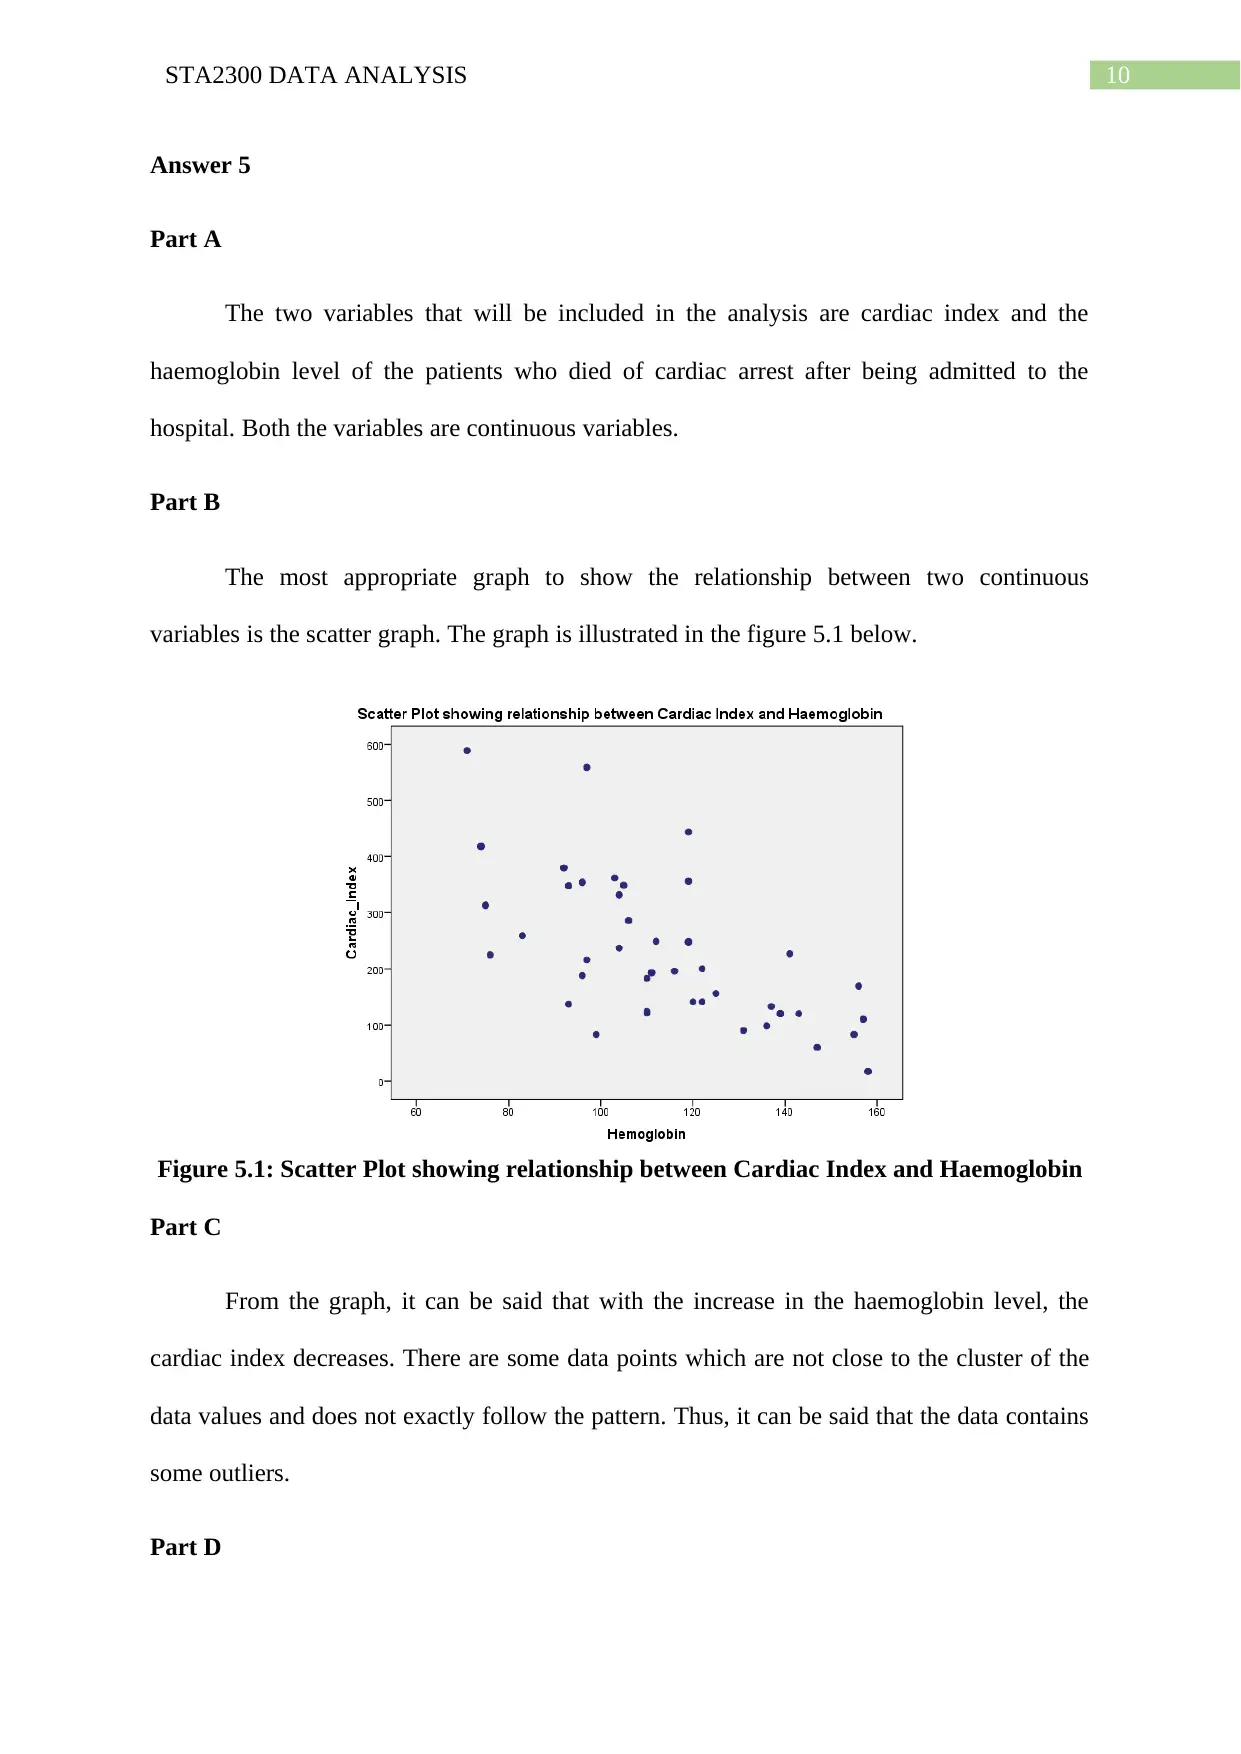
Part B
The most appropriate graph to show the relationship between two continuous
variables is the scatter graph. The graph is illustrated in the figure 5.1 below.
Figure 5.1: Scatter Plot showing relationship between Cardiac Index and Haemoglobin
Part C
From the graph, it can be said that with the increase in the haemoglobin level, the
cardiac index decreases. There are some data points which are not close to the cluster of the
data values and does not exactly follow the pattern. Thus, it can be said that the data contains
some outliers.
Part D
Answer 5
Part A
The two variables that will be included in the analysis are cardiac index and the
haemoglobin level of the patients who died of cardiac arrest after being admitted to the
hospital. Both the variables are continuous variables.
Part B
The most appropriate graph to show the relationship between two continuous
variables is the scatter graph. The graph is illustrated in the figure 5.1 below.
Figure 5.1: Scatter Plot showing relationship between Cardiac Index and Haemoglobin
Part C
From the graph, it can be said that with the increase in the haemoglobin level, the
cardiac index decreases. There are some data points which are not close to the cluster of the
data values and does not exactly follow the pattern. Thus, it can be said that the data contains
some outliers.
Part D
11STA2300 DATA ANALYSIS
An appropriate statistic that will help in determining the strength and the direction of
the relationship between these two variables is the correlation coefficient. The correlation
coefficient between cardiac index and haemoglobin content of the patients who died from
cardiac arrest is found to be – 0.708. The value of the correlation coefficient is quite close to
– 1. Thus, it can be said that there is a strong negative relationship between these two
variables.
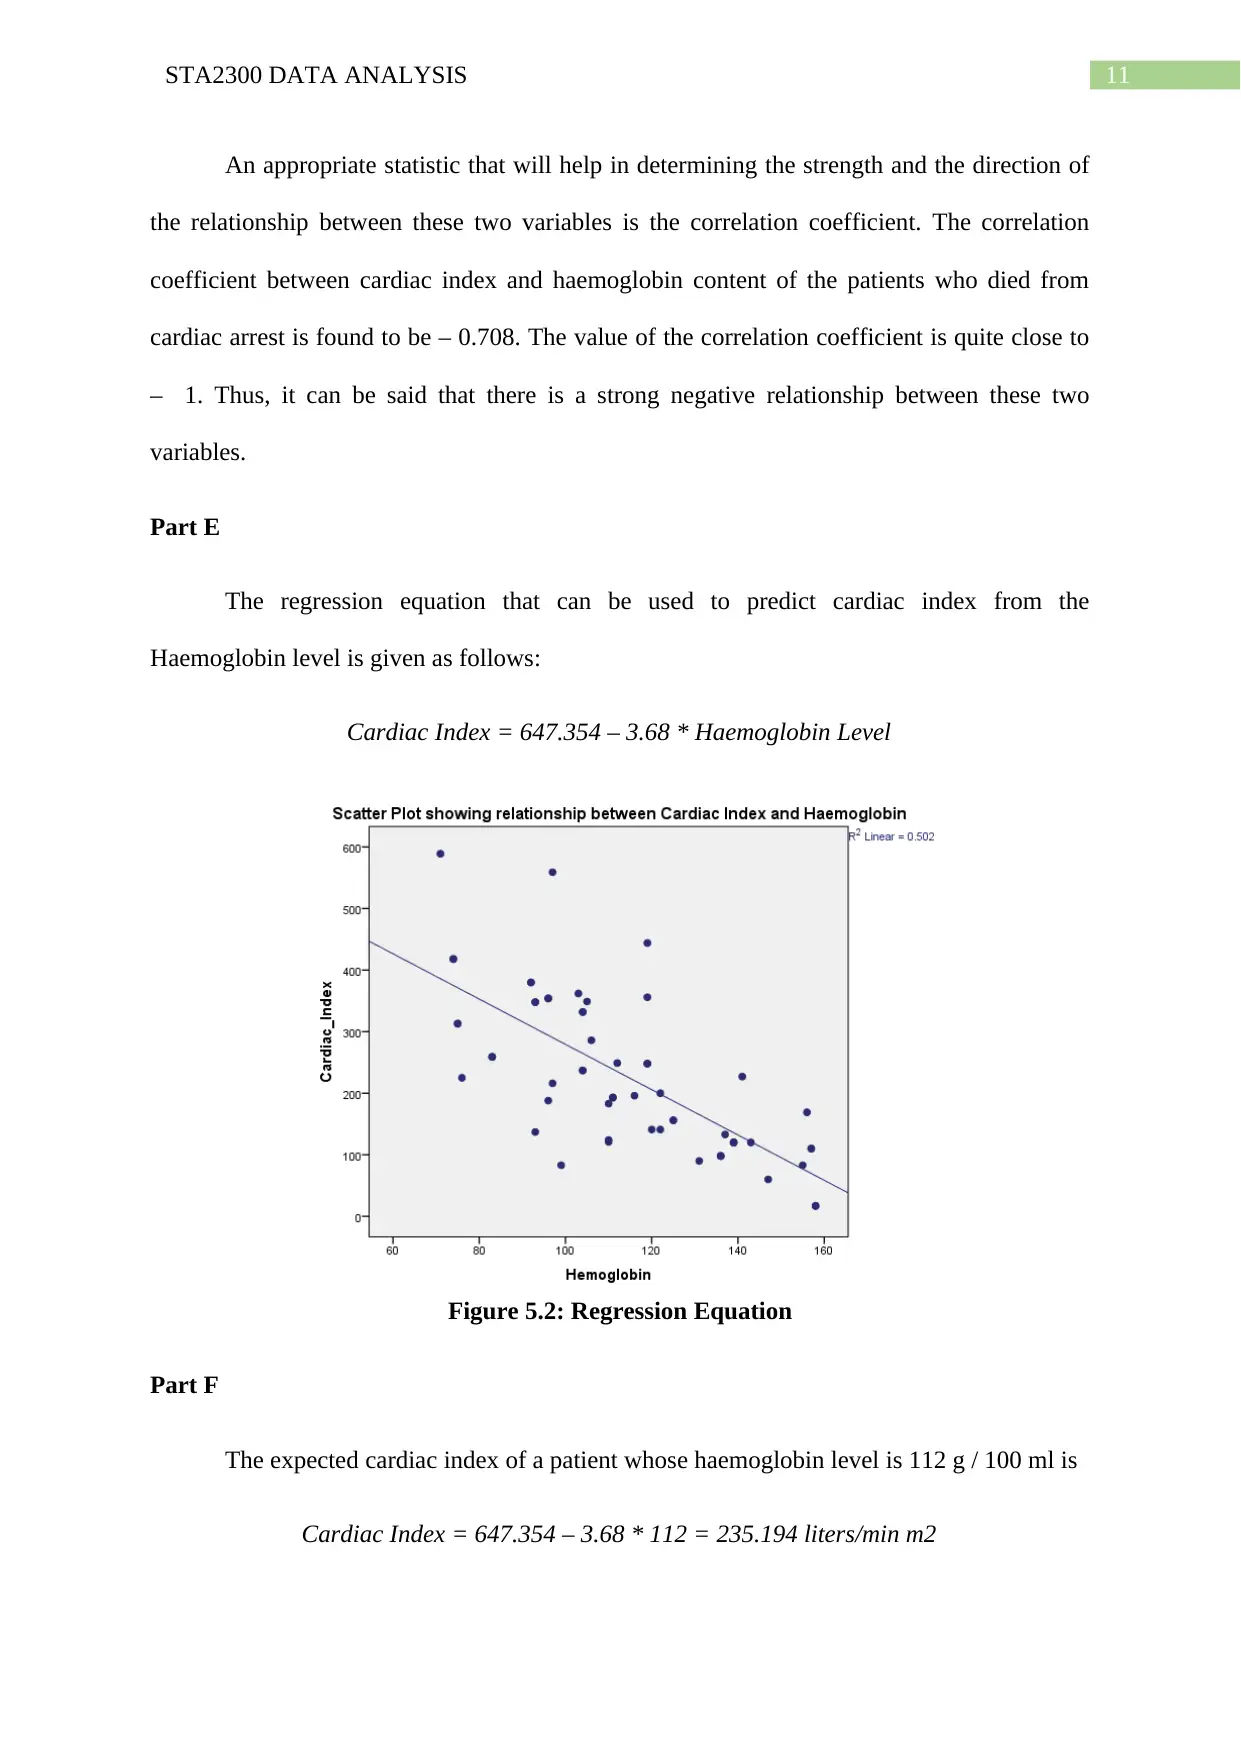
Part E
The regression equation that can be used to predict cardiac index from the
Haemoglobin level is given as follows:
Cardiac Index = 647.354 – 3.68 * Haemoglobin Level
Figure 5.2: Regression Equation
Part F
The expected cardiac index of a patient whose haemoglobin level is 112 g / 100 ml is
Cardiac Index = 647.354 – 3.68 * 112 = 235.194 liters/min m2
An appropriate statistic that will help in determining the strength and the direction of
the relationship between these two variables is the correlation coefficient. The correlation
coefficient between cardiac index and haemoglobin content of the patients who died from
cardiac arrest is found to be – 0.708. The value of the correlation coefficient is quite close to
– 1. Thus, it can be said that there is a strong negative relationship between these two
variables.
Part E
The regression equation that can be used to predict cardiac index from the
Haemoglobin level is given as follows:
Cardiac Index = 647.354 – 3.68 * Haemoglobin Level
Figure 5.2: Regression Equation
Part F
The expected cardiac index of a patient whose haemoglobin level is 112 g / 100 ml is
Cardiac Index = 647.354 – 3.68 * 112 = 235.194 liters/min m2
⊘ This is a preview!⊘
Do you want full access?
Subscribe today to unlock all pages.
Trusted by 1+ million students worldwide
1 out of 15

Your All-in-One AI-Powered Toolkit for Academic Success.
+13062052269
info@desklib.com
Available 24*7 on WhatsApp / Email
![[object Object]](/_next/static/media/star-bottom.7253800d.svg)
Unlock your academic potential
Copyright © 2020–2026 A2Z Services. All Rights Reserved. Developed and managed by ZUCOL.