STA304H1F Winter 2020 Assignment 2: Statistical Sampling Analysis

Verified

Added on  2022/08/29

|5
|1063
|23
Homework Assignment
AI Summary
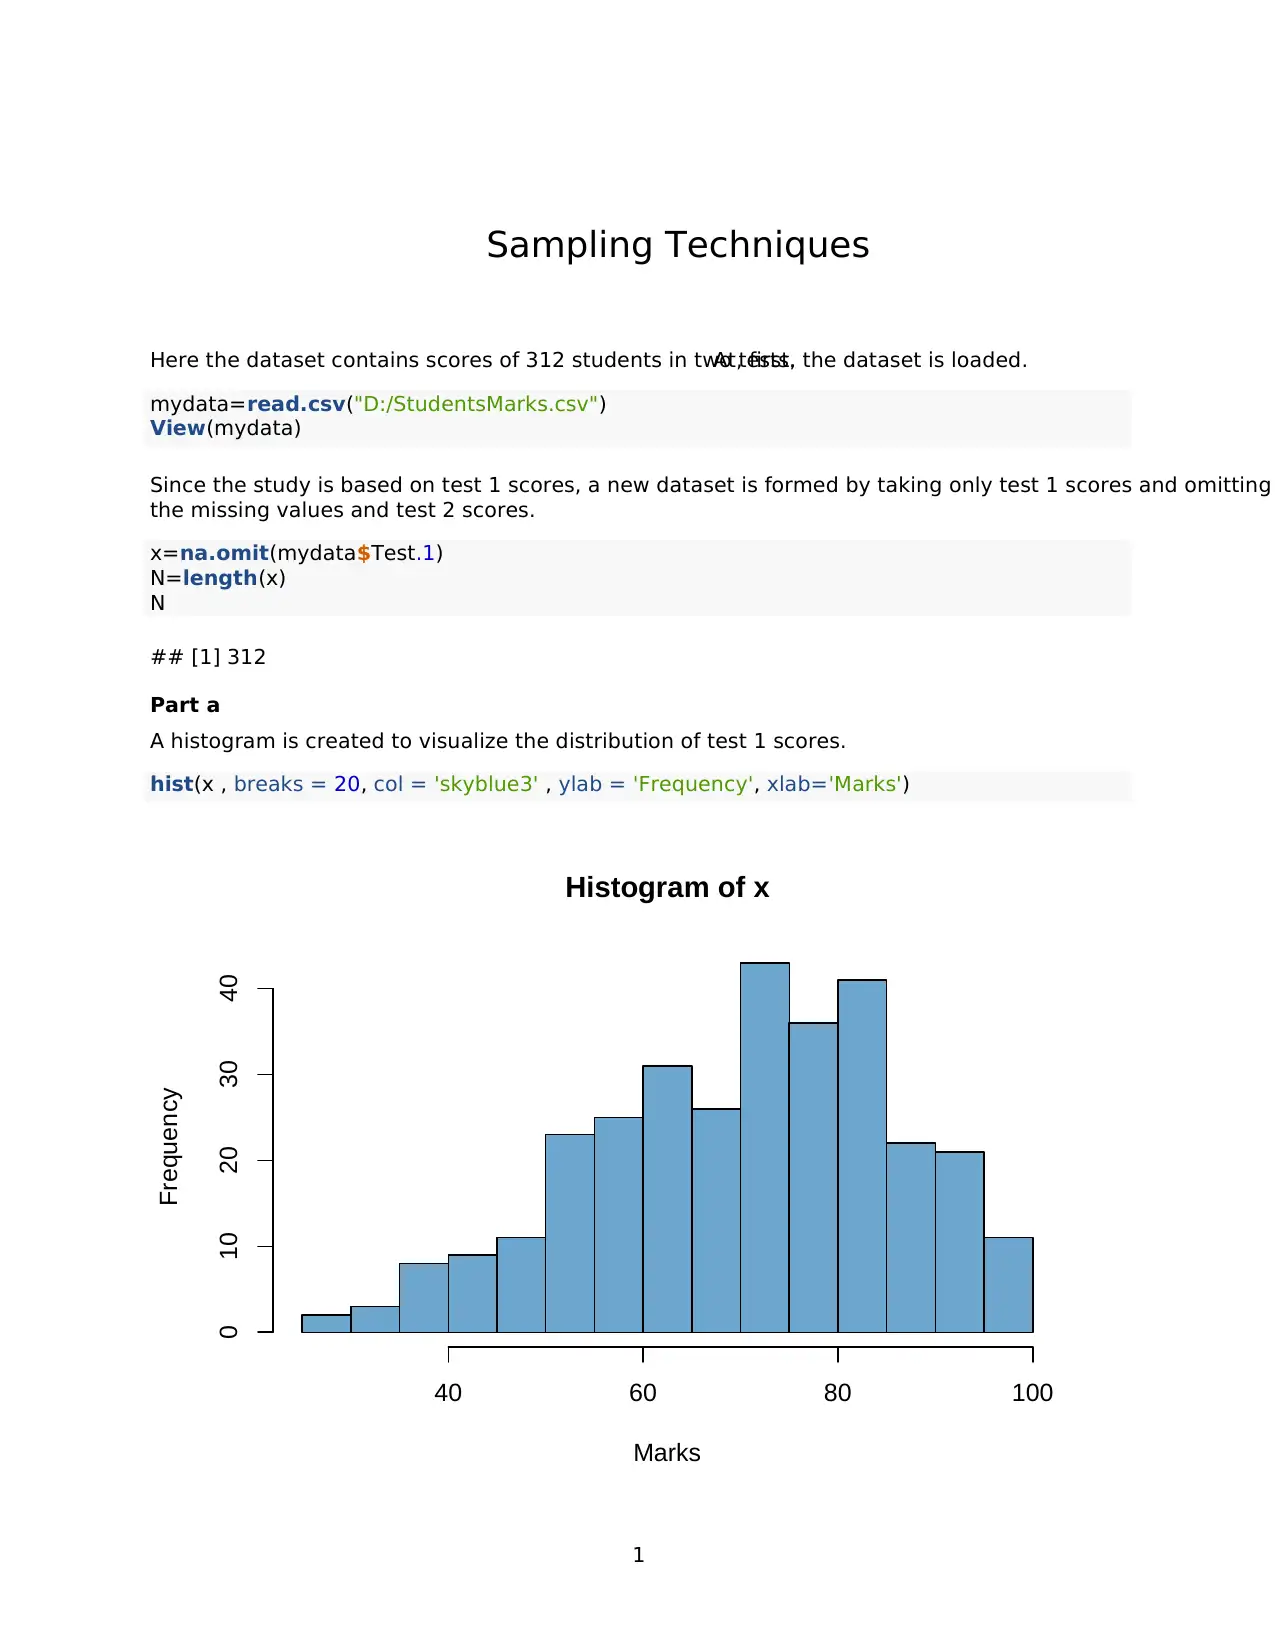
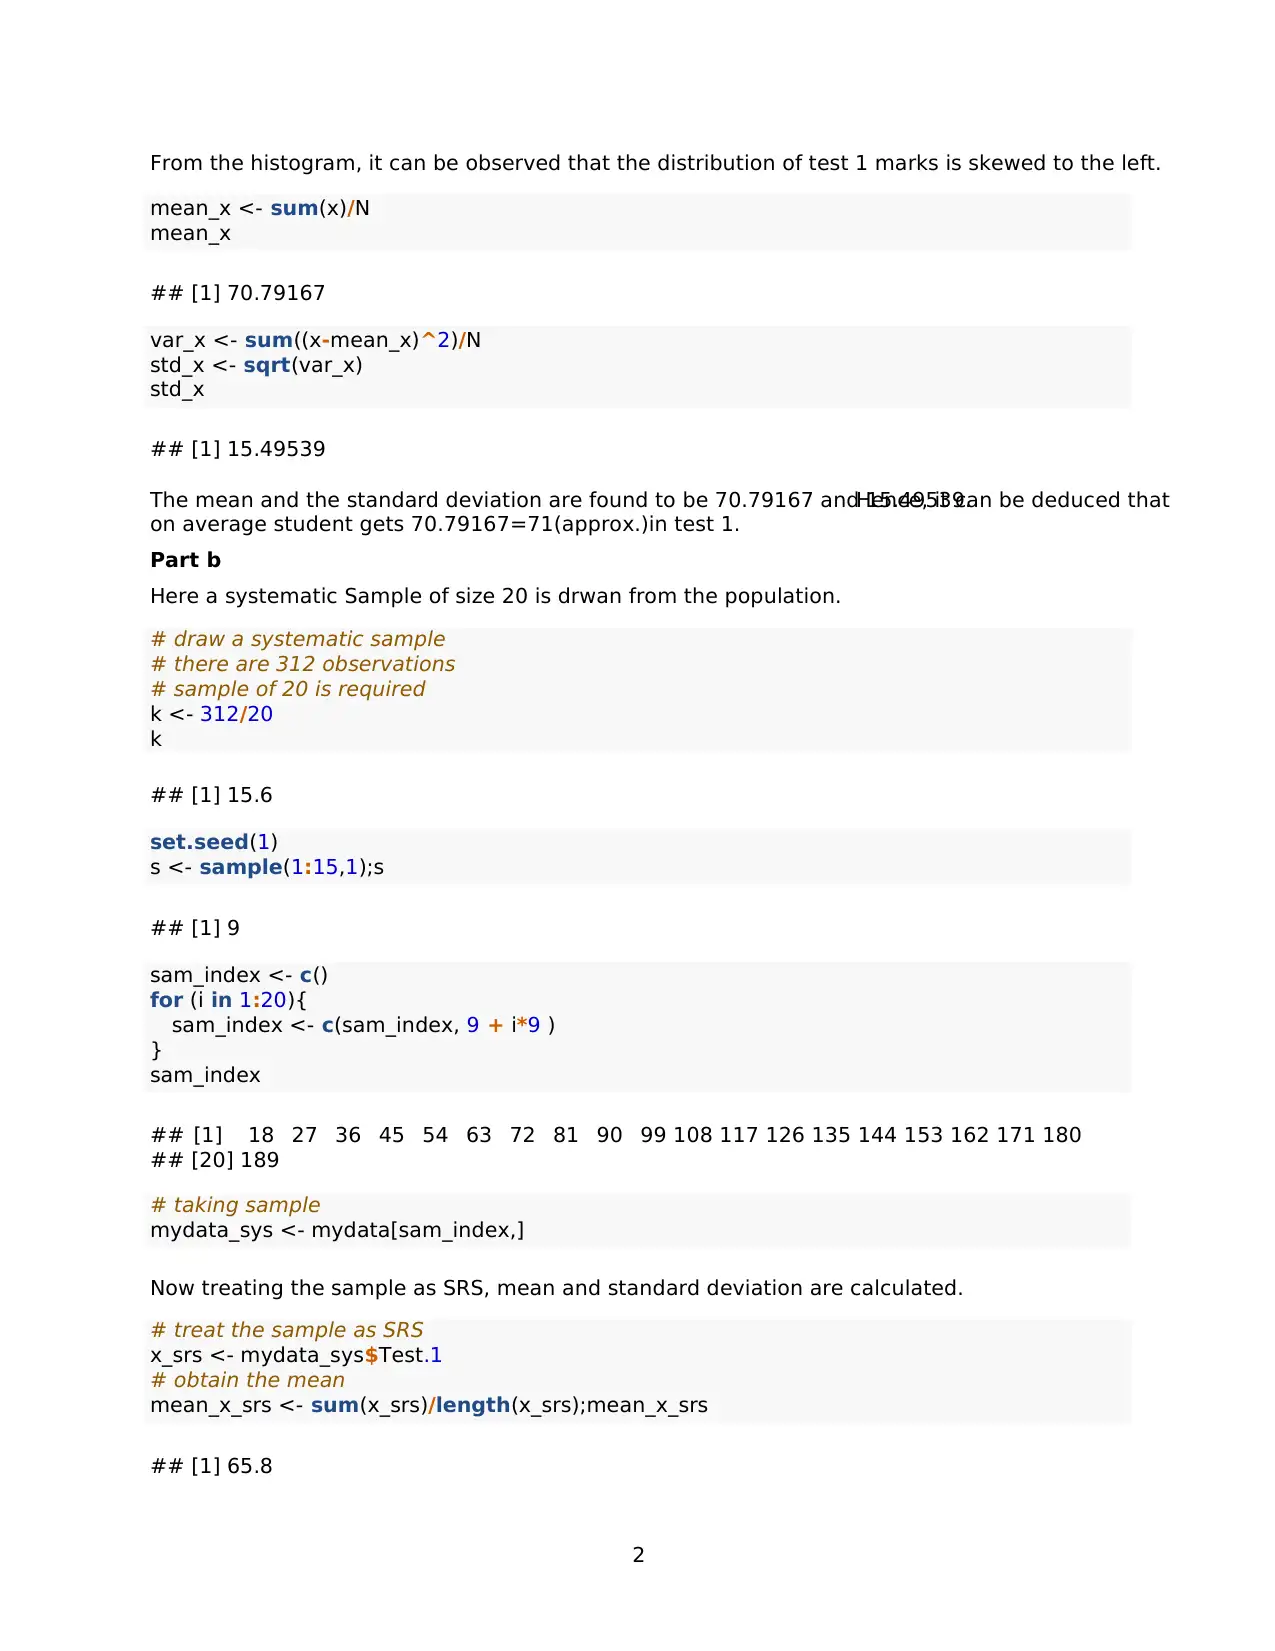
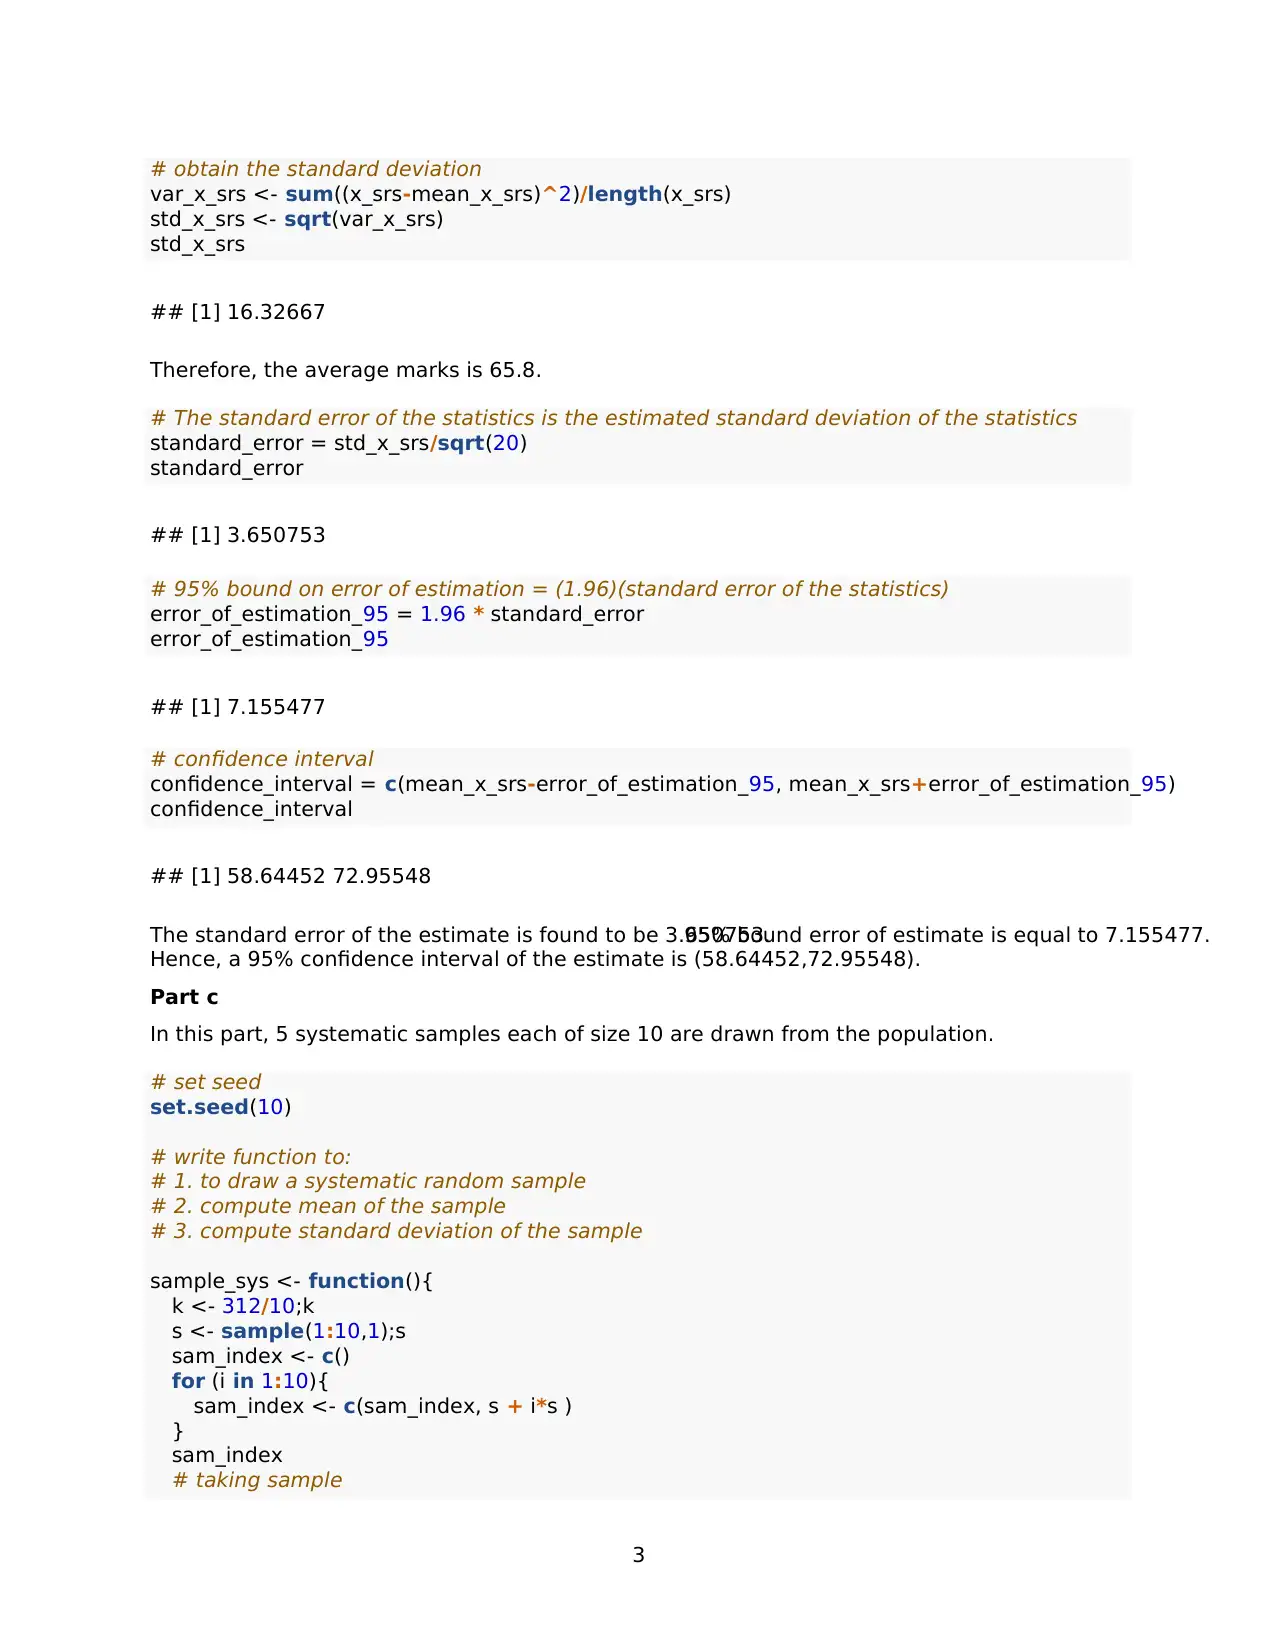
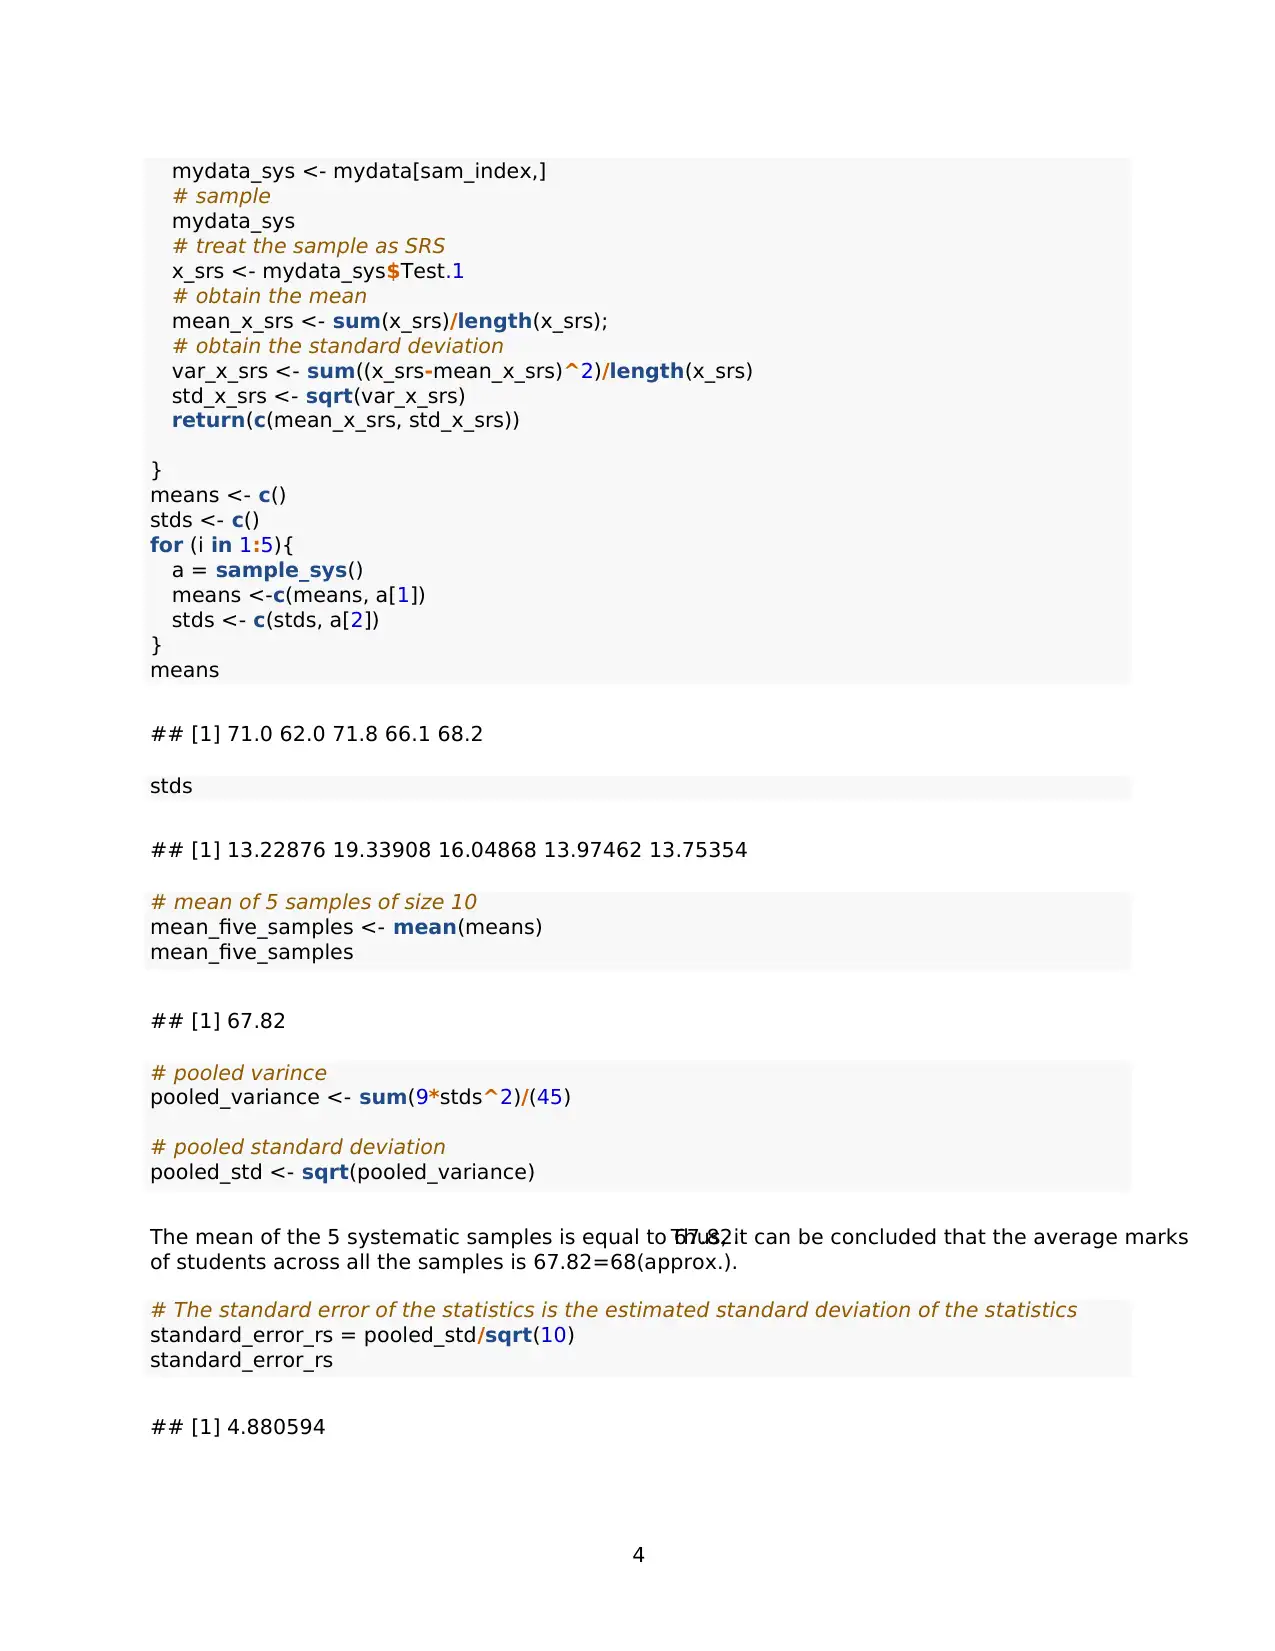
This document presents a complete solution to a statistics assignment (STA304) focusing on sampling techniques. The assignment analyzes a dataset of student test scores, applying various sampling methods. The solution begins by constructing a histogram to visualize the distribution of test scores and calculating the mean and standard deviation. It then implements systematic sampling, calculating the mean, standard deviation, standard error, and constructing a 95% confidence interval. Further, the solution draws five repeated systematic samples, calculates the mean and standard deviation for each, and determines the pooled variance, standard error, and 95% confidence interval. The document concludes by comparing the two sampling methods and arguing for the appropriateness of the repeated sampling technique in this study. All the analysis and calculations are performed using R code, which is provided within the solution.
Document Page
Sampling Techniques
Here the dataset contains scores of 312 students in two tests.At, first, the dataset is loaded.
mydata=read.csv("D:/StudentsMarks.csv")
View(mydata)
Since the study is based on test 1 scores, a new dataset is formed by taking only test 1 scores and omitting
the missing values and test 2 scores.
x=na.omit(mydata$Test.1)
N=length(x)
N
## [1] 312
Part a
A histogram is created to visualize the distribution of test 1 scores.
hist(x , breaks = 20, col = 'skyblue3' , ylab = 'Frequency', xlab='Marks')
Histogram of x
Marks
Frequency
40 60 80 100
0 10 20 30 40
1
tabler-icon-diamond-filled.svg

Paraphrase This Document

Need a fresh take? Get an instant paraphrase of this document with our AI Paraphraser
Document Page
From the histogram, it can be observed that the distribution of test 1 marks is skewed to the left.
mean_x <- sum(x)/N
mean_x
## [1] 70.79167
var_x <- sum((x-mean_x)^2)/N
std_x <- sqrt(var_x)
std_x
## [1] 15.49539
The mean and the standard deviation are found to be 70.79167 and 15.49539.Hence, it can be deduced that
on average student gets 70.79167=71(approx.)in test 1.
Part b
Here a systematic Sample of size 20 is drwan from the population.
# draw a systematic sample
# there are 312 observations
# sample of 20 is required
k <- 312/20
k
## [1] 15.6
set.seed(1)
s <- sample(1:15,1);s
## [1] 9
sam_index <- c()
for (i in 1:20){
sam_index <- c(sam_index, 9 + i*9 )
}
sam_index
## [1] 18 27 36 45 54 63 72 81 90 99 108 117 126 135 144 153 162 171 180
## [20] 189
# taking sample
mydata_sys <- mydata[sam_index,]
Now treating the sample as SRS, mean and standard deviation are calculated.
# treat the sample as SRS
x_srs <- mydata_sys$Test.1
# obtain the mean
mean_x_srs <- sum(x_srs)/length(x_srs);mean_x_srs
## [1] 65.8
2
Document Page
# obtain the standard deviation
var_x_srs <- sum((x_srs-mean_x_srs)^2)/length(x_srs)
std_x_srs <- sqrt(var_x_srs)
std_x_srs
## [1] 16.32667
Therefore, the average marks is 65.8.
# The standard error of the statistics is the estimated standard deviation of the statistics
standard_error = std_x_srs/sqrt(20)
standard_error
## [1] 3.650753
# 95% bound on error of estimation = (1.96)(standard error of the statistics)
error_of_estimation_95 = 1.96 * standard_error
error_of_estimation_95
## [1] 7.155477
# confidence interval
confidence_interval = c(mean_x_srs-error_of_estimation_95, mean_x_srs+error_of_estimation_95)
confidence_interval
## [1] 58.64452 72.95548
The standard error of the estimate is found to be 3.650753.95% bound error of estimate is equal to 7.155477.
Hence, a 95% confidence interval of the estimate is (58.64452,72.95548).
Part c
In this part, 5 systematic samples each of size 10 are drawn from the population.
# set seed
set.seed(10)
# write function to:
# 1. to draw a systematic random sample
# 2. compute mean of the sample
# 3. compute standard deviation of the sample
sample_sys <- function(){
k <- 312/10;k
s <- sample(1:10,1);s
sam_index <- c()
for (i in 1:10){
sam_index <- c(sam_index, s + i*s )
}
sam_index
# taking sample
3
Document Page
mydata_sys <- mydata[sam_index,]
# sample
mydata_sys
# treat the sample as SRS
x_srs <- mydata_sys$Test.1
# obtain the mean
mean_x_srs <- sum(x_srs)/length(x_srs);
# obtain the standard deviation
var_x_srs <- sum((x_srs-mean_x_srs)^2)/length(x_srs)
std_x_srs <- sqrt(var_x_srs)
return(c(mean_x_srs, std_x_srs))
}
means <- c()
stds <- c()
for (i in 1:5){
a = sample_sys()
means <-c(means, a[1])
stds <- c(stds, a[2])
}
means
## [1] 71.0 62.0 71.8 66.1 68.2
stds
## [1] 13.22876 19.33908 16.04868 13.97462 13.75354
# mean of 5 samples of size 10
mean_five_samples <- mean(means)
mean_five_samples
## [1] 67.82
# pooled varince
pooled_variance <- sum(9*stds^2)/(45)
# pooled standard deviation
pooled_std <- sqrt(pooled_variance)
The mean of the 5 systematic samples is equal to 67.82.Thus, it can be concluded that the average marks
of students across all the samples is 67.82=68(approx.).
# The standard error of the statistics is the estimated standard deviation of the statistics
standard_error_rs = pooled_std/sqrt(10)
standard_error_rs
## [1] 4.880594
4
tabler-icon-diamond-filled.svg

Paraphrase This Document

Need a fresh take? Get an instant paraphrase of this document with our AI Paraphraser
Document Page
# 95% bound on error of estimation = (1.96)(standard error of the statistics)
error_of_estimation_95_rs = 1.96 * standard_error_rs
error_of_estimation_95_rs
## [1] 9.565965
# confidence interval
confidence_interval_rs = c(mean_five_samples-error_of_estimation_95_rs, mean_five_samples+error_of_est
confidence_interval_rs
## [1] 58.25404 77.38596
The standard error is 4.880594.95% error bound is found to be 9.565965.Hence, a 95% confidence interval
of the estimate can be given as (58.25404,77.38596).
Part d
In repetitive sampling technique,the bias gets reduced.Moreover the confidence intervalbecomes wider.
This means that it gives more space for the calculations to be correct.Hence the sampling technique provided
in part c is more appropriate in this study.
5
chevron_up_icon
1 out of 5
circle_padding
hide_on_mobile
zoom_out_icon
[object Object]