Swinburne University STA60001 Assignment 1: Descriptive Statistics

Verified

Added on  2022/09/16

|9
|862
|29
Homework Assignment
AI Summary
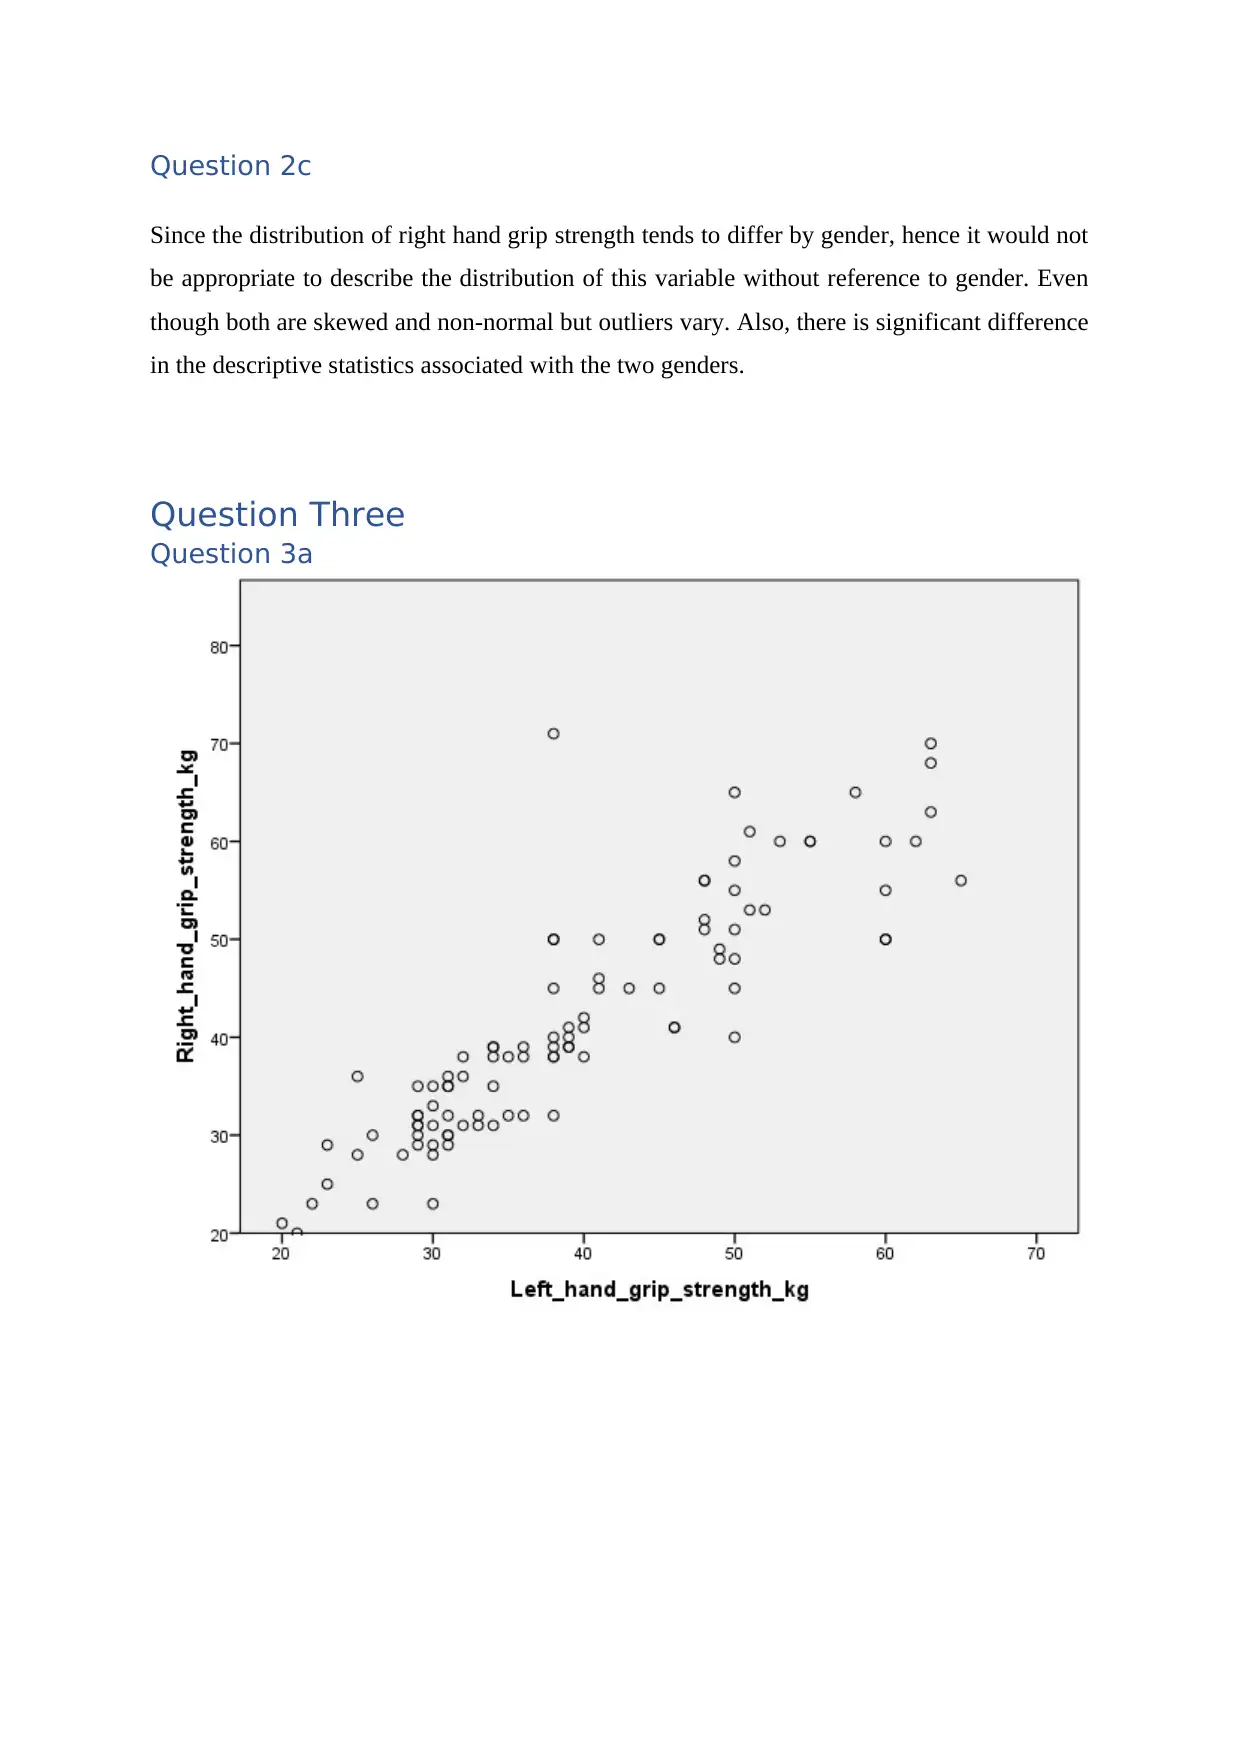
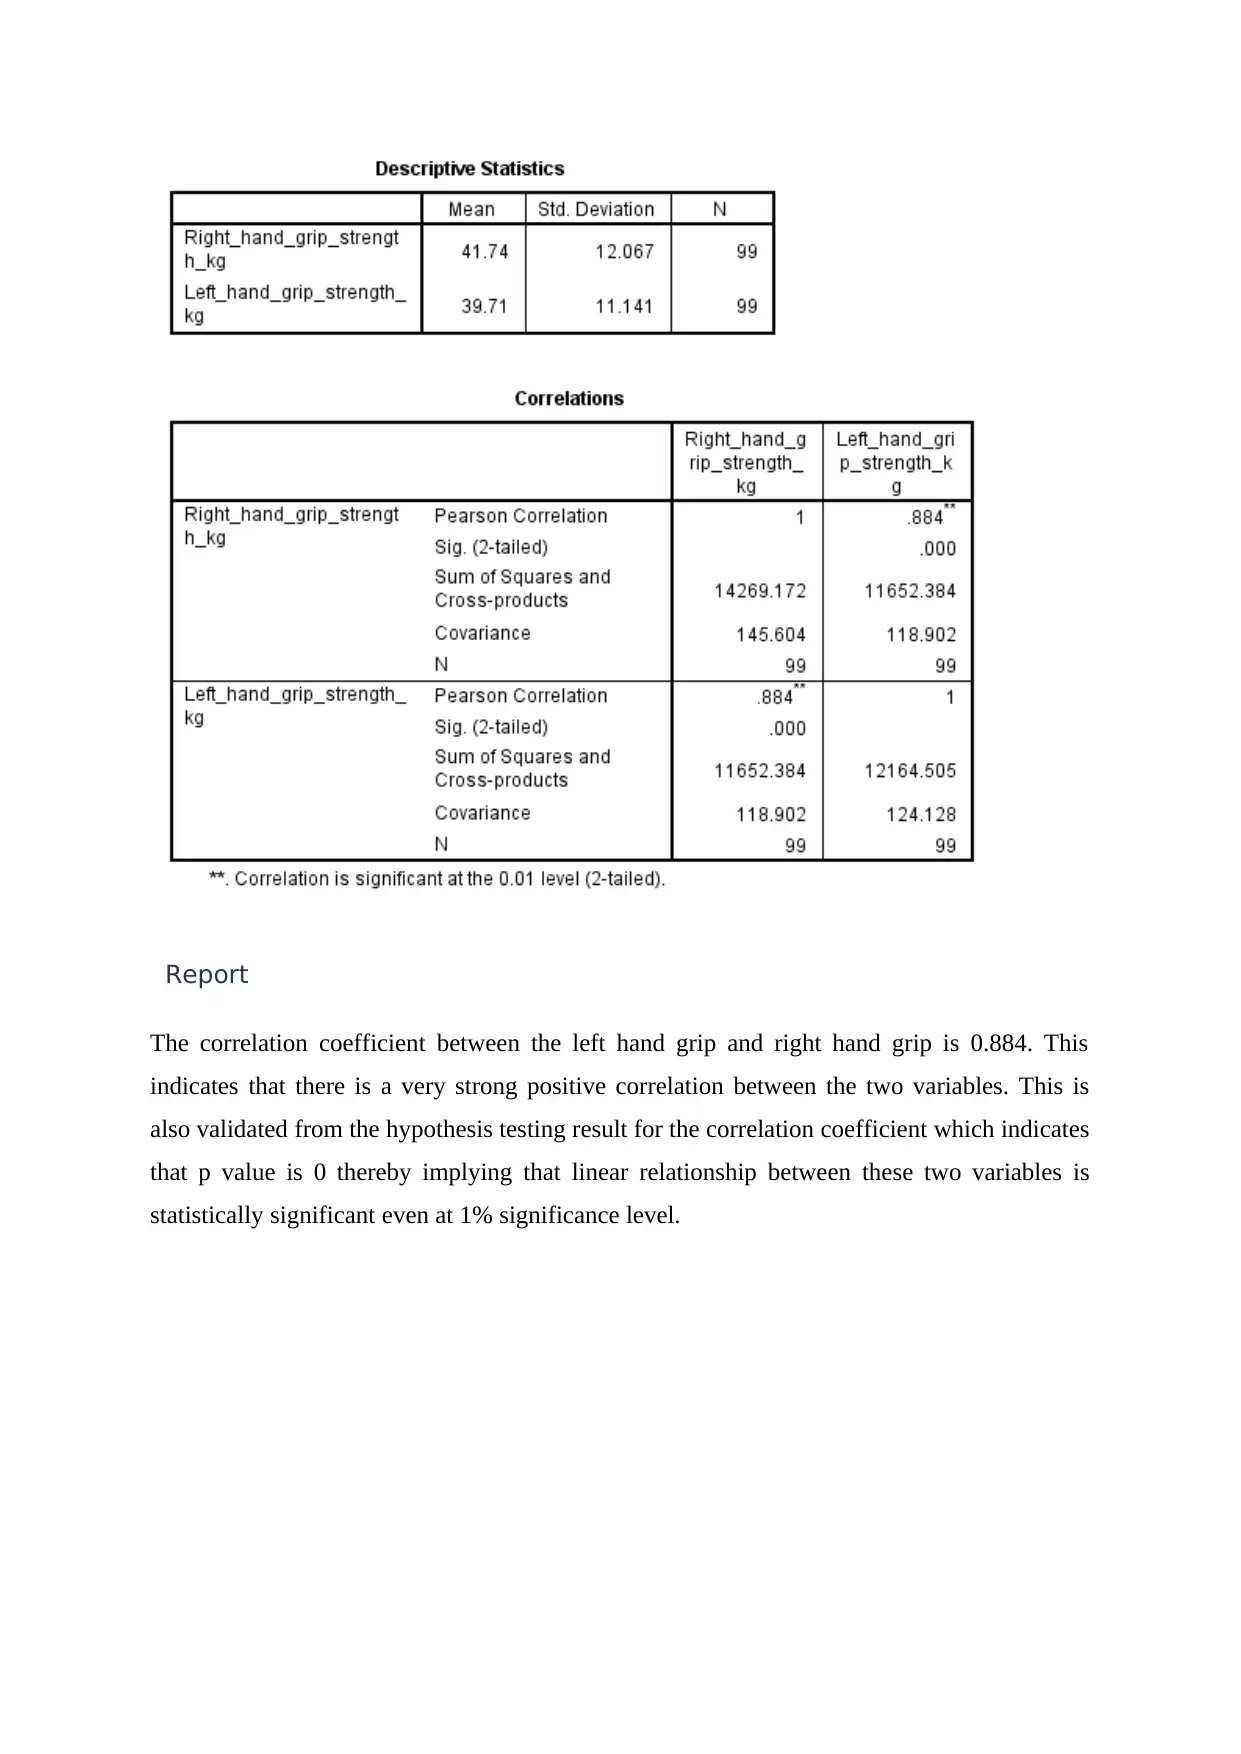
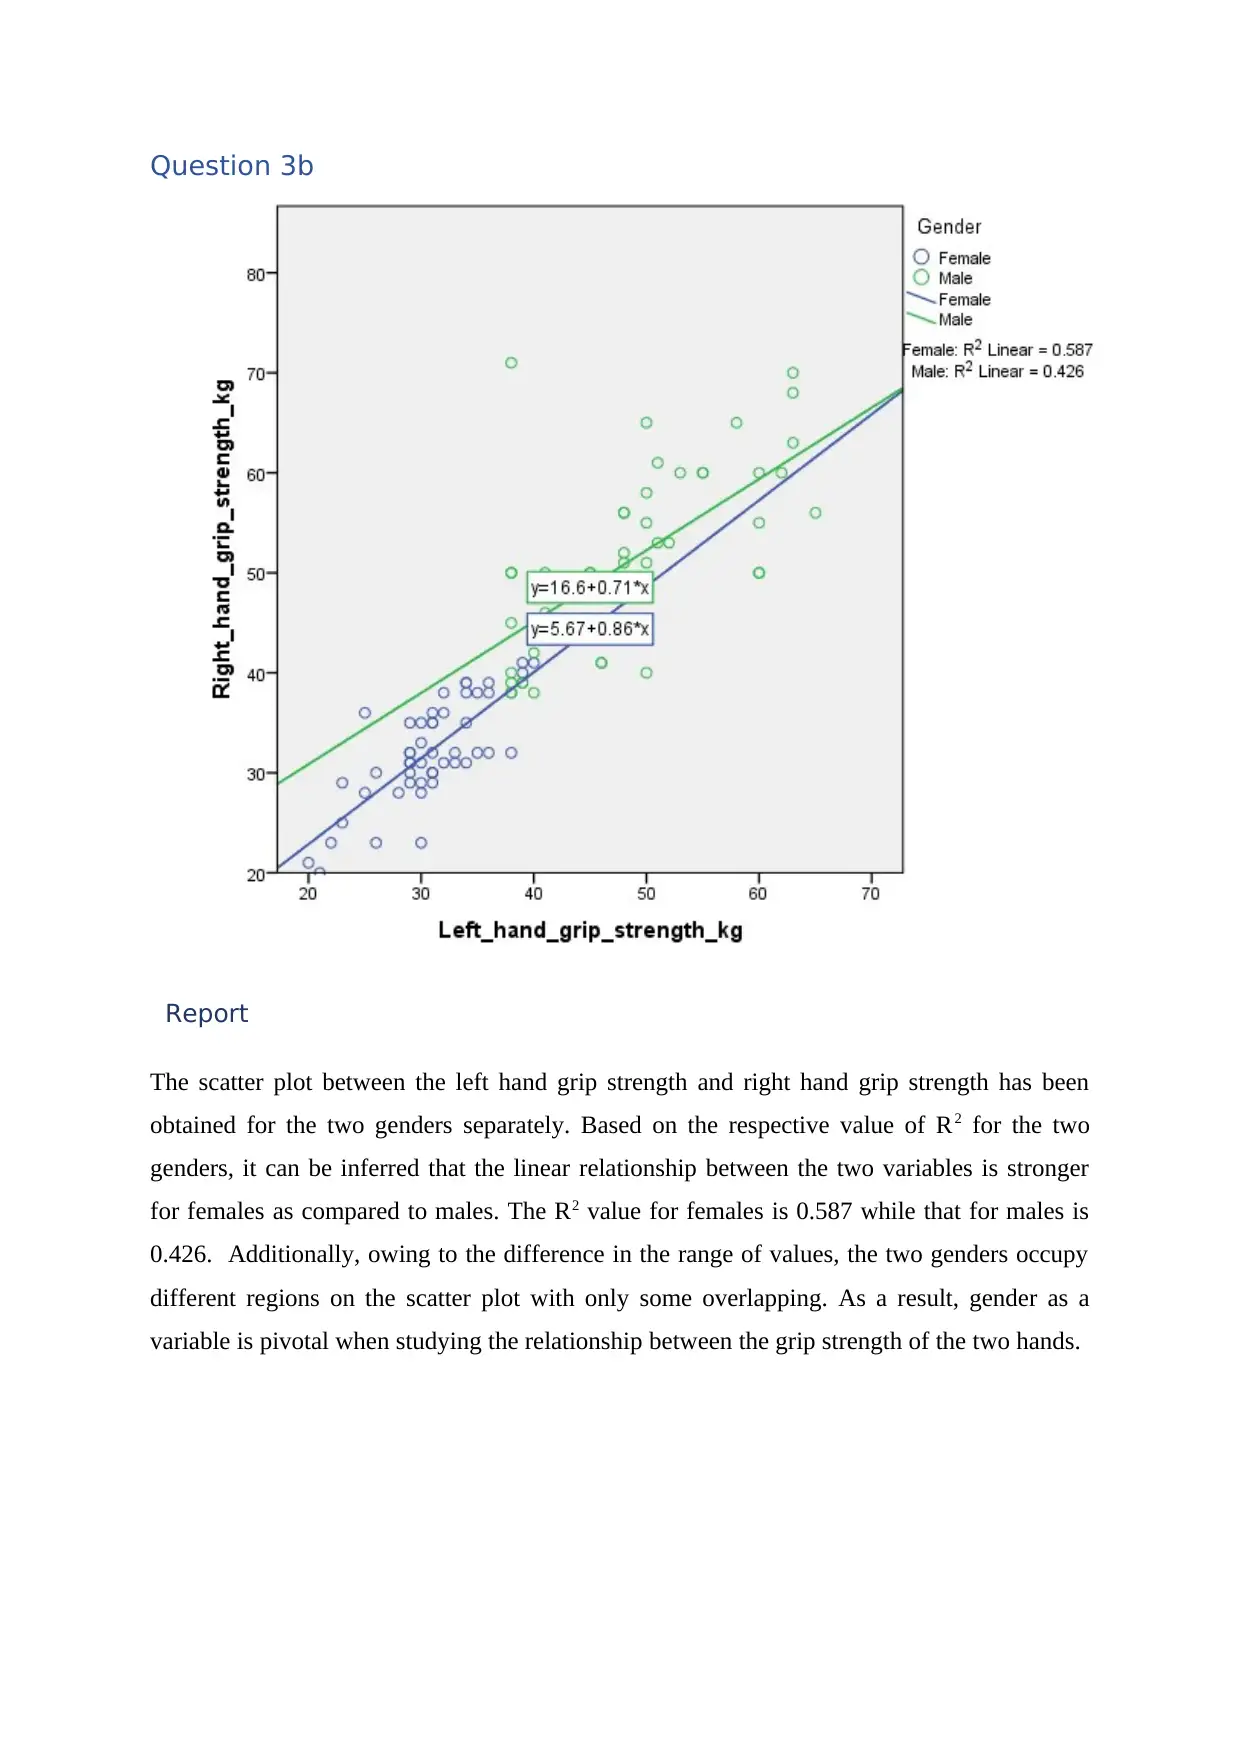
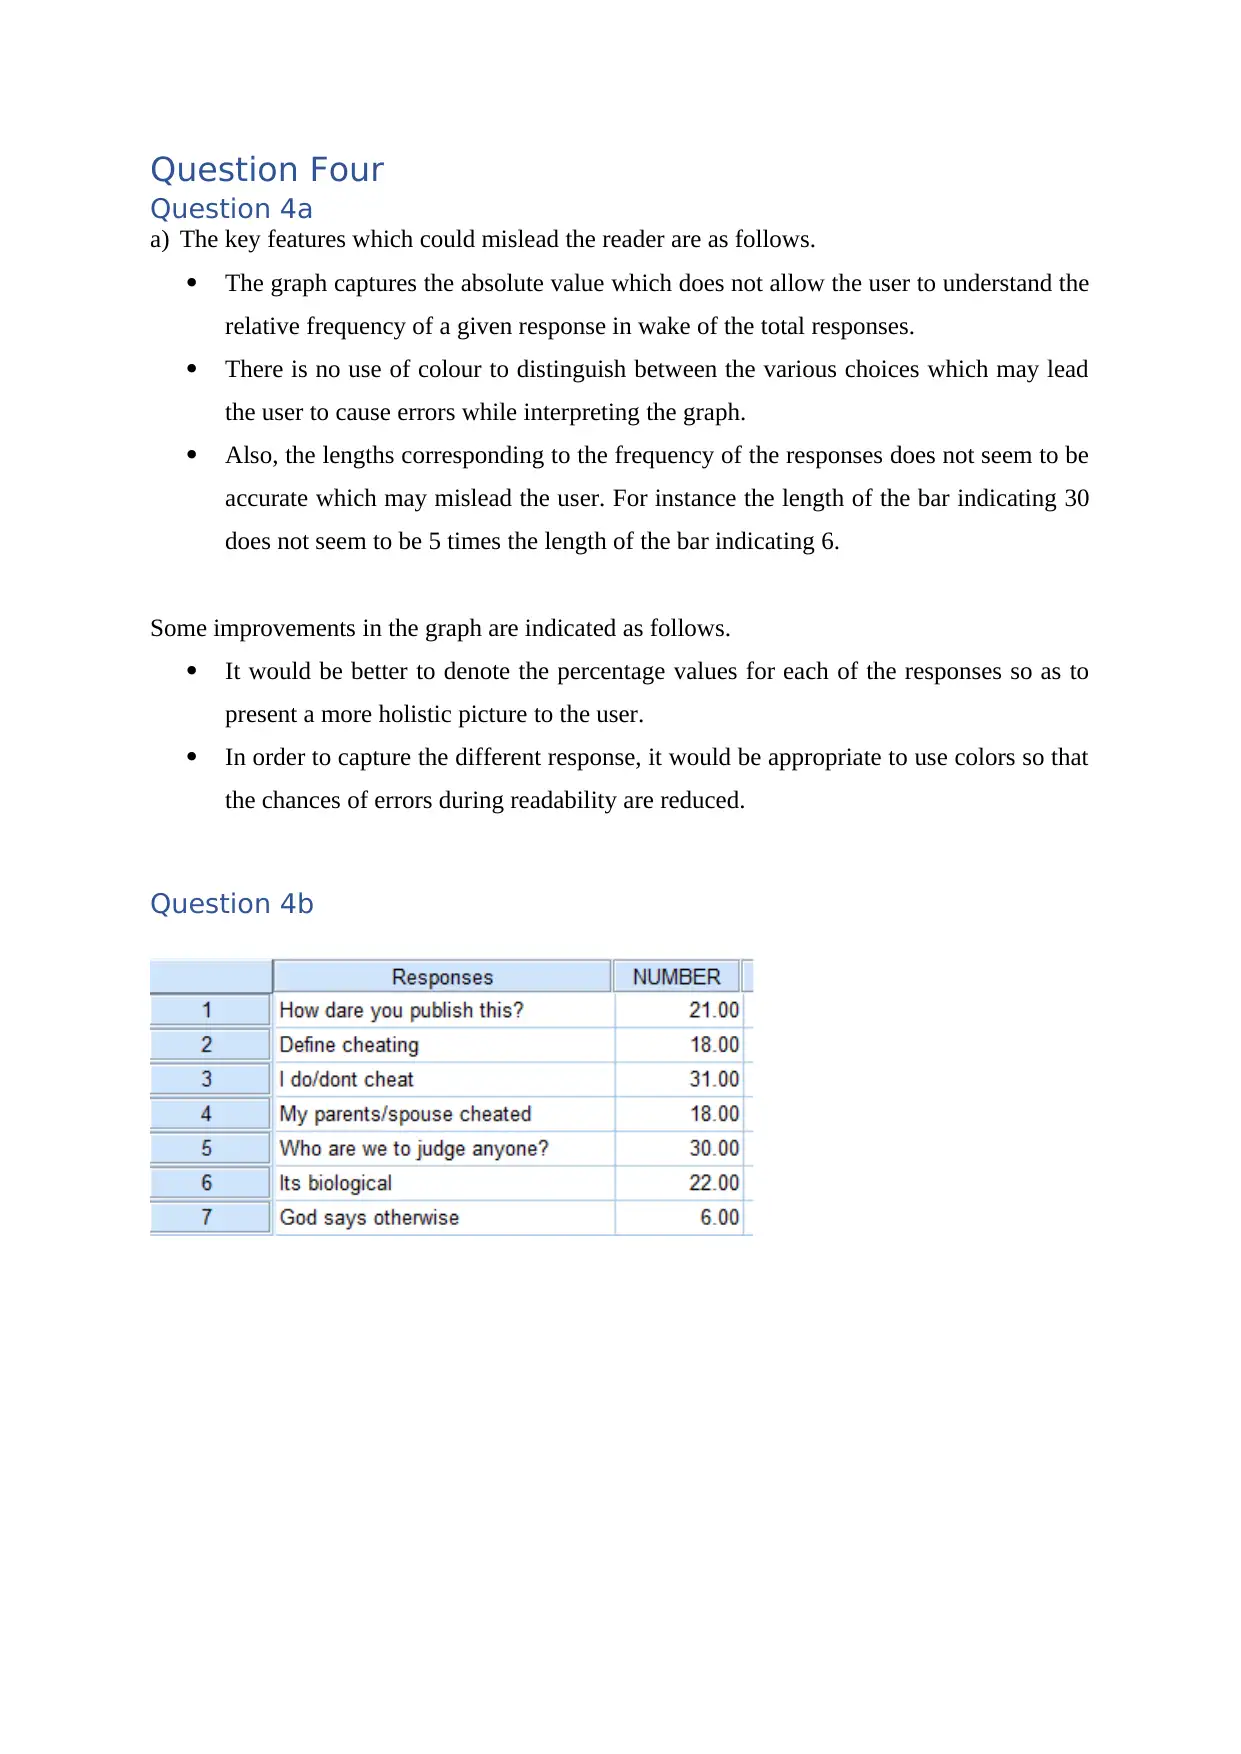
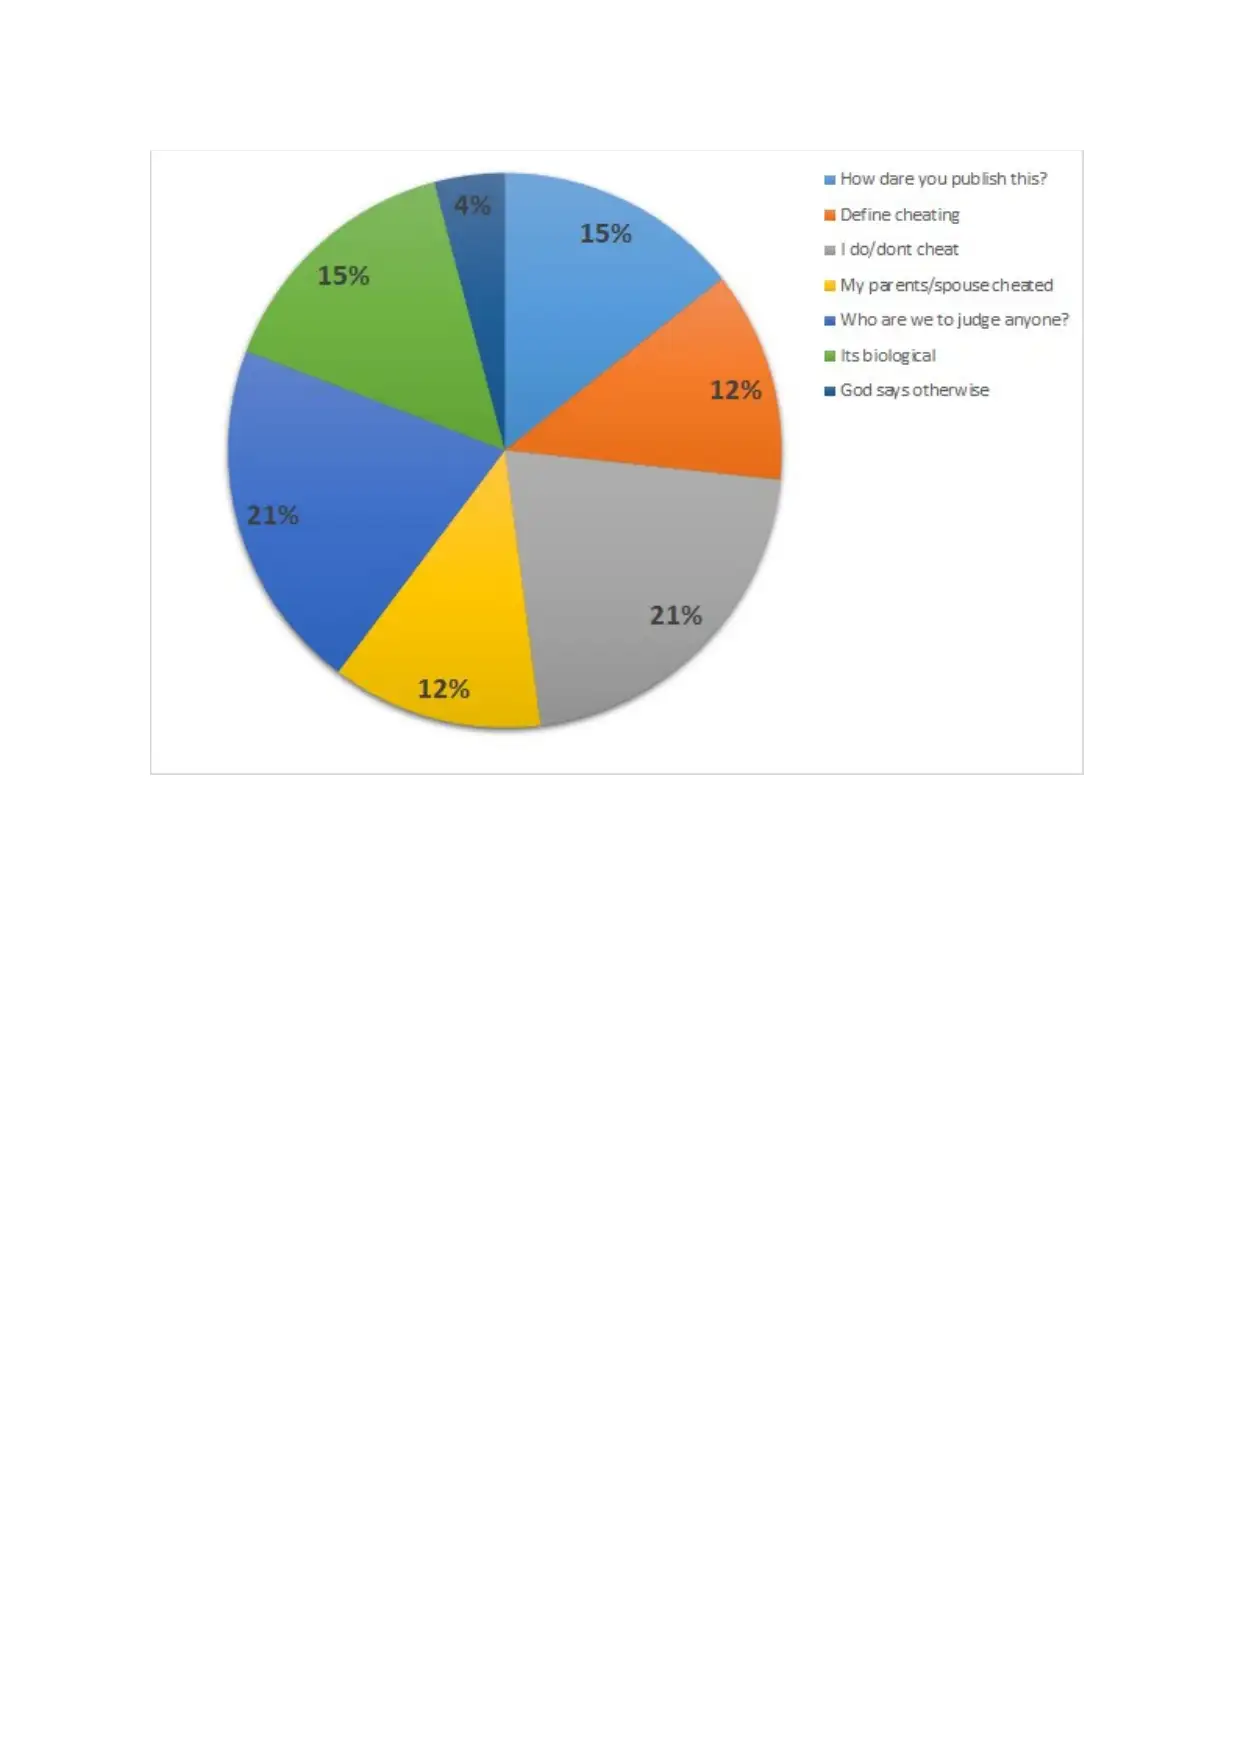
This document presents a comprehensive solution to STA60001 Assignment 1, focusing on descriptive statistics and data analysis techniques. The assignment involves analyzing right-hand grip strength data, examining its distribution through histograms and box plots, and identifying skewness and potential outliers. It also includes comparing grip strength between genders, evaluating correlations between left and right hand grip strength using correlation coefficients and scatter plots, and interpreting the relationship's strength for each gender. Furthermore, the solution critiques a provided graph, highlighting misleading features and suggesting improvements. The analysis utilizes SPSS for data processing and visualization, and the solution provides detailed reports, including SPSS output, along with explanations of key decisions made during the analysis.
Document Page
IndividualAssignment Coversheet (Online version)
DETAILS OF ASSIGNMENT
STUDENT NAME SWINBURNE ID NUMBER
EMAIL ADDRESS PHONE CONTACT
UNIT CODE STA60001
ASSESSMENT TITLE
Lecturer: Imma Guarnieri DATE OF SUBMISSION:
.
DECLARATION
I declare that (the first four boxes must be completed for the assignment to be accepted):
This assignment does not contain any material that has previously been submitted for assessment at this or any other
university.
This is an original piece of work and no part has been completed by any other student than signed below.
I have read and understood the avoiding plagiarism guidelines at http://www.swinburne.edu.au/ltas/plagiarism/students.htm
and no part of this work has been copied or paraphrased fromany other source except where this has been clearly acknowledged
in the body of the assignment and included in the reference list.
I have retained a copy of this assignment in the event of it becoming lost or damaged.
(optional) I agree to a copy of the assignment being retained as an exemplar for future students (subject to identifying details
being removed).
Student
acknowledgement ( by
typing your name you
agree to the above):
Date:
DETAILS OF FEEDBACK
Office Use Only
Date Received Received by
Total Mark / Grade Marker
tabler-icon-diamond-filled.svg

Paraphrase This Document

Need a fresh take? Get an instant paraphrase of this document with our AI Paraphraser
Document Page
Question One
Question 1a
Question 1b
Document Page
Question Two
Question 2a
Report
Document Page
Based on the histogram and box plot of right-hand grip strength, it is apparent that the
distribution is not normal. Clearly, in the box plot, the difference between median and Q1 is
significantly lesser than the difference between median and Q3. This is representative of
positive skew or right skew existing in the given data. This is evident from the histogram also
where the maximum frequency is visible in the class size 25-30 while there are some values
which are lying between 65-70. Some of these values can potentially be outliers.
Question 2b
Report
It is evident that the median value of right hand grip strength is significantly higher for males
in comparison with females. This is on expected lines. However, in terms of distribution, both
have a non-normal distribution with skew being present. With regards to males, there seem to
be outlier on the higher end as indicated from a long upper tail. In context of female
distribution, there is a possibility of outlier on the lower end even though data seems to have
some right skew.
tabler-icon-diamond-filled.svg

Paraphrase This Document

Need a fresh take? Get an instant paraphrase of this document with our AI Paraphraser
Document Page
Question 2c
Since the distribution of right hand grip strength tends to differ by gender, hence it would not
be appropriate to describe the distribution of this variable without reference to gender. Even
though both are skewed and non-normal but outliers vary. Also, there is significant difference
in the descriptive statistics associated with the two genders.
Question Three
Question 3a
Document Page
Report
The correlation coefficient between the left hand grip and right hand grip is 0.884. This
indicates that there is a very strong positive correlation between the two variables. This is
also validated from the hypothesis testing result for the correlation coefficient which indicates
that p value is 0 thereby implying that linear relationship between these two variables is
statistically significant even at 1% significance level.
Document Page
Question 3b
Report
The scatter plot between the left hand grip strength and right hand grip strength has been
obtained for the two genders separately. Based on the respective value of R2 for the two
genders, it can be inferred that the linear relationship between the two variables is stronger
for females as compared to males. The R2 value for females is 0.587 while that for males is
0.426. Additionally, owing to the difference in the range of values, the two genders occupy
different regions on the scatter plot with only some overlapping. As a result, gender as a
variable is pivotal when studying the relationship between the grip strength of the two hands.
tabler-icon-diamond-filled.svg

Paraphrase This Document

Need a fresh take? Get an instant paraphrase of this document with our AI Paraphraser
Document Page
Question Four
Question 4a
a) The key features which could mislead the reader are as follows.
The graph captures the absolute value which does not allow the user to understand the
relative frequency of a given response in wake of the total responses.
There is no use of colour to distinguish between the various choices which may lead
the user to cause errors while interpreting the graph.
Also, the lengths corresponding to the frequency of the responses does not seem to be
accurate which may mislead the user. For instance the length of the bar indicating 30
does not seem to be 5 times the length of the bar indicating 6.
Some improvements in the graph are indicated as follows.
It would be better to denote the percentage values for each of the responses so as to
present a more holistic picture to the user.
In order to capture the different response, it would be appropriate to use colors so that
the chances of errors during readability are reduced.
Question 4b
Document Page
chevron_up_icon
1 out of 9
circle_padding
hide_on_mobile
zoom_out_icon
[object Object]