Detailed Report: Standard Proctor Compaction Test for Soil Analysis
VerifiedAdded on 2023/01/13
|8
|1444
|79
Report
AI Summary
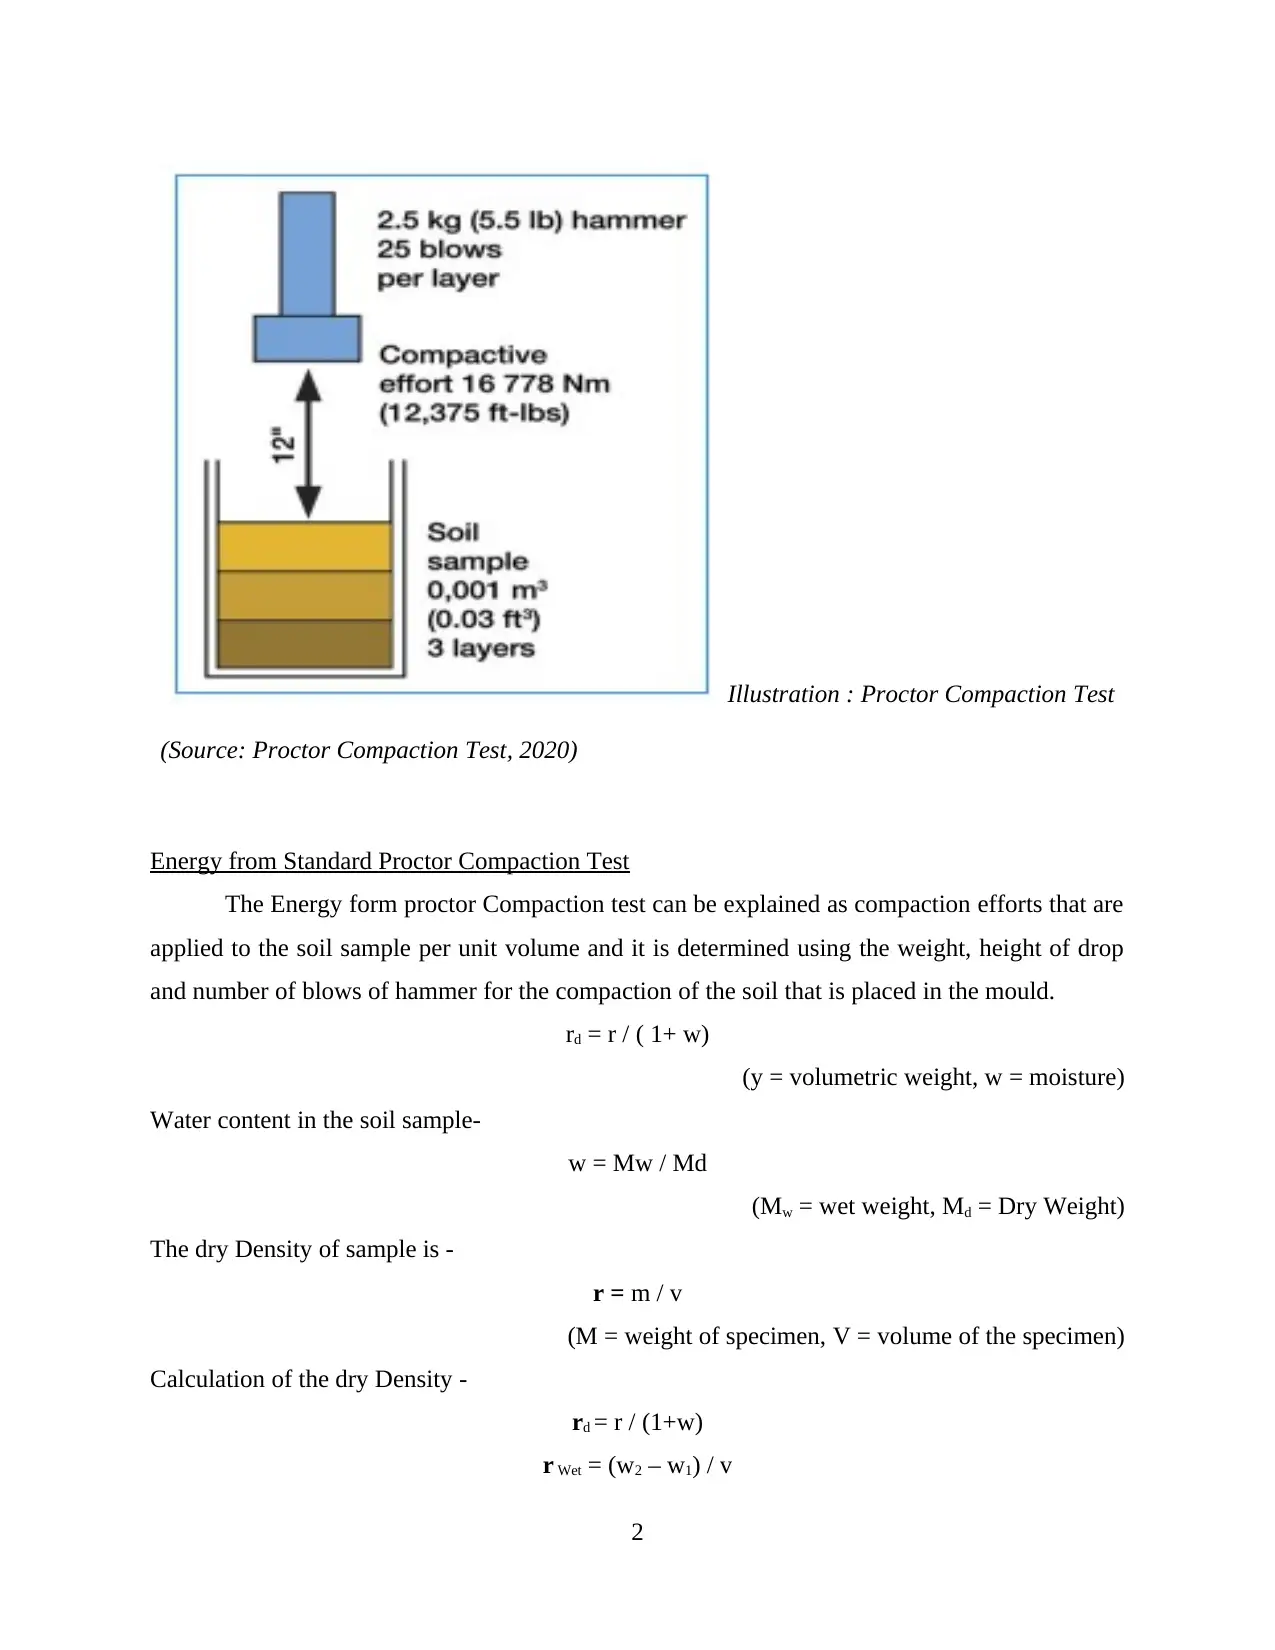
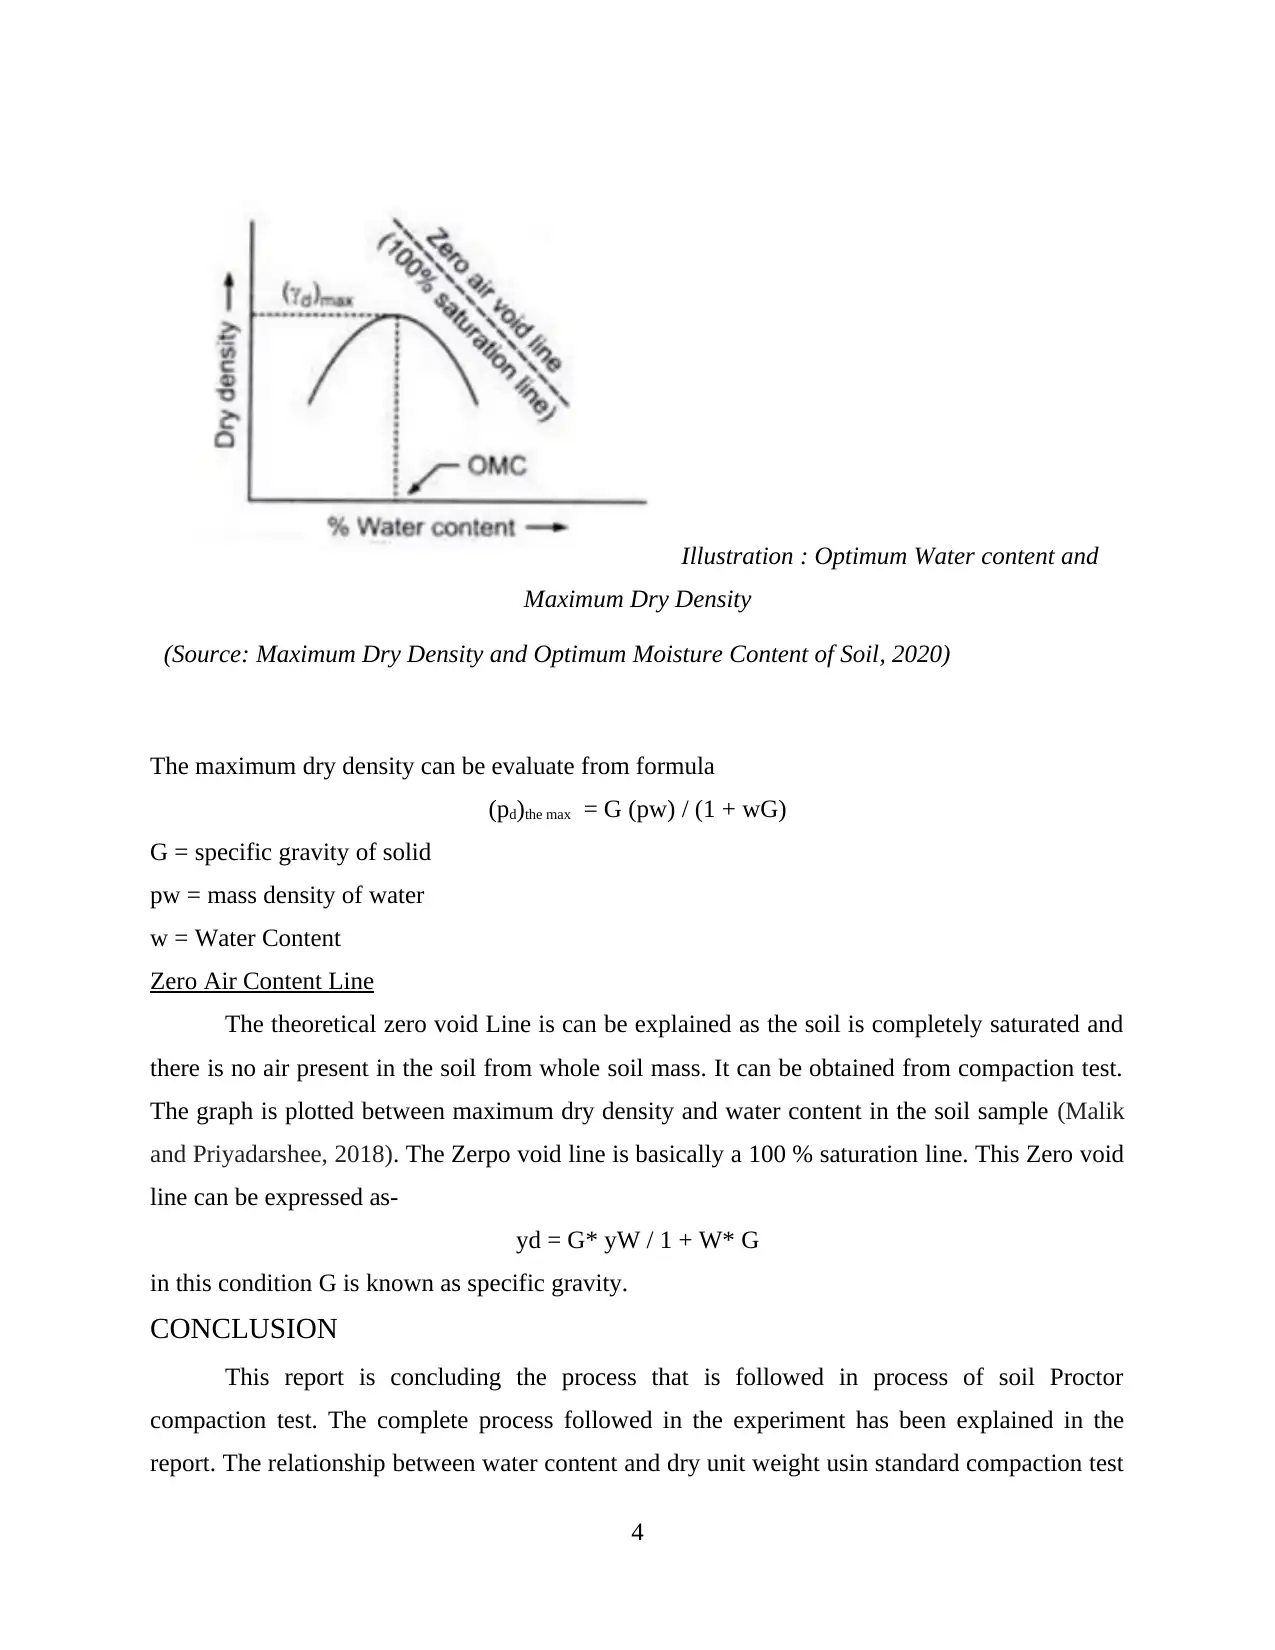
This report provides a detailed analysis of the Standard Proctor Compaction Test, a crucial laboratory procedure in civil engineering used to determine the optimal moisture content for soil compaction. The report outlines the test procedure, which involves compacting soil samples with varying water contents in a mold using a standard hammer. It explains how to calculate the dry density and water content, and how to plot a compaction curve to determine the maximum dry density and optimum water content. The report also discusses the concept of the zero air content line. Furthermore, it covers the energy involved in the standard proctor compaction test. References to relevant literature are included to support the findings and analysis presented. The report is designed to provide a comprehensive understanding of the test and its implications in soil mechanics and geotechnical engineering.

Standard Proctor Compaction Test for
Soil
Soil
Paraphrase This Document
Need a fresh take? Get an instant paraphrase of this document with our AI Paraphraser

Table of Contents
INTRODUCTION...........................................................................................................................1
MAIN BODY...................................................................................................................................1
Proctor Compaction Test.............................................................................................................1
Energy from Standard Proctor Compaction Test.........................................................................2
Relationship Between Water Content and Dry Unit Weight.......................................................3
Way to Determine Maximum Dry Weight and Optimum water content.....................................3
Zero Air Content Line..................................................................................................................4
CONCLUSION................................................................................................................................4
REFERENCES................................................................................................................................6

INTRODUCTION
The Proctor compaction test is a Laboratory process that is used to experimentally
determining the optimal content of moisture at which particular type of soil will become most
density and will achieve maximum dry density (Gurtug, Sridharan and Ikizler, 2018). Soil
compaction is known as process in which stress is applied on soil causes densification of soil as
air displace form the pores between the Soil grains. The proctor compression can be observed by
using process of soil consolidation. In this test a specific procedure is followed to evaluate the
optimum water content, maximum dry unit weight and Zero air content line of particular soil
sample.
MAIN BODY
Proctor Compaction Test
In the proctor Compaction test different soil samples are used with given water content
with in a mould with standard compaction energy. As per the standard process in this test a
mould of 4 Inch diameter is used with the compaction of three separate layers of soil using 25
blows of 5.5 Lb hammer that fall form 12 inches. In this process initially soil is dried and then
divided in 4 to 6 different samples. The water content of each ample is adjusted by adding
different amount in each sample (Force, 2019). The percentage of water added in each sample
depends on type of soil that is consider for the test. After this process these soil samples are
placed and compacted in proctor compaction mould in three different layer after placement of
each layer it is compacted with 25 blows of standard hammer. After each hammering process soil
sample is scratched in order to keep the uniform distribution for compaction impact. At the end
of test each sample is removed form mould and dried, dry density and water content of each
compaction test is measured. As per the data collected in the process a curve plotted in the end
between dry unit weight as function of water content in sample (Phai and Eisazadeh, 2019). By
using this curve the optimum water content to reach maximum dry density can be calculated.
This is how complete test is performed in order to evaluate different variables which are
important to know the
1
⊘ This is a preview!⊘
Do you want full access?
Subscribe today to unlock all pages.

Trusted by 1+ million students worldwide

Energy from Standard Proctor Compaction Test
The Energy form proctor Compaction test can be explained as compaction efforts that are
applied to the soil sample per unit volume and it is determined using the weight, height of drop
and number of blows of hammer for the compaction of the soil that is placed in the mould.
rd = r / ( 1+ w)
(y = volumetric weight, w = moisture)
Water content in the soil sample-
w = Mw / Md
(Mw = wet weight, Md = Dry Weight)
The dry Density of sample is -
r = m / v
(M = weight of specimen, V = volume of the specimen)
Calculation of the dry Density -
rd = r / (1+w)
r Wet = (w2 – w1) / v
2
Illustration : Proctor Compaction Test
(Source: Proctor Compaction Test, 2020)
Paraphrase This Document
Need a fresh take? Get an instant paraphrase of this document with our AI Paraphraser

W1 = weight of under part from the empty mold, gm
W2 = weight of compacted sample with mold, gm
V = Volume of mold, cm3
Water Content = (Weight of water in Sample / Weight of solid ) * 100
% w = 100 * (Ww/ Ws)
Dry Density = wet density / (1 +water content)
e = (Gr W – rdry) / rdry
(G = For the sub base sample equal to 2.96)
n = e / (1+e)
S = WG / e
Relationship Between Water Content and Dry Unit Weight
It is defined as the ratio of mass of water to the mass of solids present in the soil sample.
It is represented by “w”
w = (mass of water / mass of solids) = (Mw / Ms)
Dry density of soil is defined as the ratio of solids to the total volume of soil. It can be
represented as -
pd = mass of solids / Total volume of soil = Ms / v
to gain relationship between moisture content and dry density, mass of soil can be multiplied to
the numerator and denominator (m)
pd = (Ms / v) * (M / M)
= (M / v) * (Ms / M)
Mass of the soil can be considered as addition of mass of solid ans mass of water
pd = (M / v) / {(Ms + Mw) / Ms}
Ratio of mass to volume is the bulk density of sample soil which is considered as “p”.
pd = p / (1 + w)
Way to Determine Maximum Dry Weight and Optimum water content
The compaction curve is drawn between water content and the respective dry density. In
the compaction curve the peak point is obtained is known as Maximum dry density value
(Wersäll, Nordfelt and Larsson, 2017). Water content correspond to the maximum dry density is
known as optimum water content or optimum moisture content in the soil sample.
3

The maximum dry density can be evaluate from formula
(pd)the max = G (pw) / (1 + wG)
G = specific gravity of solid
pw = mass density of water
w = Water Content
Zero Air Content Line
The theoretical zero void Line is can be explained as the soil is completely saturated and
there is no air present in the soil from whole soil mass. It can be obtained from compaction test.
The graph is plotted between maximum dry density and water content in the soil sample (Malik
and Priyadarshee, 2018). The Zerpo void line is basically a 100 % saturation line. This Zero void
line can be expressed as-
yd = G* yW / 1 + W* G
in this condition G is known as specific gravity.
CONCLUSION
This report is concluding the process that is followed in process of soil Proctor
compaction test. The complete process followed in the experiment has been explained in the
report. The relationship between water content and dry unit weight usin standard compaction test
4
Illustration : Optimum Water content and
Maximum Dry Density
(Source: Maximum Dry Density and Optimum Moisture Content of Soil, 2020)
⊘ This is a preview!⊘
Do you want full access?
Subscribe today to unlock all pages.

Trusted by 1+ million students worldwide

has been provided in the report. The maximum dry density and optimum water content has been
explained in the study along with Zero Void content line.
5
explained in the study along with Zero Void content line.
5
Paraphrase This Document
Need a fresh take? Get an instant paraphrase of this document with our AI Paraphraser

REFERENCES
Books and Journals
Gurtug, Y., Sridharan, A. and Ikizler, S.B., 2018. Simplified method to predict compaction
curves and characteristics of soils. Iranian Journal Of Science and Technology,
Transactions Of Civil Engineering, 42(3), pp.207-216.
Force, P.A., 2019. Difficulties of using the Harvard Miniature Compaction.
Wersäll, C., Nordfelt, I. and Larsson, S., 2017. Soil compaction by vibratory roller with variable
frequency. Geotechnique, 67(3), pp.272-278.
Malik, V. and Priyadarshee, A., 2018. Compaction and swelling behavior of black cotton soil
mixed with different non-cementitious materials. International Journal of Geotechnical
Engineering, 12(4), pp.413-419.
Phai, H. and Eisazadeh, A., 2019. Compaction Properties of Rice Husk Ash-Lime-Bangkok Clay
Mixtures. In Key Engineering Materials (Vol. 803, pp. 331-337). Trans Tech
Publications Ltd.
Online
Proctor Compaction Test, 2020. [Online]. Available
Through.<http://www.geotechdata.info/geotest/proctor-compaction-test.html>.
Maximum Dry Density and Optimum Moisture Content of Soil, 2020. [Online]. Available
Through.<[Online]. Available Through.<http://www.geotechdata.info/geotest/proctor-
compaction-test.html>.
6
1 out of 8
Related Documents

Your All-in-One AI-Powered Toolkit for Academic Success.
+13062052269
info@desklib.com
Available 24*7 on WhatsApp / Email
Unlock your academic potential
Copyright © 2020–2025 A2Z Services. All Rights Reserved. Developed and managed by ZUCOL.


