Analysis of Roast Ltd for Starbucks UK Acquisition
VerifiedAdded on 2022/09/09
|17
|4504
|25
Report
AI Summary
This report analyzes Roast Ltd, an independent UK coffee house chain, for a potential acquisition by Starbucks UK. It begins with an industry review of the UK coffee house market, identifying key players, performance, challenges, and opportunities. The core of the report focuses on Roast Ltd's financial performance, analyzing its Profit or Loss statement, Statement of Financial Position, and Statement of Cash Flows. Key financial ratios are calculated and interpreted to assess profitability, liquidity, and solvency. The report then examines investment appraisal techniques, including payback period, accounting rate of return, and net present value, to evaluate the financial viability of the acquisition. Finally, it explores potential sources of finance for the acquisition. The report concludes with an executive summary, providing a recommendation on whether Starbucks should proceed with the acquisition based on the financial analysis and industry context. The analysis highlights both positive and negative aspects of Roast Ltd's financial health, including profitability, liquidity issues, and debt levels, offering a comprehensive assessment for Starbucks' decision-making process. The report suggests that the financial issues of Roast Ltd would be resolved after the expansion and inclusion of additional capital by Starbucks UK after the acquisition would improve the financial performance as well as position of Roast Ltd.

Running head: FINANCE MANAGEMENT
Finance Management
Name of the Student
Name of the University
Author’s Note
Finance Management
Name of the Student
Name of the University
Author’s Note
Paraphrase This Document
Need a fresh take? Get an instant paraphrase of this document with our AI Paraphraser
1FINANCE MANAGEMENT
Table of Contents
Executive summary....................................................................................................................2
Part 1: Industry Review..............................................................................................................3
Part 2: Business Performance Analysis......................................................................................3
2.1 Statement of Profit or Loss..............................................................................................3
2.2 Statement of Financial Position.......................................................................................6
2.3 Statement of Cash Flows..................................................................................................8
Part 3: Investment Appraisal and Sources of Finance.............................................................10
3.1 Investment Appraisal.....................................................................................................10
Management Forecast......................................................................................................10
Investment appraisal Techniques.....................................................................................10
Payback Period.................................................................................................................10
Accounting Rate of Return...............................................................................................11
Net Present Value.............................................................................................................11
3.2 Sources of Finance.........................................................................................................12
References................................................................................................................................14
2FINANCE MANAGEMENT
Executive summary
The report shows that the traditional coffee houses are facing major challenges from the
independent coffee houses because of their innovation. As per the analysis of profit or loss
statement, Roast Ltd has good profitability position with the increase in net profit ratio and
operating profit ratio in 2018. However, as per the analysis of statement of financial position,
the liquidity position of Roast Ltd is not good as 2017 and there is increase in debt in the
capital structure. Large amount of inventory is stored in stock which affects the inventory
turnover ratio. In addition, Roast Ltd has failed in collecting the receivable quickly as
compared to the previous year. There is increase in the operating cash cycle of Roast Ltd
which is not a favorable condition. However, the management of Roast Ltd is undertaken a
two phase expansion strategy and the completion of this expansion project will make the
company more profitable; and it can be expected that the current financial issues will be
resolved after the expansion. Therefore, after considering all these aspects, it is recommended
to Starbucks UK to process with the acquisition of Roast Ltd. The inclusion of additional
capital by Starbucks UK after the acquisition would improve the financial performance as
well as position of Roast Ltd.
⊘ This is a preview!⊘
Do you want full access?
Subscribe today to unlock all pages.
Trusted by 1+ million students worldwide
3FINANCE MANAGEMENT
Part 1: Industry Review
Coffee house industry in United Kingdom (UK) is a portion of the quick service
restaurant market in the country and an increasing trend is there in the number of
coffee houses in UK that includes both independent operators and non-specialists
(ibisworld.com 2019).
The coffee house industry of UK is controlled by three leading coffeehouse chains;
they are Starbucks, Costa Coffee and Caffe Nero.
Costa Coffee is the key multinational British coffee house chain and it is ranked as the
biggest coffee house chain in Europe. There has been major increase in the number of
coffee houses that is 2,422 shops in 2018.
Starbucks is another major coffee house chain having largest presence in UK. There
has been increase in the profitability of Starbucks along.
In terms of favorite coffee house, Caffe Nero has better reputation as compared to
Cosa Coffee and Starbucks (statista.com 2019).
There are certain opportunities and challenges in the UK coffee house industry.
Traditional coffee houses are facing major challenges from non-specialists coffee
houses. Coffee houses are required to depend on the tailored and experience-led
offerings as these are the key of success. Supply chain transparency will challenge the
traditional coffee house brands like Starbucks. Innovation with premium products will
provide key opportunities to the coffee house in UK.
Part 2: Business Performance Analysis
2.1 Statement of Profit or Loss
It can be seen from the Profit or Loss statement of Roast Ltd that there has been
improvements in the financial performance in 2018 as compared to 2017 in the presence of
Paraphrase This Document
Need a fresh take? Get an instant paraphrase of this document with our AI Paraphraser
4FINANCE MANAGEMENT
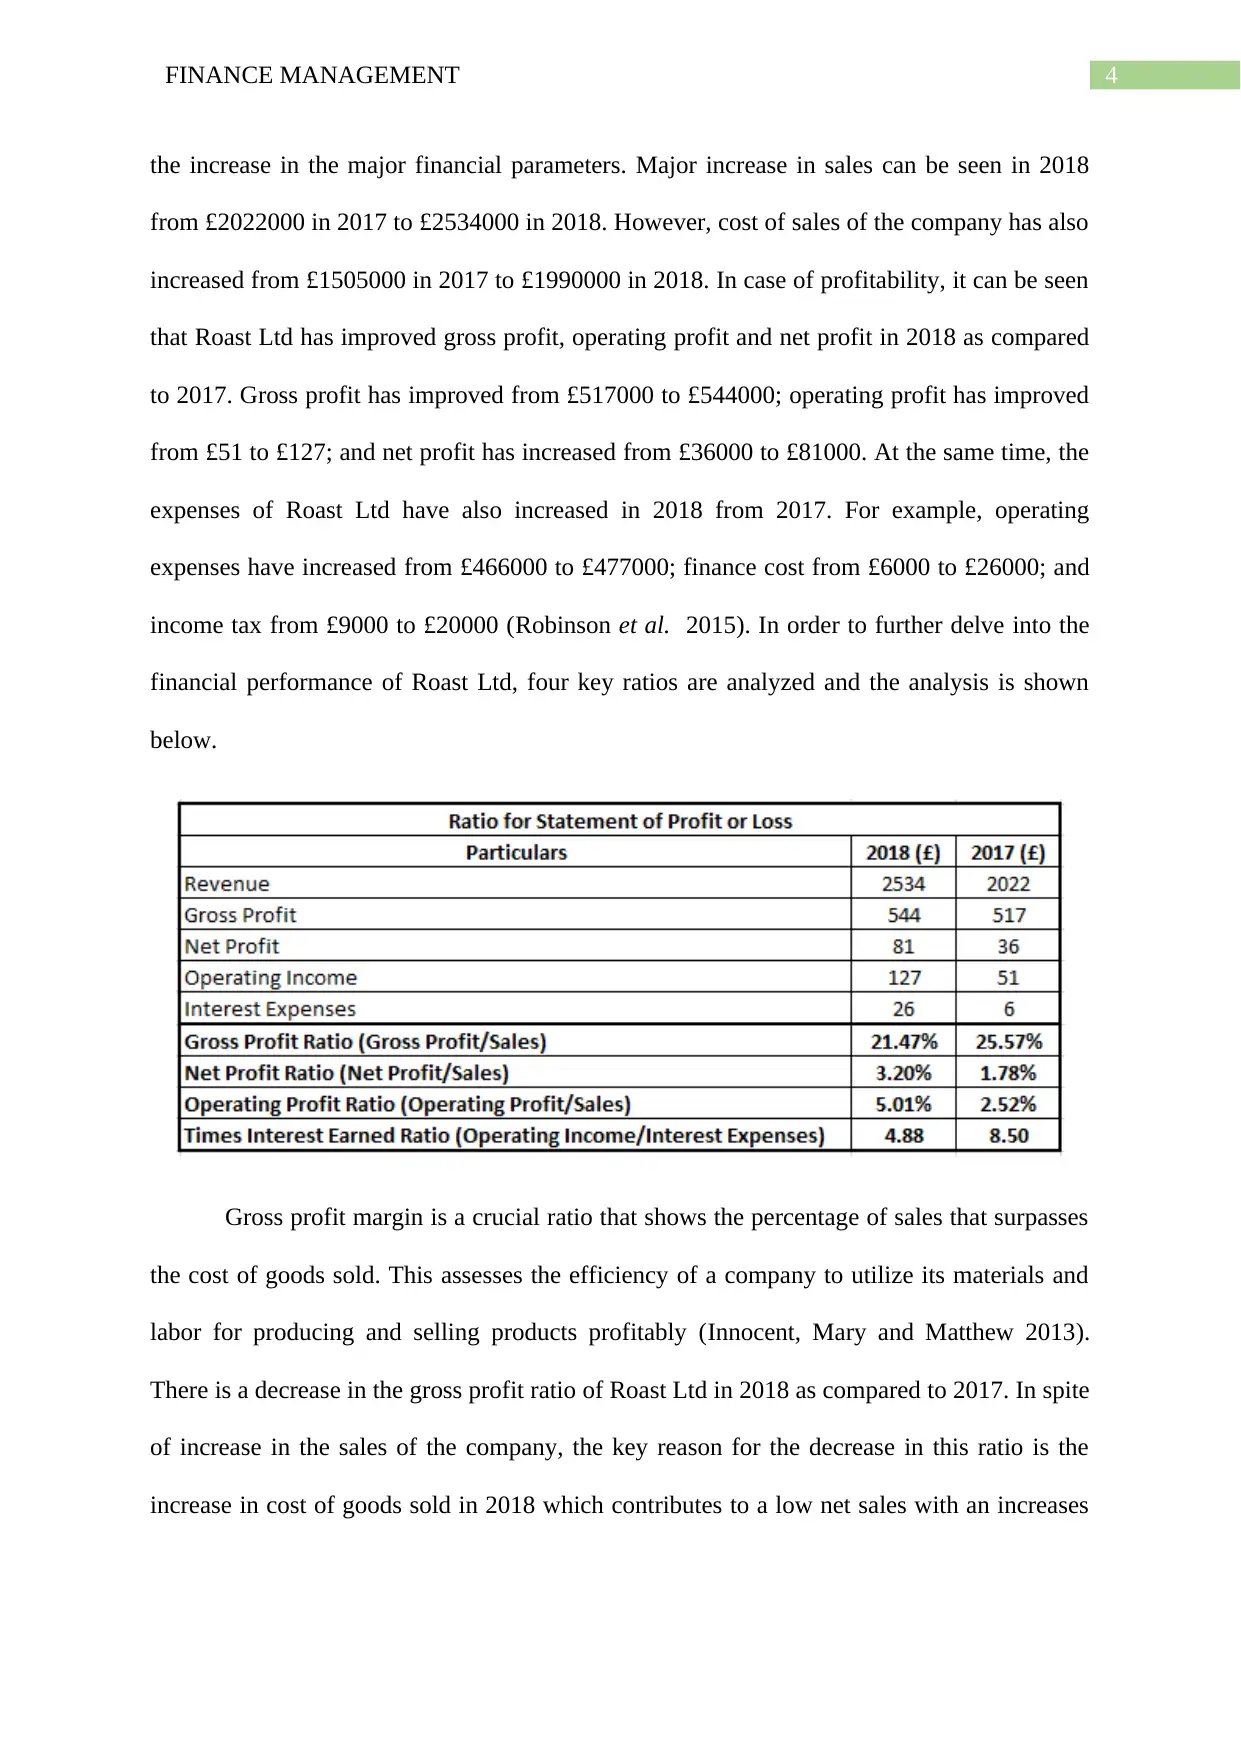
the increase in the major financial parameters. Major increase in sales can be seen in 2018
from £2022000 in 2017 to £2534000 in 2018. However, cost of sales of the company has also
increased from £1505000 in 2017 to £1990000 in 2018. In case of profitability, it can be seen
that Roast Ltd has improved gross profit, operating profit and net profit in 2018 as compared
to 2017. Gross profit has improved from £517000 to £544000; operating profit has improved
from £51 to £127; and net profit has increased from £36000 to £81000. At the same time, the
expenses of Roast Ltd have also increased in 2018 from 2017. For example, operating
expenses have increased from £466000 to £477000; finance cost from £6000 to £26000; and
income tax from £9000 to £20000 (Robinson et al. 2015). In order to further delve into the
financial performance of Roast Ltd, four key ratios are analyzed and the analysis is shown
below.
Gross profit margin is a crucial ratio that shows the percentage of sales that surpasses
the cost of goods sold. This assesses the efficiency of a company to utilize its materials and
labor for producing and selling products profitably (Innocent, Mary and Matthew 2013).
There is a decrease in the gross profit ratio of Roast Ltd in 2018 as compared to 2017. In spite
of increase in the sales of the company, the key reason for the decrease in this ratio is the
increase in cost of goods sold in 2018 which contributes to a low net sales with an increases
5FINANCE MANAGEMENT
amount of cost of goods sold. It also demonstrates that Roast Ltd has not been able to use its
materials and labors in the most effective manner as compared to the previous year.
Operating profit ratio is a crucial profit or loss statement associated ratio that assesses
the amount of revenue left over after the payment of all operating expenses. Therefore, this
ratio demonstrates the percentage of available revenue for covering non-operating costs like
interest expenses (Rengasamy 2014). As per the above table, there is a healthy increase in
this ratio of Roast Ltd in 2018 as compared to 2017. This indicates towards the crucial fact
that Roast Ltd is left with healthy amount of revenue after the payment of operating expenses.
Moreover, increase in this ratio in the company also shows that efficiency of the management
of Roast Ltd in managing the resources that means higher operational efficiency is
contributing towards higher operating profit. This needs to be considered as a positive side of
the company’s financial performance.
Net profit ratio is one of the best ratios for measuring the overall result of a company.
This particular ratio assesses the amount of sales left over after the payment of all the
expenses incurred by the business (Arunkumar and Ramanan 2013). This measures the
competence of a company to convert its sales into net income. It can be seen from the above
table that there is a major increase in the net profit ratio of Roast Ltd in 2018 from 2017.
Improvement in this ratio shows the improved efficiency of Roast Ltd in converting its sales
into net income. In addition, this increase also indicates towards the fact that the proportion
of increase in sales is higher than the proportion of increase in direct and indirect expenses
which contributes towards higher profitability of the company.
Times interest earned ration assesses the capability of a firm to pay the required
interest expenses of its debt obligations. This is a useful ratio for the lenders for ascertaining
whether the prospective borrower can afford to take additional loans (San and Heng 2013).
⊘ This is a preview!⊘
Do you want full access?
Subscribe today to unlock all pages.
Trusted by 1+ million students worldwide
6FINANCE MANAGEMENT
This ratio also measures a firm’s available profit for making the interest payments. The above
table demonstrates a major decrease in this ratio of Roast Ltd from 2017 to 2018 despite of
the increase in operating profit. The key reason for the decrease in this ratio is that the
proportion to increase interest expenses in 2018 is larger than the proportion of increase in
operating expenses. This is an indicator of the firm’s debt burden along with insufficient
operating income.
The above analysis shows that Roast Ltd has been able in increasing its operating
profit ratio and net profit ratio, but there is also decrease in its gross profit ratio and times
interest earned ratio because of the increase in cost goods sold, operating expenses and
interest expenses. These aspects are required to take into consideration.
2.2 Statement of Financial Position
As per the Statement of Financial Position of Roast Ltd, there is rise in the non-
current assets of the business from £670000 to £996000; and there is also upsurge in the total
current assets of the company from £347000 to £447000 because of the increase in
inventories and trade and other receivable. However, the absence of cash and cash equivalent
in 2018 is a negative aspect for the short-term liquidity of Roast Ltd. The main reason in
growth in total equity of the company is the increase in retained earnings. After that, total
liabilities of the company has increased from £238000 to £583000 because of the increase in
long-term borrowings, trade payables and bank overdraft. Increase in liabilities cannot be
considered as a good aspect for the financial position of the company (Schroeder, Clark and
Cathey 2019). In order to further explore the financial performance of Roast Ltd, analysis of
the following rations is taken into consideration.
Paraphrase This Document
Need a fresh take? Get an instant paraphrase of this document with our AI Paraphraser
7FINANCE MANAGEMENT
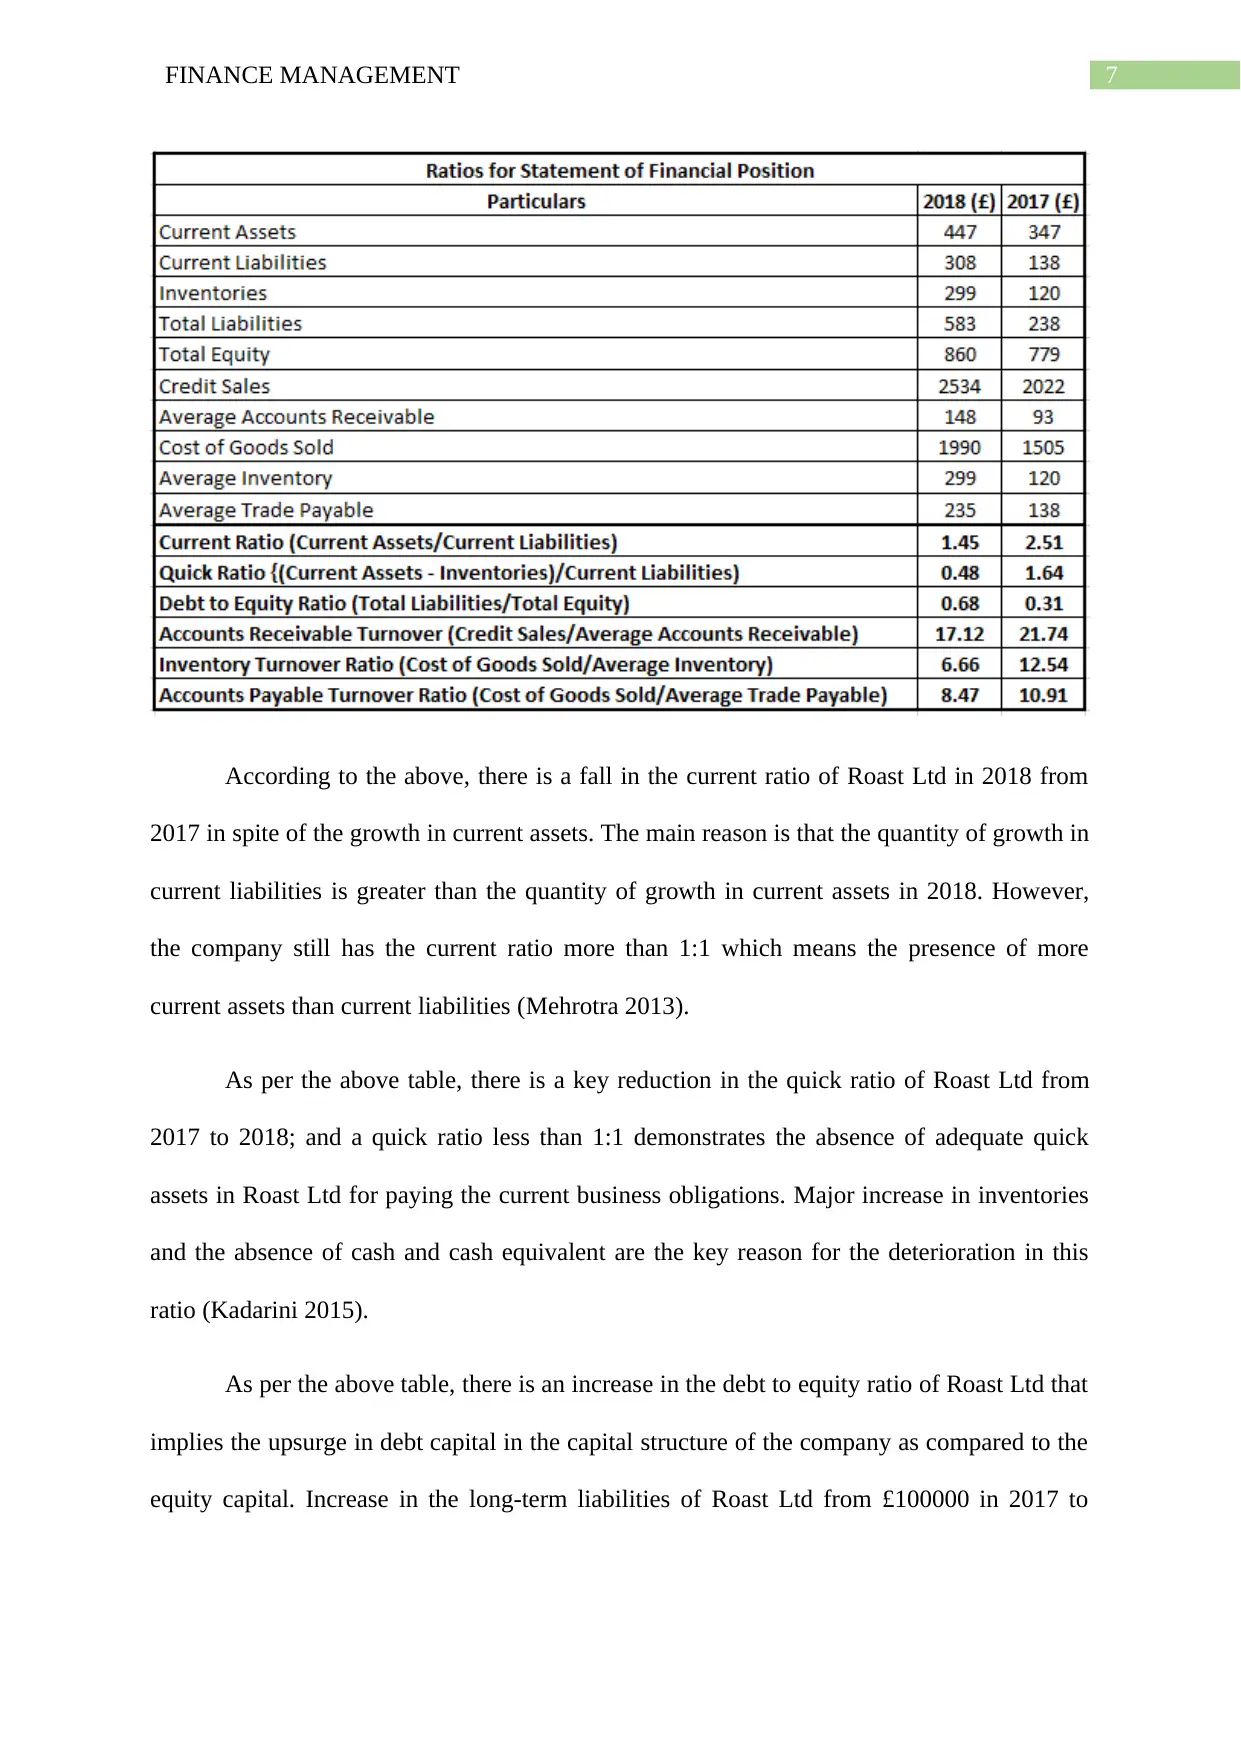
According to the above, there is a fall in the current ratio of Roast Ltd in 2018 from
2017 in spite of the growth in current assets. The main reason is that the quantity of growth in
current liabilities is greater than the quantity of growth in current assets in 2018. However,
the company still has the current ratio more than 1:1 which means the presence of more
current assets than current liabilities (Mehrotra 2013).
As per the above table, there is a key reduction in the quick ratio of Roast Ltd from
2017 to 2018; and a quick ratio less than 1:1 demonstrates the absence of adequate quick
assets in Roast Ltd for paying the current business obligations. Major increase in inventories
and the absence of cash and cash equivalent are the key reason for the deterioration in this
ratio (Kadarini 2015).
As per the above table, there is an increase in the debt to equity ratio of Roast Ltd that
implies the upsurge in debt capital in the capital structure of the company as compared to the
equity capital. Increase in the long-term liabilities of Roast Ltd from £100000 in 2017 to
8FINANCE MANAGEMENT
£275000 in 2018 is the main reason contributing to the growth in this ratio. This makes the
company highly leveraged as well as highly risky (Khadafi Heikal and Ummah 2014).
There is a decrease in the accounts receivable turnover ratio of Roast Ltd in 2018
from 2017. This indicates towards the fact that the company has lacked the efficiency in 2018
to collect the money from its debtors. This needs to be considered as the negative aspect of
the financial position of the company (Ramana, Ramakrishnaiah and Chengalrayulu 2013).
Major decrease in the inventory turnover ratio of Roast Ltd in 2018 than 2017 can be
seen from the above table. The increase in inventory from £120000 in 2017 to £299000 in
2018 can be considered as the prime reason for this. It indicates towards the absence of
efficiency of Roast Ltd in converting its average inventory in sales in 2018 (Lee, Zhou and
Hsu 2015).
There is a decrease in the accounts payable turnover ratio of Roast Ltd in 2018 than
2017. This indicates that Roast Ltd has lacked the speed to pay its suppliers in 2018 as
compared to 2017. The fall in this ratio also signifies that Roast Ltd does not have adequate
liquidity position which restricts it in paying the creditors in time (Santosuosso 2014).
The analysis of the statement of financial position of Roast Ltd shows that the
company has many issues associated with liquidity position, leverage and other areas. All
these aspects are required to take into consideration at the time of making investment
decisions in the company by the management of Starbucks.
2.3 Statement of Cash Flows
In case of operating activities, decrease in inventories and trade and other receivables
has majorly affected the operating profit of the company. Other expenses include, interest
payment and income tax payment. There is an increase in trade payable that has also created
impact on the net cash flows from operating activities of Roast Ltd. In case of cash flows
⊘ This is a preview!⊘
Do you want full access?
Subscribe today to unlock all pages.
Trusted by 1+ million students worldwide
9FINANCE MANAGEMENT
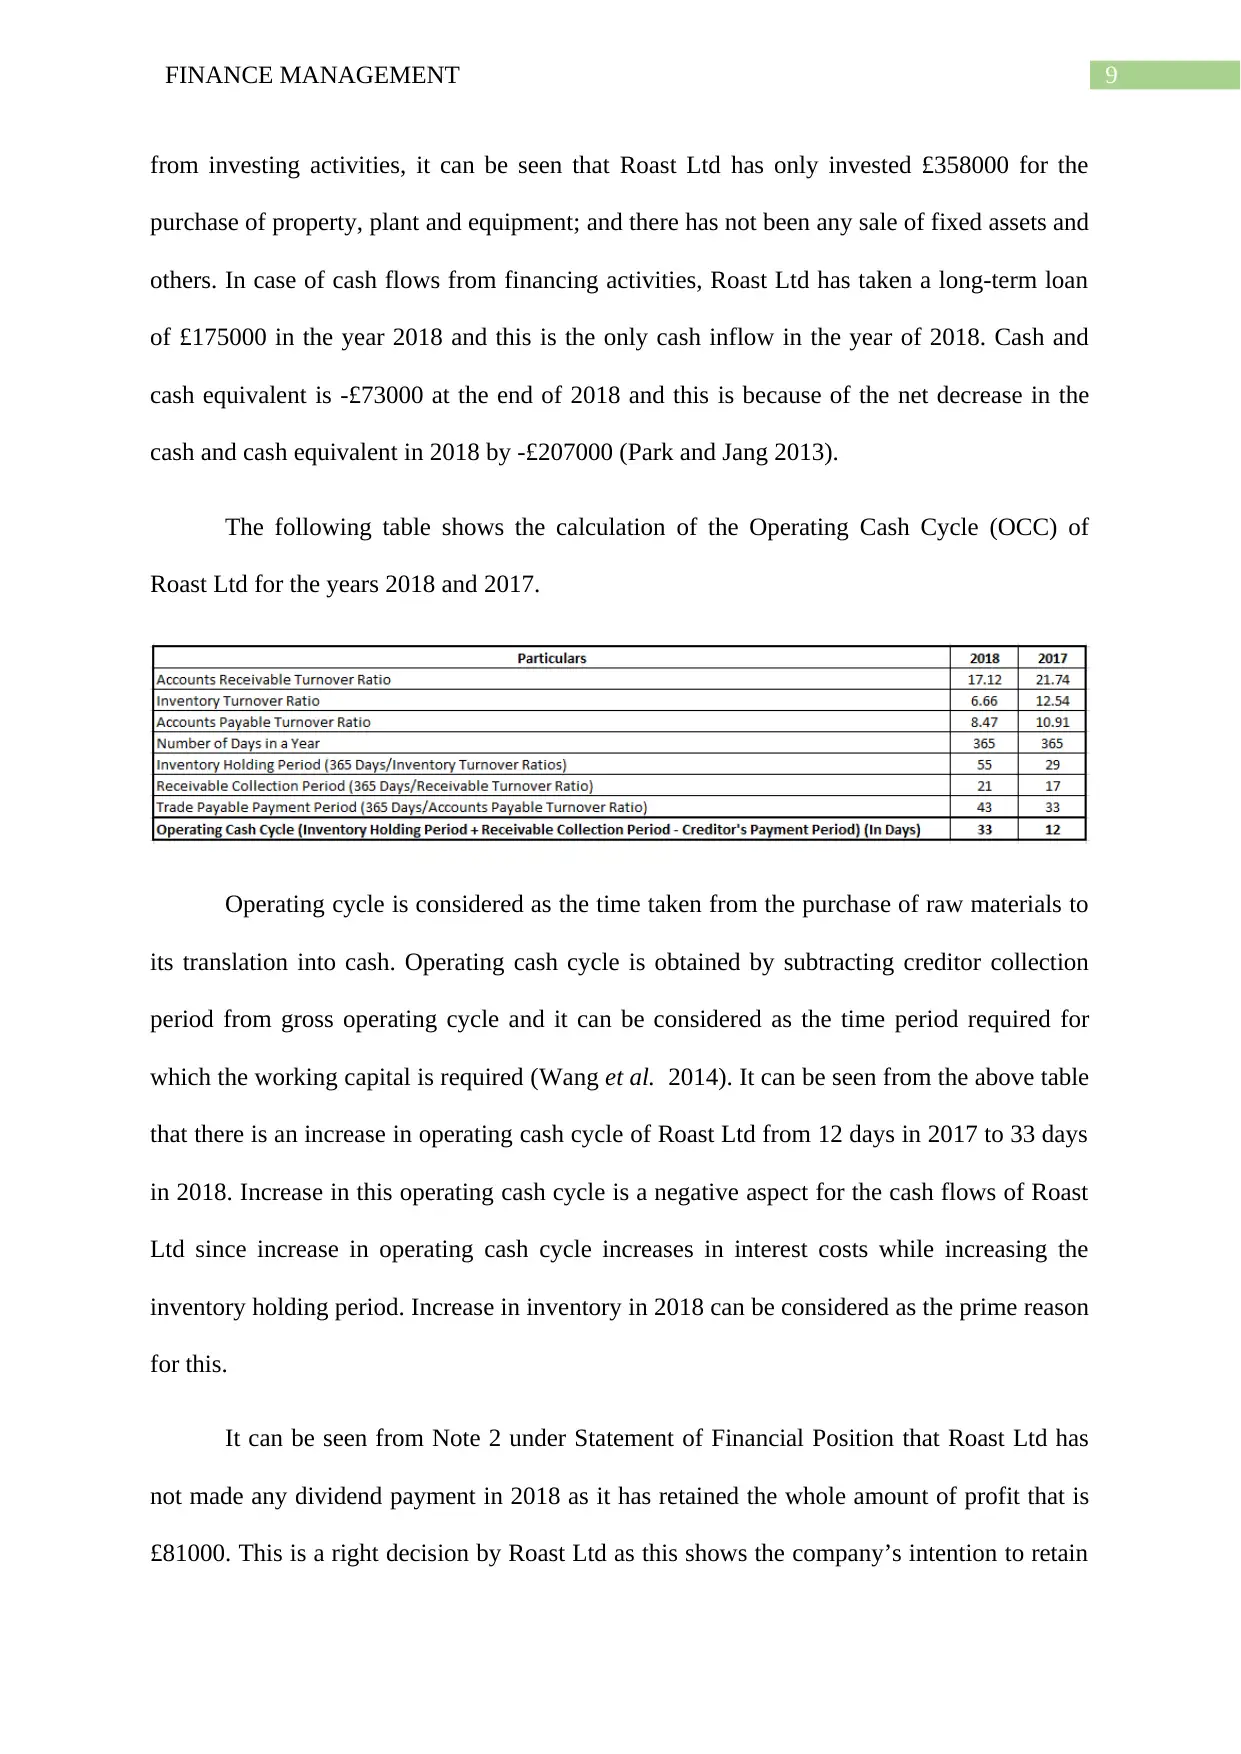
from investing activities, it can be seen that Roast Ltd has only invested £358000 for the
purchase of property, plant and equipment; and there has not been any sale of fixed assets and
others. In case of cash flows from financing activities, Roast Ltd has taken a long-term loan
of £175000 in the year 2018 and this is the only cash inflow in the year of 2018. Cash and
cash equivalent is -£73000 at the end of 2018 and this is because of the net decrease in the
cash and cash equivalent in 2018 by -£207000 (Park and Jang 2013).
The following table shows the calculation of the Operating Cash Cycle (OCC) of
Roast Ltd for the years 2018 and 2017.
Operating cycle is considered as the time taken from the purchase of raw materials to
its translation into cash. Operating cash cycle is obtained by subtracting creditor collection
period from gross operating cycle and it can be considered as the time period required for
which the working capital is required (Wang et al. 2014). It can be seen from the above table
that there is an increase in operating cash cycle of Roast Ltd from 12 days in 2017 to 33 days
in 2018. Increase in this operating cash cycle is a negative aspect for the cash flows of Roast
Ltd since increase in operating cash cycle increases in interest costs while increasing the
inventory holding period. Increase in inventory in 2018 can be considered as the prime reason
for this.
It can be seen from Note 2 under Statement of Financial Position that Roast Ltd has
not made any dividend payment in 2018 as it has retained the whole amount of profit that is
£81000. This is a right decision by Roast Ltd as this shows the company’s intention to retain
Paraphrase This Document
Need a fresh take? Get an instant paraphrase of this document with our AI Paraphraser
10FINANCE MANAGEMENT
the profit for using it in phase two of its expansion strategy. Roast Ltd is in need of £400000
for the phase two expansion plan. The presence of higher amount of retained earnings would
eliminate the necessity to take large amount of bank loans which would reduce overall risk
and leverage. Therefore, the decision of not paying dividend is justified (Caliskan and
Doukas 2015).
Part 3: Investment Appraisal and Sources of Finance
3.1 Investment Appraisal
Management Forecast
It can be seen from Exhibit 3 that the management of Roast Ltd has forecasted the
generation of revenue from year 1 to year 5 as £300000, £560000, £740000£, £900000 and
£1120000 respectively. At the same time, it can be seen that the management has used
payback period, accounting rate of return (ARR) and net present value (NPV) investment
appraisal methods with the aim to appraise the investment option. As per the payback period
method, Roast Ltd will be able in recovering the amount of initial investment at the end of the
fourth year. As per the ARR method, the company will be able in generating a cash flows of
£724000 at the end of the fifth year. As per the NPV method, Roast Ltd will be able in
generating positive present value at the end of the fifth year. All these aspects are favorable
for Roast Ltd. However, in case there is any mistake in the forecast of the management of
Roast Ltd, the results of these capital appraisal method could be different (Goodman et al.
2013).
Investment appraisal Techniques
Payback Period
Payback period is considered as the time takes for the cash flows of income from a
specific project in order to cover the initial investment. Projects with shorter payback are
11FINANCE MANAGEMENT
considered by the companies and the payback period is four years in case of Roast Ltd. The
major advantage of this capital appraisal method is that this is a simple method to use and it
provides quick solution. However, the major disadvantage is that this method does not
consider the time value of money and this can create limitation on the management forecast
of Roast Ltd. At the same time, the profitability of projects is also ignored under this method
(Gorshkov et al. 2014).
Accounting Rate of Return
ARR can be considered as an investment formula that is used for measuring the
annual earnings of an investment is expected to make. In case of Roast Ltd, the company will
make 10% of return from the investment. The main advantage is that this method is easy to
use and takes into consideration the concert of net earnings after tax and depreciation. Most
importantly, this method makes it able in comparing the new product project with the cost of
reducing project. The main disadvantage is that this technique also ignores the time value of
money factor and it is not possible to ascertain the fair rate of return based on ARR (Bora
2015).
Net Present Value
NPV is a discounted cash flow method utilized in capital budgeting in order to
determine the viability of an investment project. It is the difference between the present value
of cash inflows and present value of cash outflows. Since a positive NPV denotes good
return, the decision of the management of Roast Ltd based on the NPV result can be
considered as correct. The main advantage of this investment appraisal technique is that this
considers the time value of money factor and this provides major assistance in decision-
making. However, in case of disadvantage, it needs to be mentioned that there is not any set
guidelines for determining required rate of return (Bora 2015).
⊘ This is a preview!⊘
Do you want full access?
Subscribe today to unlock all pages.
Trusted by 1+ million students worldwide
1 out of 17
Related Documents


Your All-in-One AI-Powered Toolkit for Academic Success.
+13062052269
info@desklib.com
Available 24*7 on WhatsApp / Email
![[object Object]](/_next/static/media/star-bottom.7253800d.svg)
Unlock your academic potential
Copyright © 2020–2026 A2Z Services. All Rights Reserved. Developed and managed by ZUCOL.