Analyzing Starbucks' Financial Health: A Case Study Using Ratios

Verified

Added on  2023/06/11

|4
|541
|286
Case Study
AI Summary
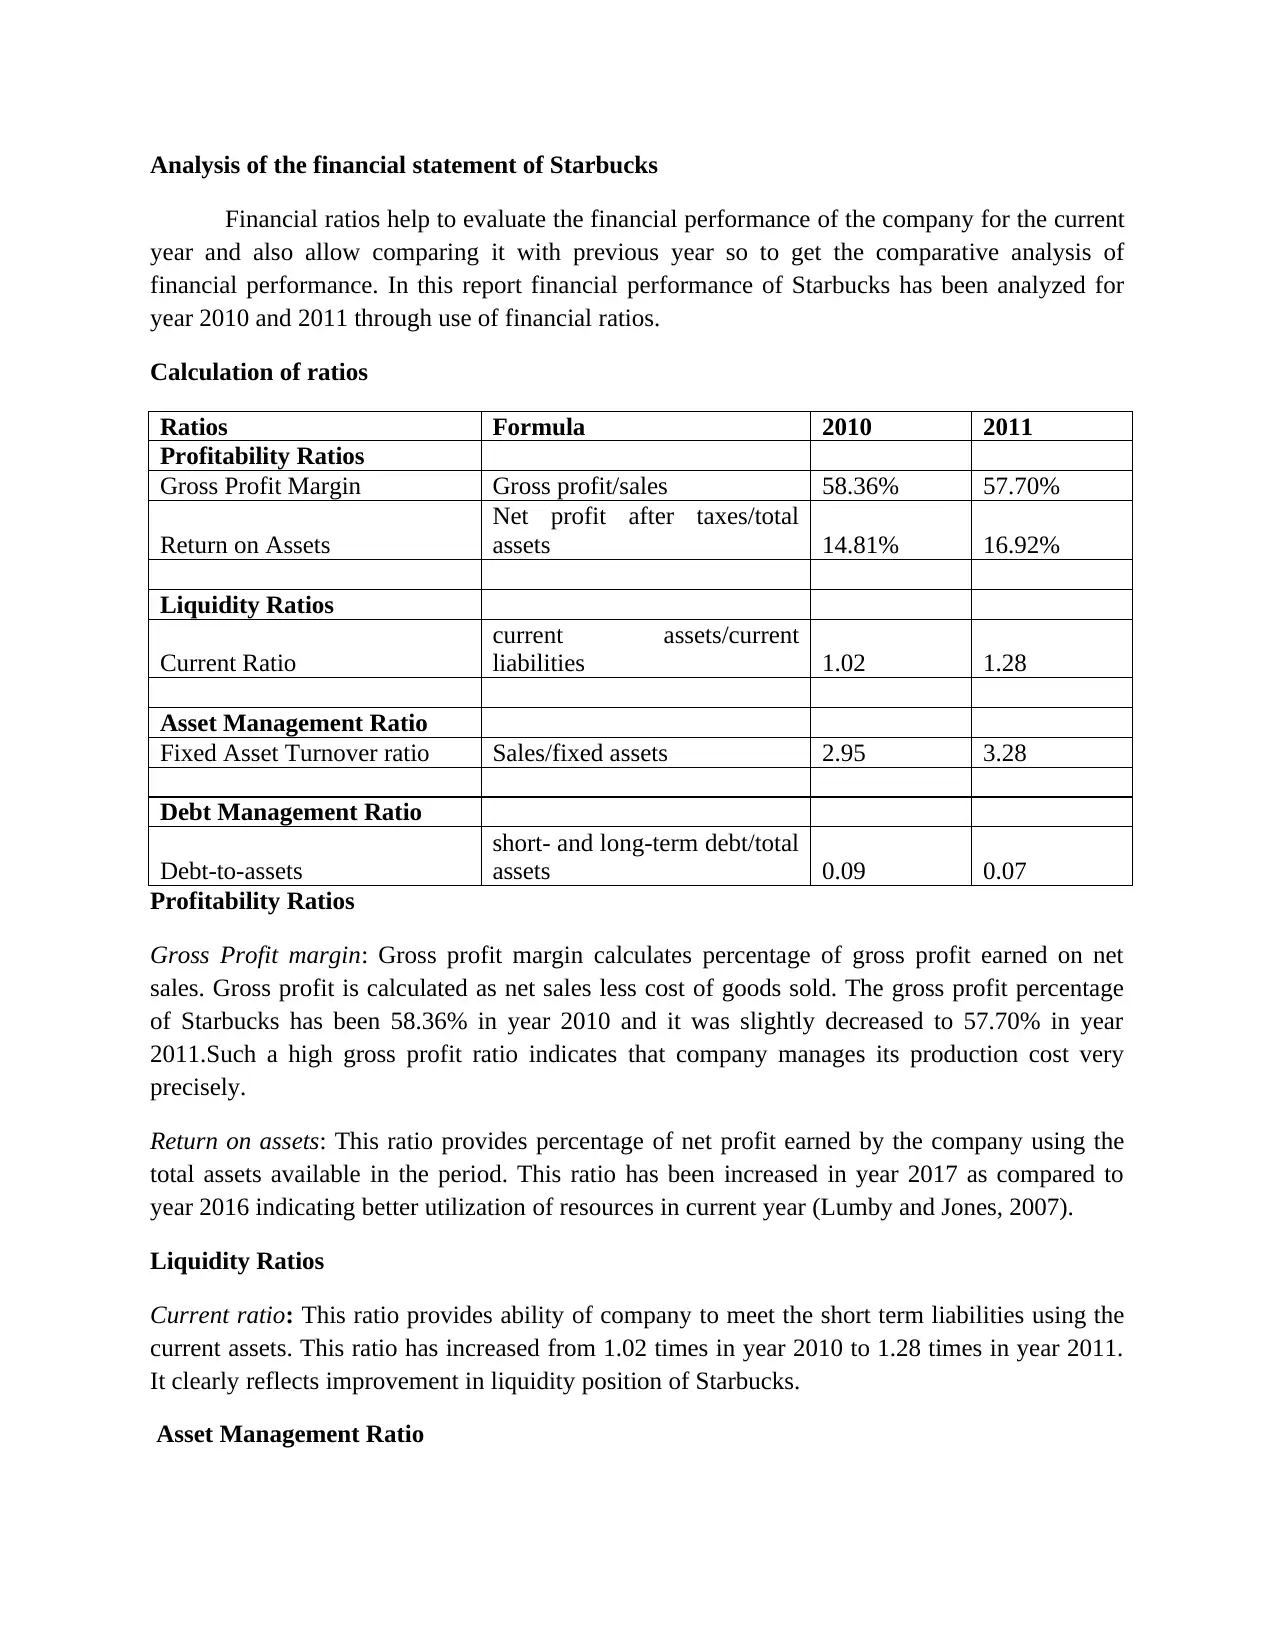
This case study provides a financial analysis of Starbucks, focusing on key financial ratios for the years 2010 and 2011. It examines profitability ratios such as gross profit margin and return on assets, liquidity ratios like the current ratio, asset management ratios including fixed asset turnover, and debt management ratios such as debt-to-assets. The analysis indicates that while Starbucks maintained a high gross profit margin, its return on assets improved from 2010 to 2011. The current ratio also showed improvement in liquidity. Furthermore, the efficiency of utilizing fixed assets to generate revenue increased, and there was a positive shift in the capital structure with a decrease in the debt-to-assets ratio, suggesting a stronger financial position in 2011 compared to 2010.
Document Page
Analysis of the financial statement of Starbucks
Financial ratios help to evaluate the financial performance of the company for the current
year and also allow comparing it with previous year so to get the comparative analysis of
financial performance. In this report financial performance of Starbucks has been analyzed for
year 2010 and 2011 through use of financial ratios.
Calculation of ratios
Ratios Formula 2010 2011
Profitability Ratios
Gross Profit Margin Gross profit/sales 58.36% 57.70%
Return on Assets
Net profit after taxes/total
assets 14.81% 16.92%
Liquidity Ratios
Current Ratio
current assets/current
liabilities 1.02 1.28
Asset Management Ratio
Fixed Asset Turnover ratio Sales/fixed assets 2.95 3.28
Debt Management Ratio
Debt-to-assets
short- and long-term debt/total
assets 0.09 0.07
Profitability Ratios
Gross Profit margin: Gross profit margin calculates percentage of gross profit earned on net
sales. Gross profit is calculated as net sales less cost of goods sold. The gross profit percentage
of Starbucks has been 58.36% in year 2010 and it was slightly decreased to 57.70% in year
2011.Such a high gross profit ratio indicates that company manages its production cost very
precisely.
Return on assets: This ratio provides percentage of net profit earned by the company using the
total assets available in the period. This ratio has been increased in year 2017 as compared to
year 2016 indicating better utilization of resources in current year (Lumby and Jones, 2007).
Liquidity Ratios
Current ratio: This ratio provides ability of company to meet the short term liabilities using the
current assets. This ratio has increased from 1.02 times in year 2010 to 1.28 times in year 2011.
It clearly reflects improvement in liquidity position of Starbucks.
Asset Management Ratio
tabler-icon-diamond-filled.svg

Paraphrase This Document

Need a fresh take? Get an instant paraphrase of this document with our AI Paraphraser
Document Page
Fixed Asset Turnover ratio: This ratio shows the efficiency of company to use the fixed assets
for earning the revenue. It has been seen that this ratio has been increased from 2.95 times in
year 2010 to 3.28 times in year 2011, which means company has improved its efficiency to
utilize the fixed assets in order to earn the sales revenue (Brigham and Michael, 2013).
Debt Management Ratio
Debt-to-assets: This ratio provides information related to the capital structure of the company.
This ratio tells how much assets have been financed using the debt capital. It has been seen from
the above that this ratio has been decreased in year 2011 as compared to year 2010. It means
there was improvement in capital structure of the Starbuck in year 2011 as compared to year
2010.
Document Page
References
Brigham, F., and Michael C. 2013. Financial management: Theory & practice. Cengage
Learning.
Lumby,S and Jones,C. 2007. Corporate finance theory & practice. Thomson.
Document Page
Appendix
Financial Data of Starbucks
Items 2010 2011
Gross Profit $ 6,248.80 $ 6,751.10
Sales $ 10,707.40 $ 11,700.40
Net Profit after tax $ 945.60 $ 1,245.70
Total Assets $ 6,385.90 $ 7,360.40
Current assets $ 2,756.50 $ 3,794.90
Current liabilities $ 2,703.60 $ 2,973.10
Fixed assets $ 3,629.40 $ 3,565.50
Short- and long-term debt $ 549.40 $ 549.50
chevron_up_icon
1 out of 4
circle_padding
hide_on_mobile
zoom_out_icon
[object Object]