MBA Marketing Analysis: Starbucks Consumer Behavior in Singapore
VerifiedAdded on 2023/06/08
|16
|2920
|243
Report
AI Summary
This report presents a marketing analysis of Starbucks in Singapore, focusing on consumer behavior and purchasing decisions. The study, based on a survey of 201 Starbucks customers, aims to identify consumer demographics, significant factors influencing purchasing behavior, and the relationship between marketing communications and purchase decisions. Key findings reveal that females aged 18-24 with average incomes are the most frequent visitors. Correlation analysis highlights the importance of factors like visit frequency, expenditure, promotions, and product quality on purchase behavior. Regression analysis indicates that marketing communications, particularly sales and promotions, can predict consumer purchasing behavior. The research concludes with recommendations for Starbucks to enhance its marketing strategies and improve customer engagement in Singapore's competitive coffee market. The analysis utilizes SPSS software for statistical analysis, providing valuable insights into the coffee culture's dynamics and consumer preferences.
Running Head: MARKETING ANALYSIS
Marketing Analysis
Name of the Student
Name of the University
Student ID
Marketing Analysis
Name of the Student
Name of the University
Student ID
Paraphrase This Document
Need a fresh take? Get an instant paraphrase of this document with our AI Paraphraser
1MARKETING ANALYSIS
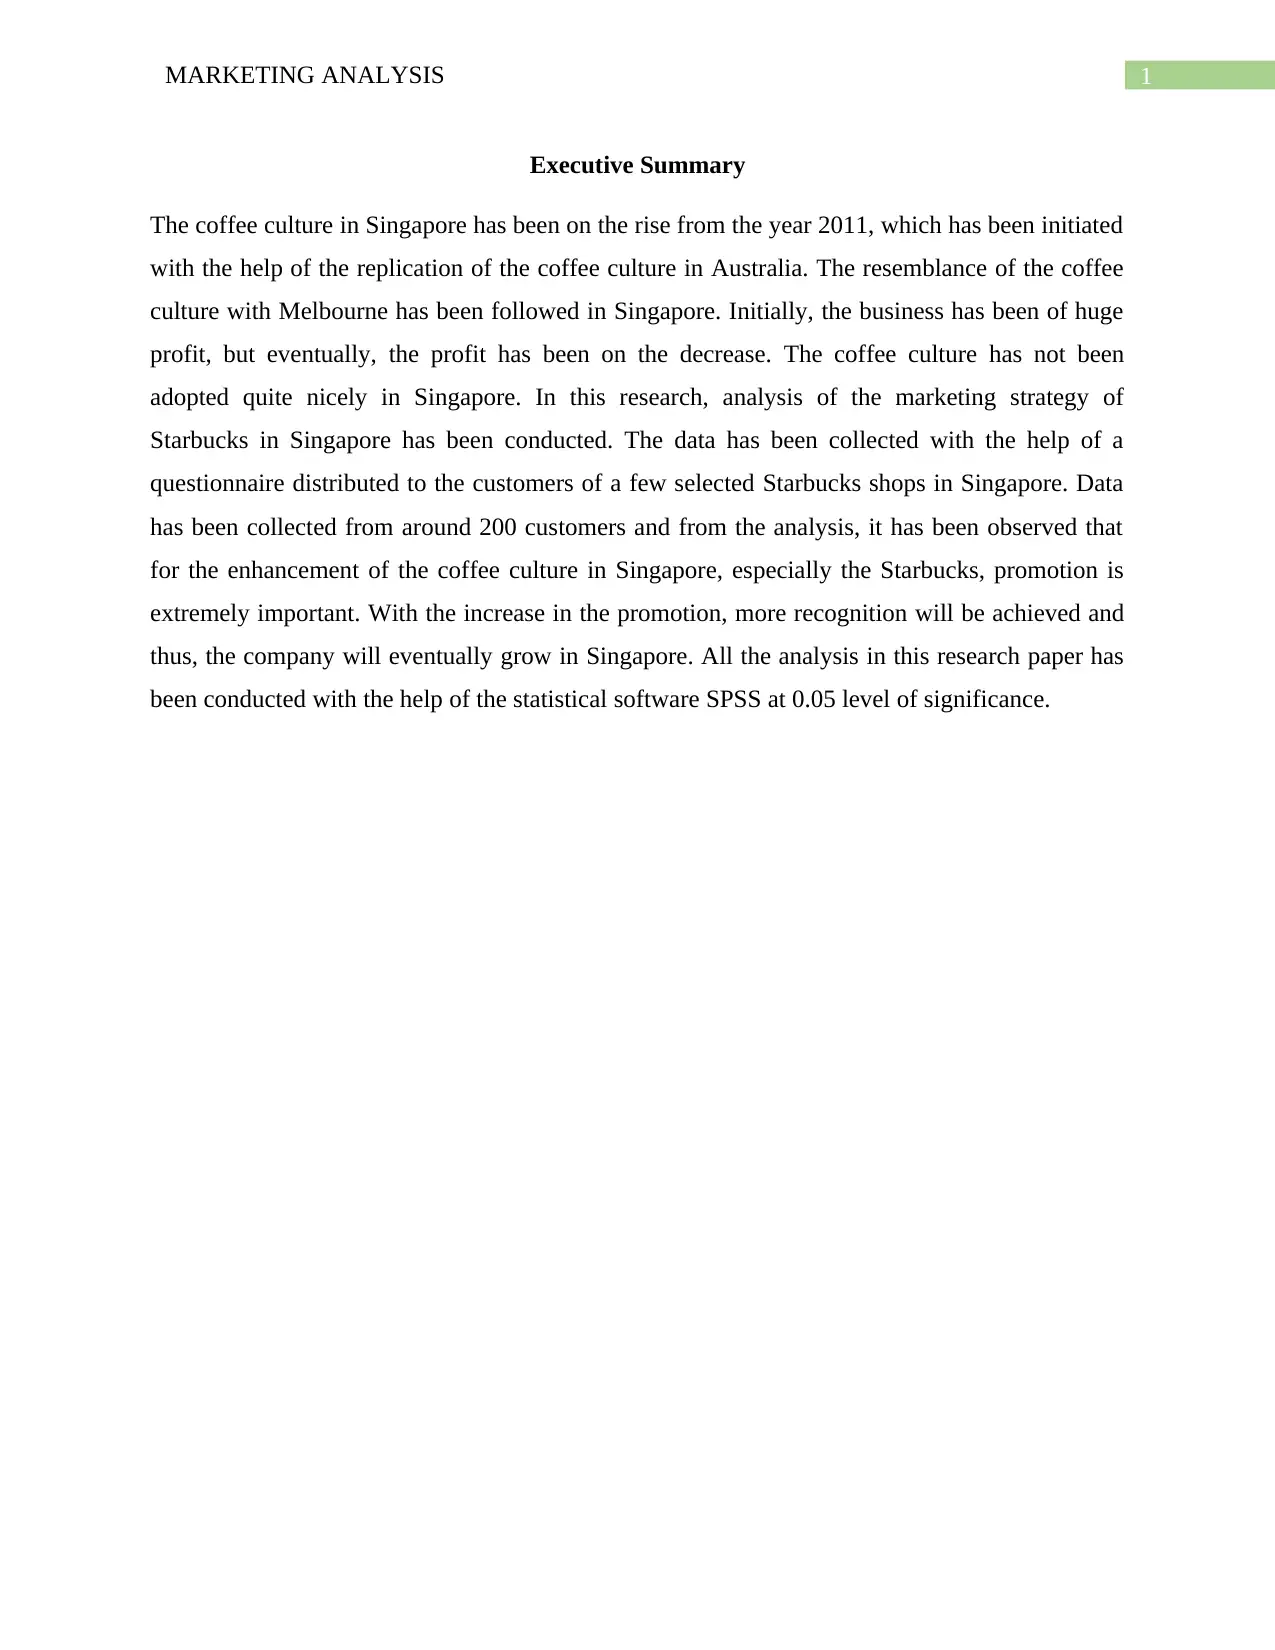
Executive Summary
The coffee culture in Singapore has been on the rise from the year 2011, which has been initiated
with the help of the replication of the coffee culture in Australia. The resemblance of the coffee
culture with Melbourne has been followed in Singapore. Initially, the business has been of huge
profit, but eventually, the profit has been on the decrease. The coffee culture has not been
adopted quite nicely in Singapore. In this research, analysis of the marketing strategy of
Starbucks in Singapore has been conducted. The data has been collected with the help of a
questionnaire distributed to the customers of a few selected Starbucks shops in Singapore. Data
has been collected from around 200 customers and from the analysis, it has been observed that
for the enhancement of the coffee culture in Singapore, especially the Starbucks, promotion is
extremely important. With the increase in the promotion, more recognition will be achieved and
thus, the company will eventually grow in Singapore. All the analysis in this research paper has
been conducted with the help of the statistical software SPSS at 0.05 level of significance.
2MARKETING ANALYSIS
Table of Contents
1.0 Introduction................................................................................................................................5
2.0 Results and Analysis..................................................................................................................6
2.1 Sample Profile.......................................................................................................................6
2.2 Correlation and Regression Analysis...................................................................................10
3.0 Discussion, Limitation and Recommendation.........................................................................13
References......................................................................................................................................15
⊘ This is a preview!⊘
Do you want full access?
Subscribe today to unlock all pages.
Trusted by 1+ million students worldwide
3MARKETING ANALYSIS
List of Tables
Table 1: Gender of Respondent....................................................................................................6
Table 2: : Age of respondent.........................................................................................................7
Table 3: Income of respondents....................................................................................................8
Table 4: Race of respondent.........................................................................................................9
Table 5: Correlation Matrix.......................................................................................................10
Table 6: Regression Analysis......................................................................................................11
Paraphrase This Document
Need a fresh take? Get an instant paraphrase of this document with our AI Paraphraser
4MARKETING ANALYSIS
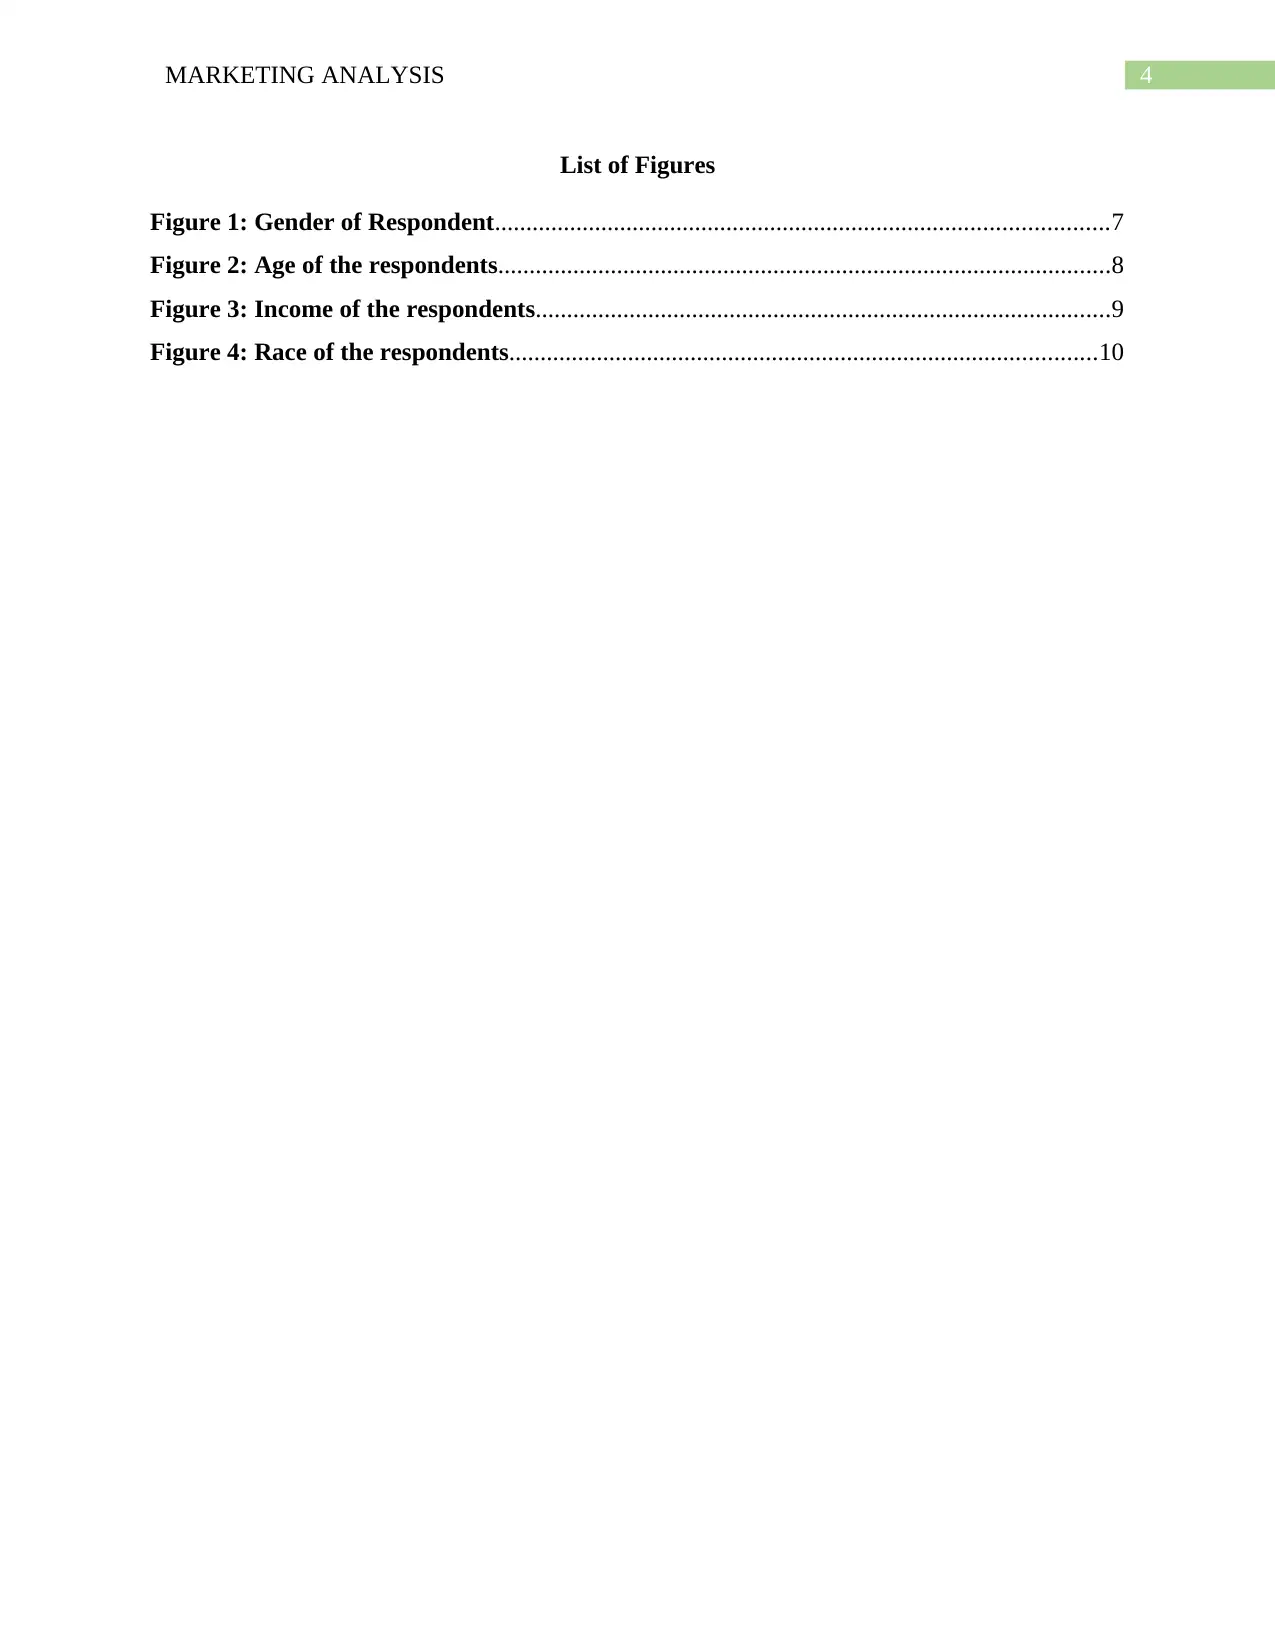
List of Figures
Figure 1: Gender of Respondent..................................................................................................7
Figure 2: Age of the respondents..................................................................................................8
Figure 3: Income of the respondents............................................................................................9
Figure 4: Race of the respondents..............................................................................................10
5MARKETING ANALYSIS
1.0 Introduction
The café culture has been on the start in Singapore from 2011. Before that, cafés were not
that common in Singapore. With an attempt to replicate the café setups in Melbourne, café
culture has been introduced in Singapore. Gradually, Singapore has seen increase in the number
of cafés each week. Today, in each and every neighborhood of Singapore, there can be found a
café. The introduction of the cafés and café cultures has brought about changes in the daily life
of the people in Singapore (Ng et al. 2018). There has been changes in the behavior of the
people. Along with brunch culture, the café hopping culture also started in the lives of the
people. Thus, instead of spending time in the malls, cafés have been found to be a better place to
hang out. With the increase in the coffee culture in Singapore, people gradually got introduced to
the third wave specialty coffee (Wong 2014).
The method of production of coffee by roasting beans, the specialty of barista, etc., are all
considered as artisanal methods of coffee production. These methods of production are also
scientific. The origin of the coffee beans that are used are traceable at times and thus, the
sustainable sourcing of the coffee has been considered as different from kopi (Pang 2018).
Gradually, small coffee shops like strangers Reunion, Common man coffee roasters, Nylon
coffee roasters etc., set up their own cafes and have named their shops as per their interests.
These types of coffees have been popular initially in Singapore. Gradually, the coffee culture in
Singapore shifted to bear a resemblance to stale bread from the resemblance of the lively coffee
culture adopted from Melbourne (Biswas-Tortajada and Biswas 2015).
Thus, with the initial increase in the coffee culture, the business gradually began to fall.
From the starting till 6 years, the coffee culture in Singapore has been of huge demand. After
that, the demand for cafés started to decrease. Thus, there has been more cafes popping up in the
streets of Singapore but the rate of increase has fallen significantly (Abbas, Ibrahim and Kadhim
2016). According to some researchers, the planning and the views of the café culture in
Singapore was not up to the date. The starting of most of the coffee companies have been small
and the companies has no view of expanding. The cafés have eventually found out that they do
not have enough sales to have a turnover which can enhance them for the growth of the
companies (Williams 2015). Thus, the capacity of each of the companies was less and they were
unable to expand when necessary.
⊘ This is a preview!⊘
Do you want full access?
Subscribe today to unlock all pages.
Trusted by 1+ million students worldwide
6MARKETING ANALYSIS
This research is mainly based on the marketing analysis of the coffee shop Starbucks.
With reference to the discussion on the coffee market in Singapore, the following are the
objectives of this research study:
To identify what are the demographic and behavioral profiles of the consumers of
Starbucks.
To identify the factors that are significant for purchasing behavior of the consumers.
To establish the relationship between the communications provided in the market with
the decision of purchase.
To provide suitable recommendations on the basis of the results obtained by analyzing
the data.
2.0 Results and Analysis
In order to conduct this research, some data has been collected from the consumers of
Starbucks in Singapore. The main aim of this research is to understand the purchasing behavior
of the consumers of this store. Thus, to conduct this research and for the purpose of the
collection of the data, a survey questionnaire has been prepared and distributed to some
randomly selected Starbucks stores in Singapore.
2.1 Sample Profile
From the distributed questionnaires, 201 responses have been returned, which will be
considered as valid for the research. There are though a lot of missing values in the data collected
as a result of the responses from the customers.
Paraphrase This Document
Need a fresh take? Get an instant paraphrase of this document with our AI Paraphraser
7MARKETING ANALYSIS
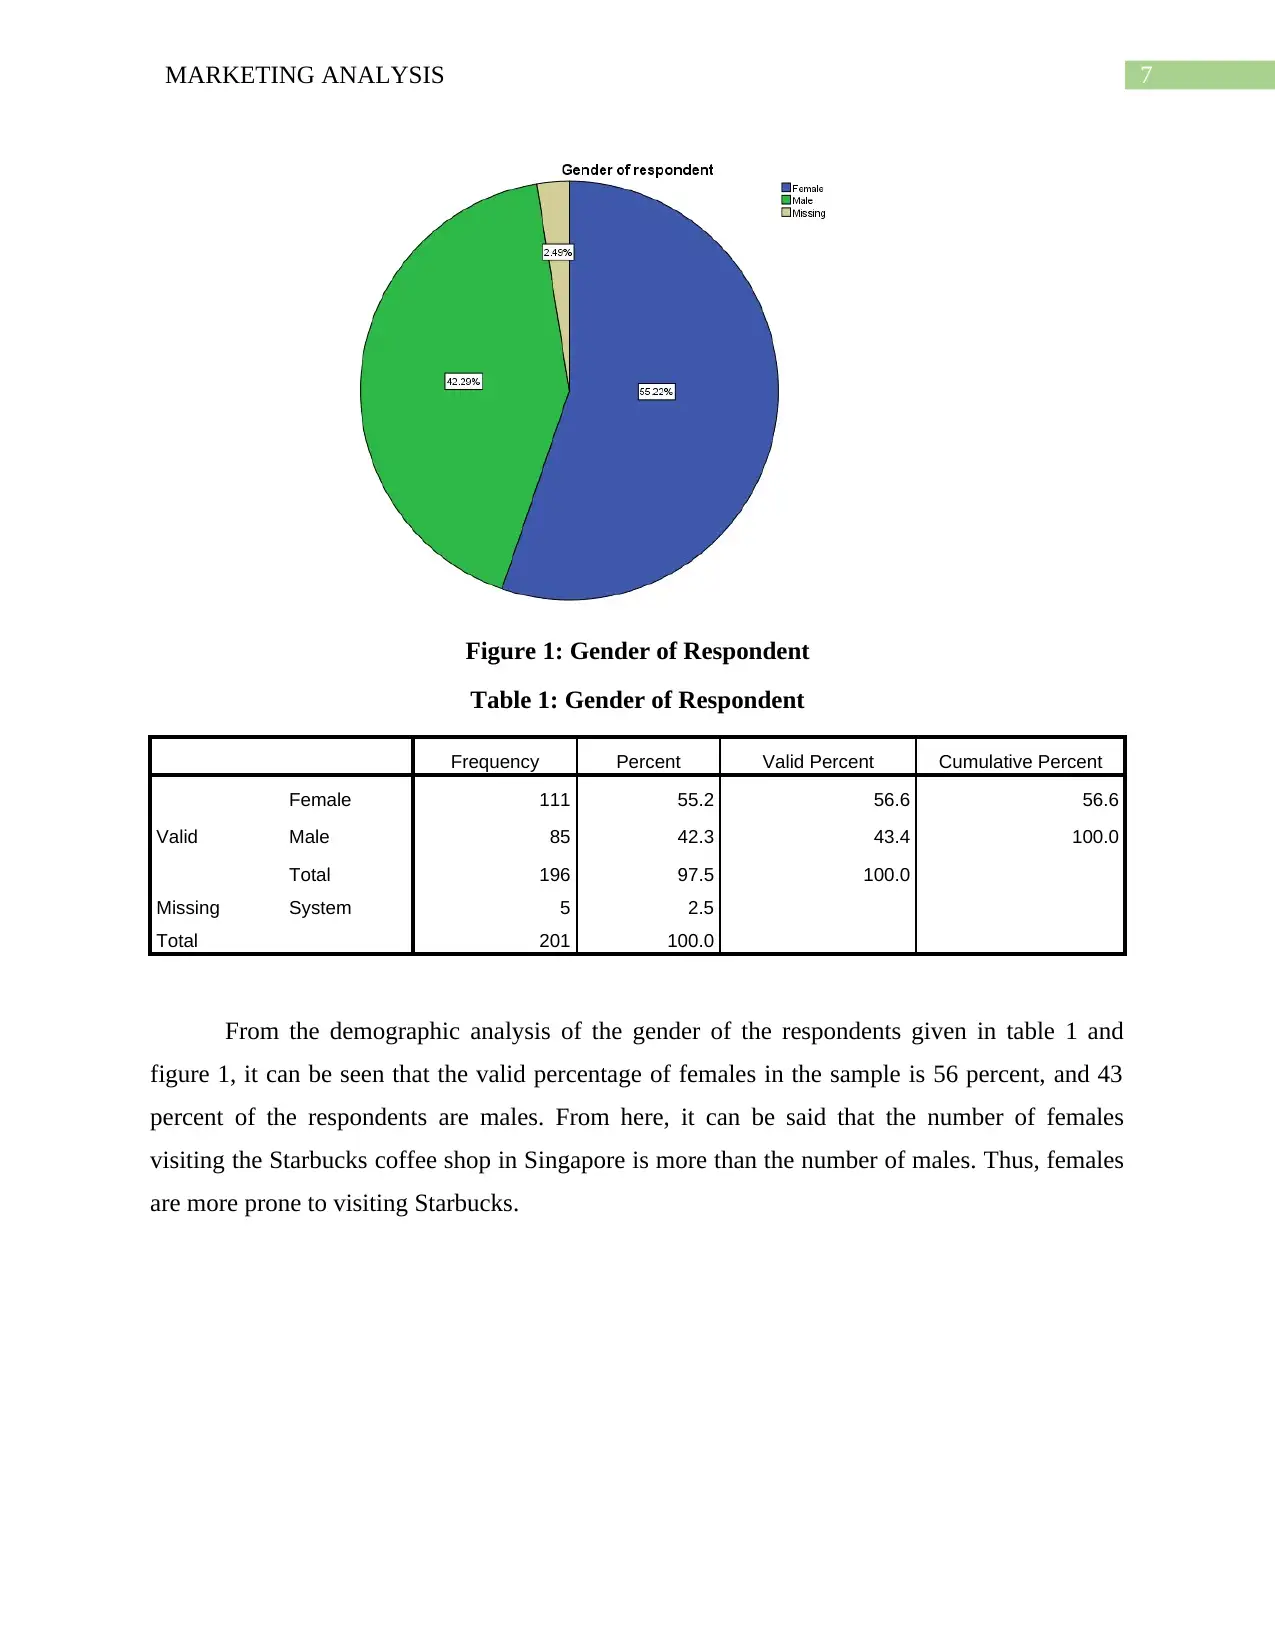
Figure 1: Gender of Respondent
Table 1: Gender of Respondent
Frequency Percent Valid Percent Cumulative Percent
Valid
Female 111 55.2 56.6 56.6
Male 85 42.3 43.4 100.0
Total 196 97.5 100.0
Missing System 5 2.5
Total 201 100.0
From the demographic analysis of the gender of the respondents given in table 1 and
figure 1, it can be seen that the valid percentage of females in the sample is 56 percent, and 43
percent of the respondents are males. From here, it can be said that the number of females
visiting the Starbucks coffee shop in Singapore is more than the number of males. Thus, females
are more prone to visiting Starbucks.
8MARKETING ANALYSIS
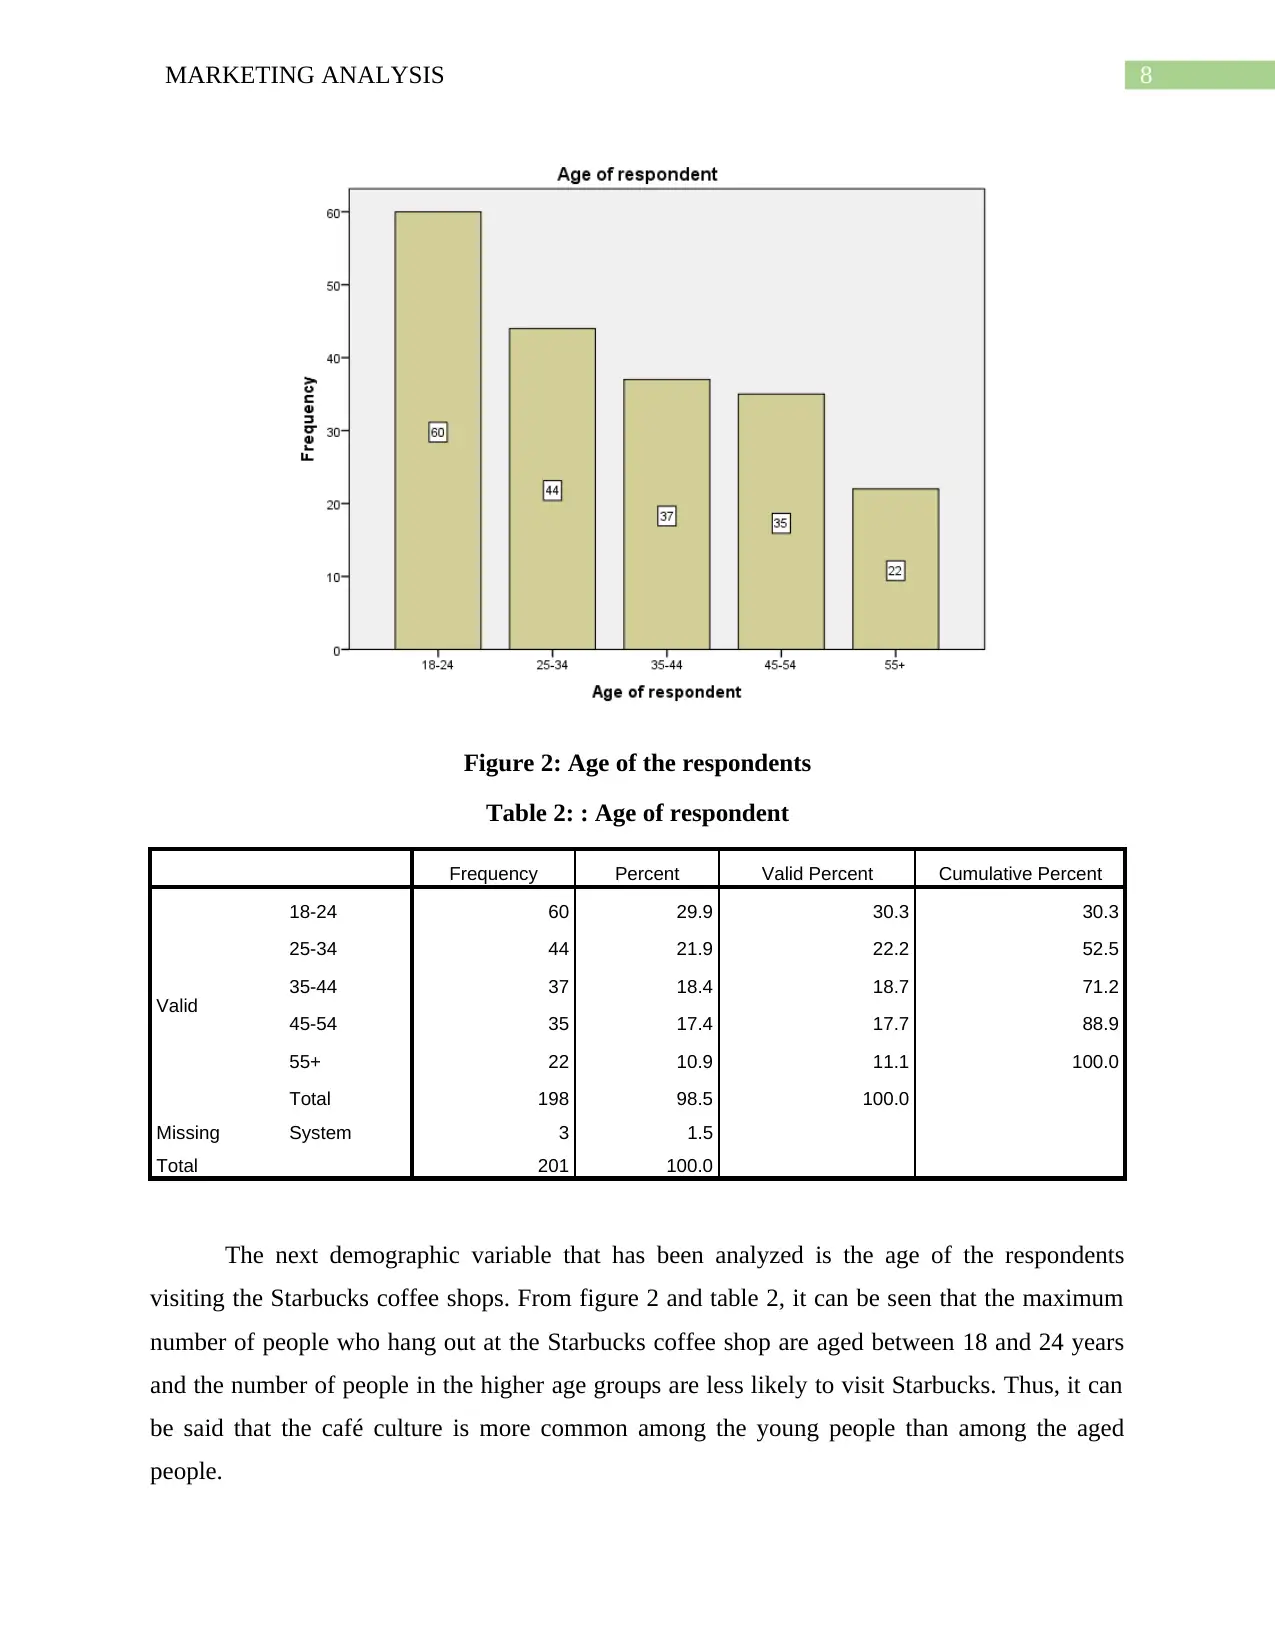
Figure 2: Age of the respondents
Table 2: : Age of respondent
Frequency Percent Valid Percent Cumulative Percent
Valid
18-24 60 29.9 30.3 30.3
25-34 44 21.9 22.2 52.5
35-44 37 18.4 18.7 71.2
45-54 35 17.4 17.7 88.9
55+ 22 10.9 11.1 100.0
Total 198 98.5 100.0
Missing System 3 1.5
Total 201 100.0
The next demographic variable that has been analyzed is the age of the respondents
visiting the Starbucks coffee shops. From figure 2 and table 2, it can be seen that the maximum
number of people who hang out at the Starbucks coffee shop are aged between 18 and 24 years
and the number of people in the higher age groups are less likely to visit Starbucks. Thus, it can
be said that the café culture is more common among the young people than among the aged
people.
⊘ This is a preview!⊘
Do you want full access?
Subscribe today to unlock all pages.
Trusted by 1+ million students worldwide
9MARKETING ANALYSIS
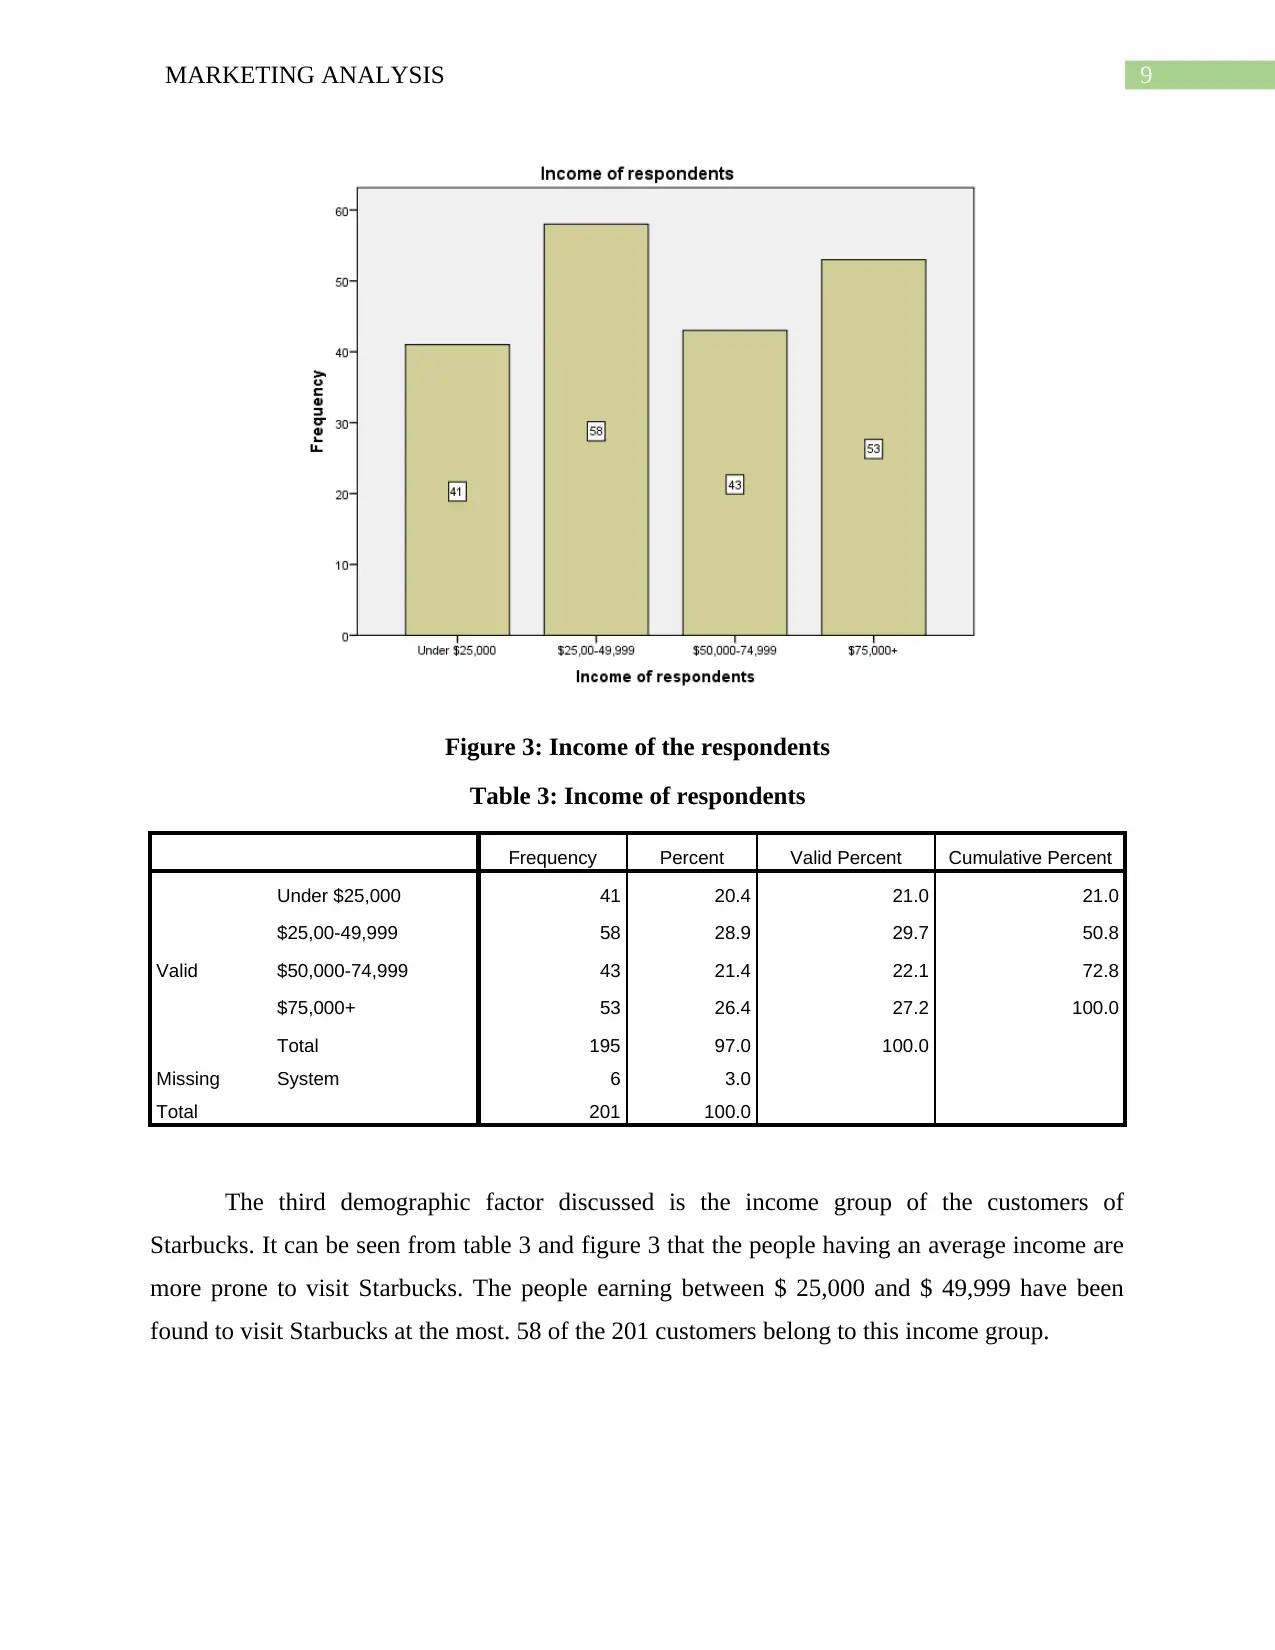
Figure 3: Income of the respondents
Table 3: Income of respondents
Frequency Percent Valid Percent Cumulative Percent
Valid
Under $25,000 41 20.4 21.0 21.0
$25,00-49,999 58 28.9 29.7 50.8
$50,000-74,999 43 21.4 22.1 72.8
$75,000+ 53 26.4 27.2 100.0
Total 195 97.0 100.0
Missing System 6 3.0
Total 201 100.0
The third demographic factor discussed is the income group of the customers of
Starbucks. It can be seen from table 3 and figure 3 that the people having an average income are
more prone to visit Starbucks. The people earning between $ 25,000 and $ 49,999 have been
found to visit Starbucks at the most. 58 of the 201 customers belong to this income group.
Paraphrase This Document
Need a fresh take? Get an instant paraphrase of this document with our AI Paraphraser
10MARKETING ANALYSIS
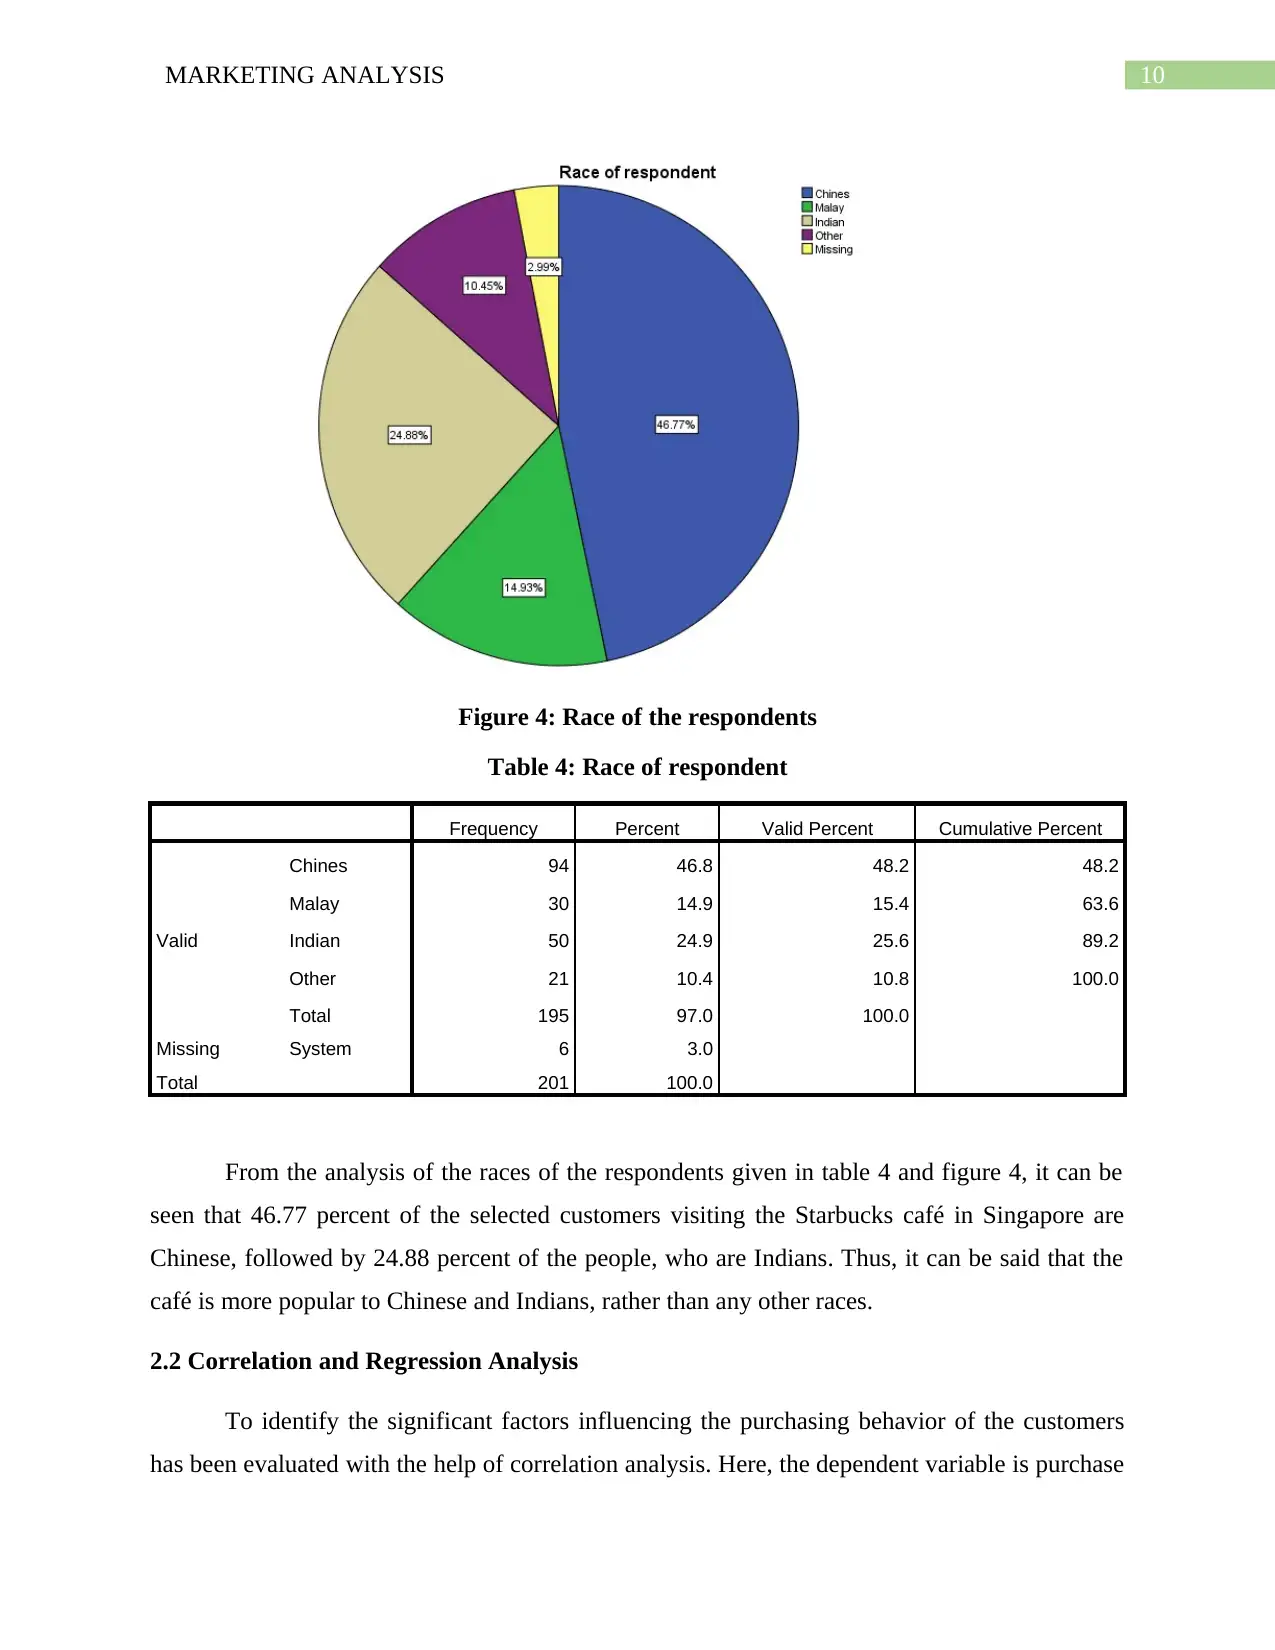
Figure 4: Race of the respondents
Table 4: Race of respondent
Frequency Percent Valid Percent Cumulative Percent
Valid
Chines 94 46.8 48.2 48.2
Malay 30 14.9 15.4 63.6
Indian 50 24.9 25.6 89.2
Other 21 10.4 10.8 100.0
Total 195 97.0 100.0
Missing System 6 3.0
Total 201 100.0
From the analysis of the races of the respondents given in table 4 and figure 4, it can be
seen that 46.77 percent of the selected customers visiting the Starbucks café in Singapore are
Chinese, followed by 24.88 percent of the people, who are Indians. Thus, it can be said that the
café is more popular to Chinese and Indians, rather than any other races.
2.2 Correlation and Regression Analysis
To identify the significant factors influencing the purchasing behavior of the customers
has been evaluated with the help of correlation analysis. Here, the dependent variable is purchase
11MARKETING ANALYSIS
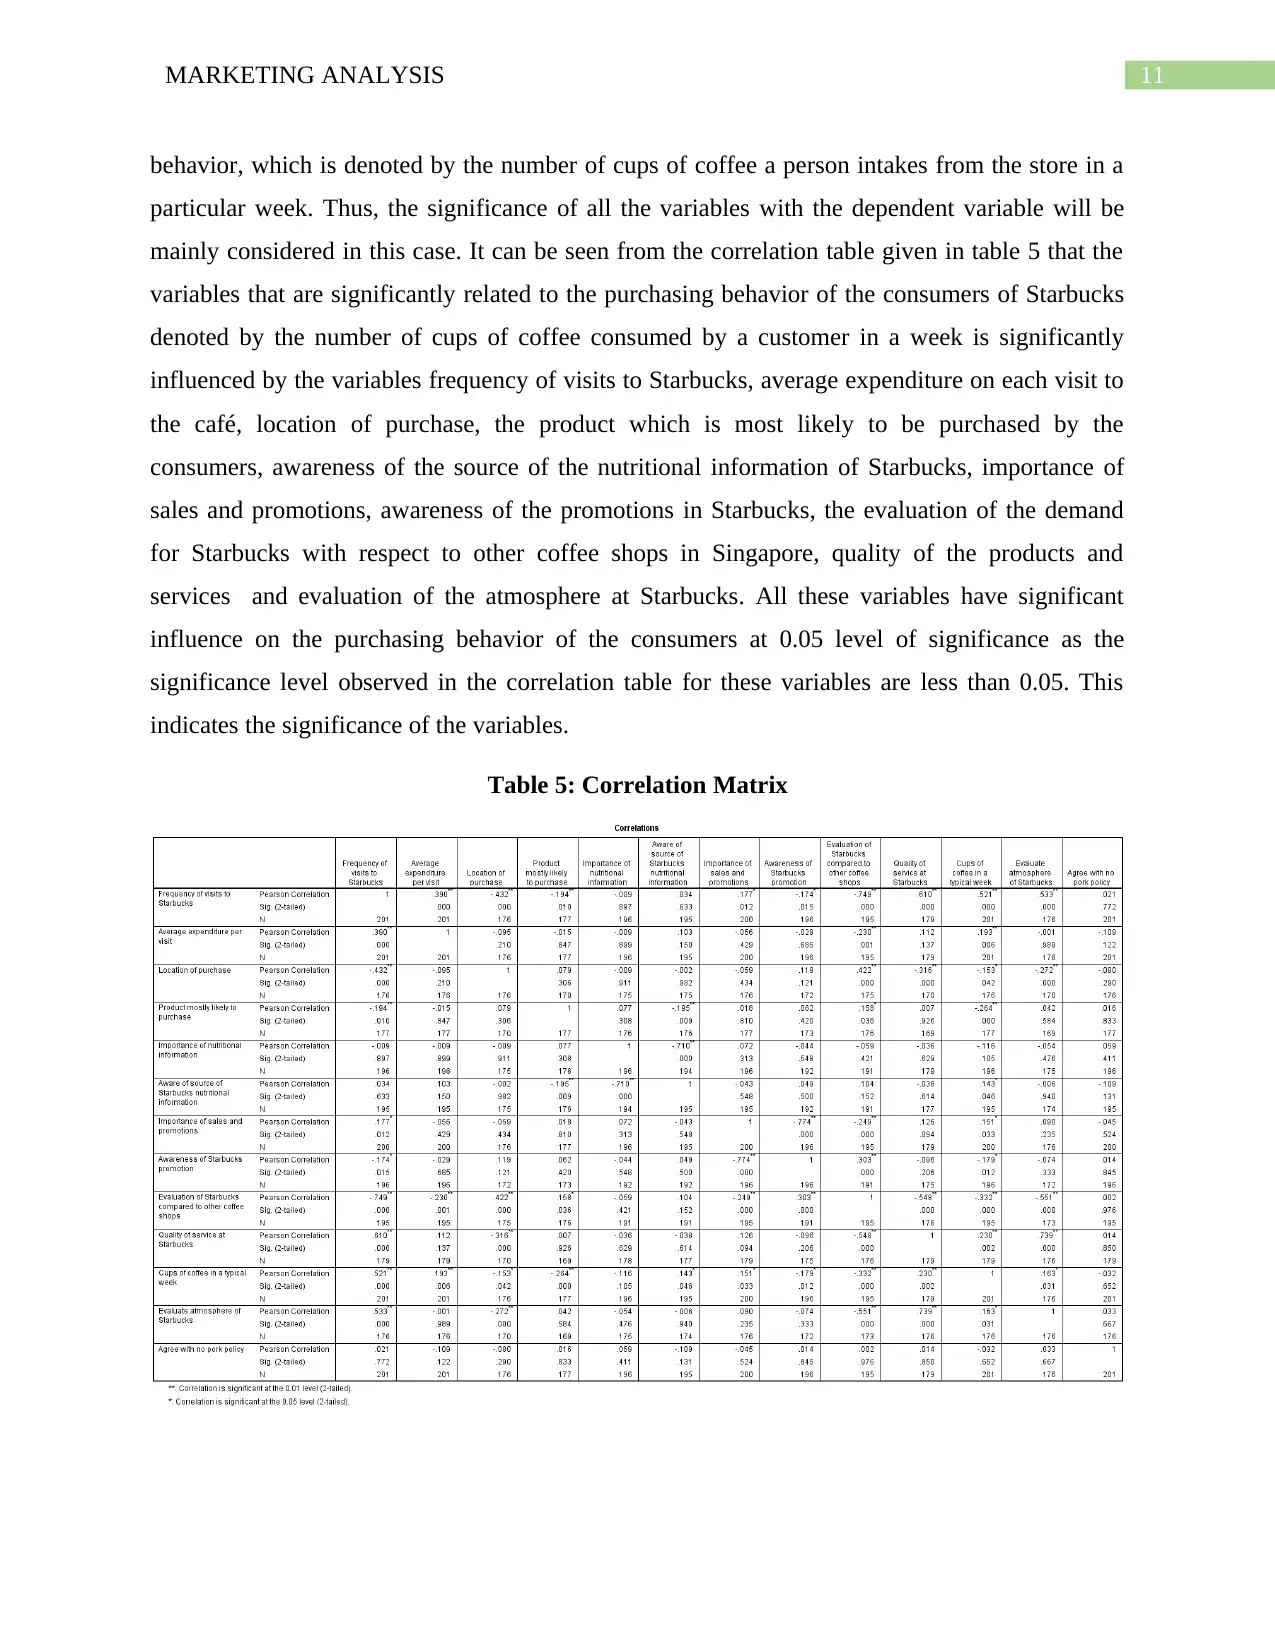
behavior, which is denoted by the number of cups of coffee a person intakes from the store in a
particular week. Thus, the significance of all the variables with the dependent variable will be
mainly considered in this case. It can be seen from the correlation table given in table 5 that the
variables that are significantly related to the purchasing behavior of the consumers of Starbucks
denoted by the number of cups of coffee consumed by a customer in a week is significantly
influenced by the variables frequency of visits to Starbucks, average expenditure on each visit to
the café, location of purchase, the product which is most likely to be purchased by the
consumers, awareness of the source of the nutritional information of Starbucks, importance of
sales and promotions, awareness of the promotions in Starbucks, the evaluation of the demand
for Starbucks with respect to other coffee shops in Singapore, quality of the products and
services and evaluation of the atmosphere at Starbucks. All these variables have significant
influence on the purchasing behavior of the consumers at 0.05 level of significance as the
significance level observed in the correlation table for these variables are less than 0.05. This
indicates the significance of the variables.
Table 5: Correlation Matrix
⊘ This is a preview!⊘
Do you want full access?
Subscribe today to unlock all pages.
Trusted by 1+ million students worldwide
1 out of 16
Your All-in-One AI-Powered Toolkit for Academic Success.
+13062052269
info@desklib.com
Available 24*7 on WhatsApp / Email
![[object Object]](/_next/static/media/star-bottom.7253800d.svg)
Unlock your academic potential
Copyright © 2020–2026 A2Z Services. All Rights Reserved. Developed and managed by ZUCOL.