HI6007: Statistical Analysis and Regression on Startup Costs

Verified

Added on  2020/04/01

|10
|409
|112
Report
AI Summary
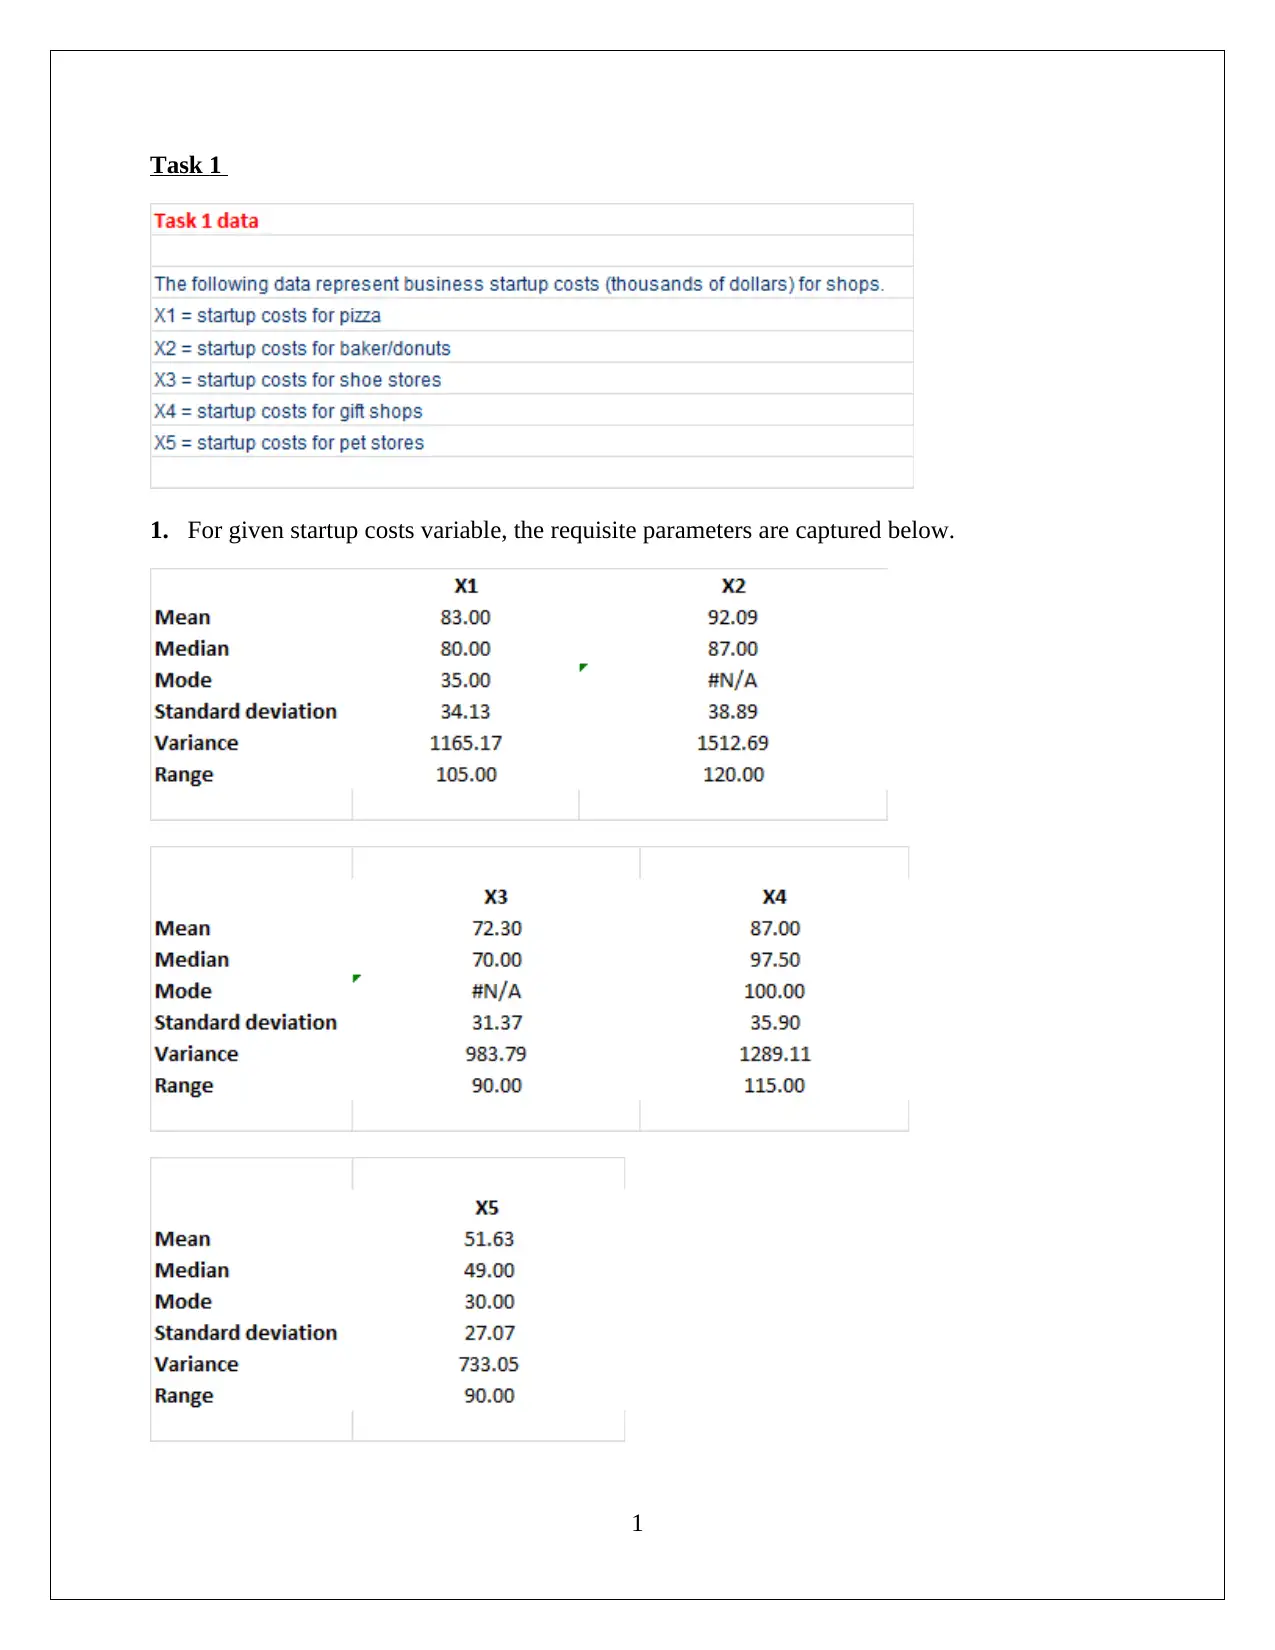
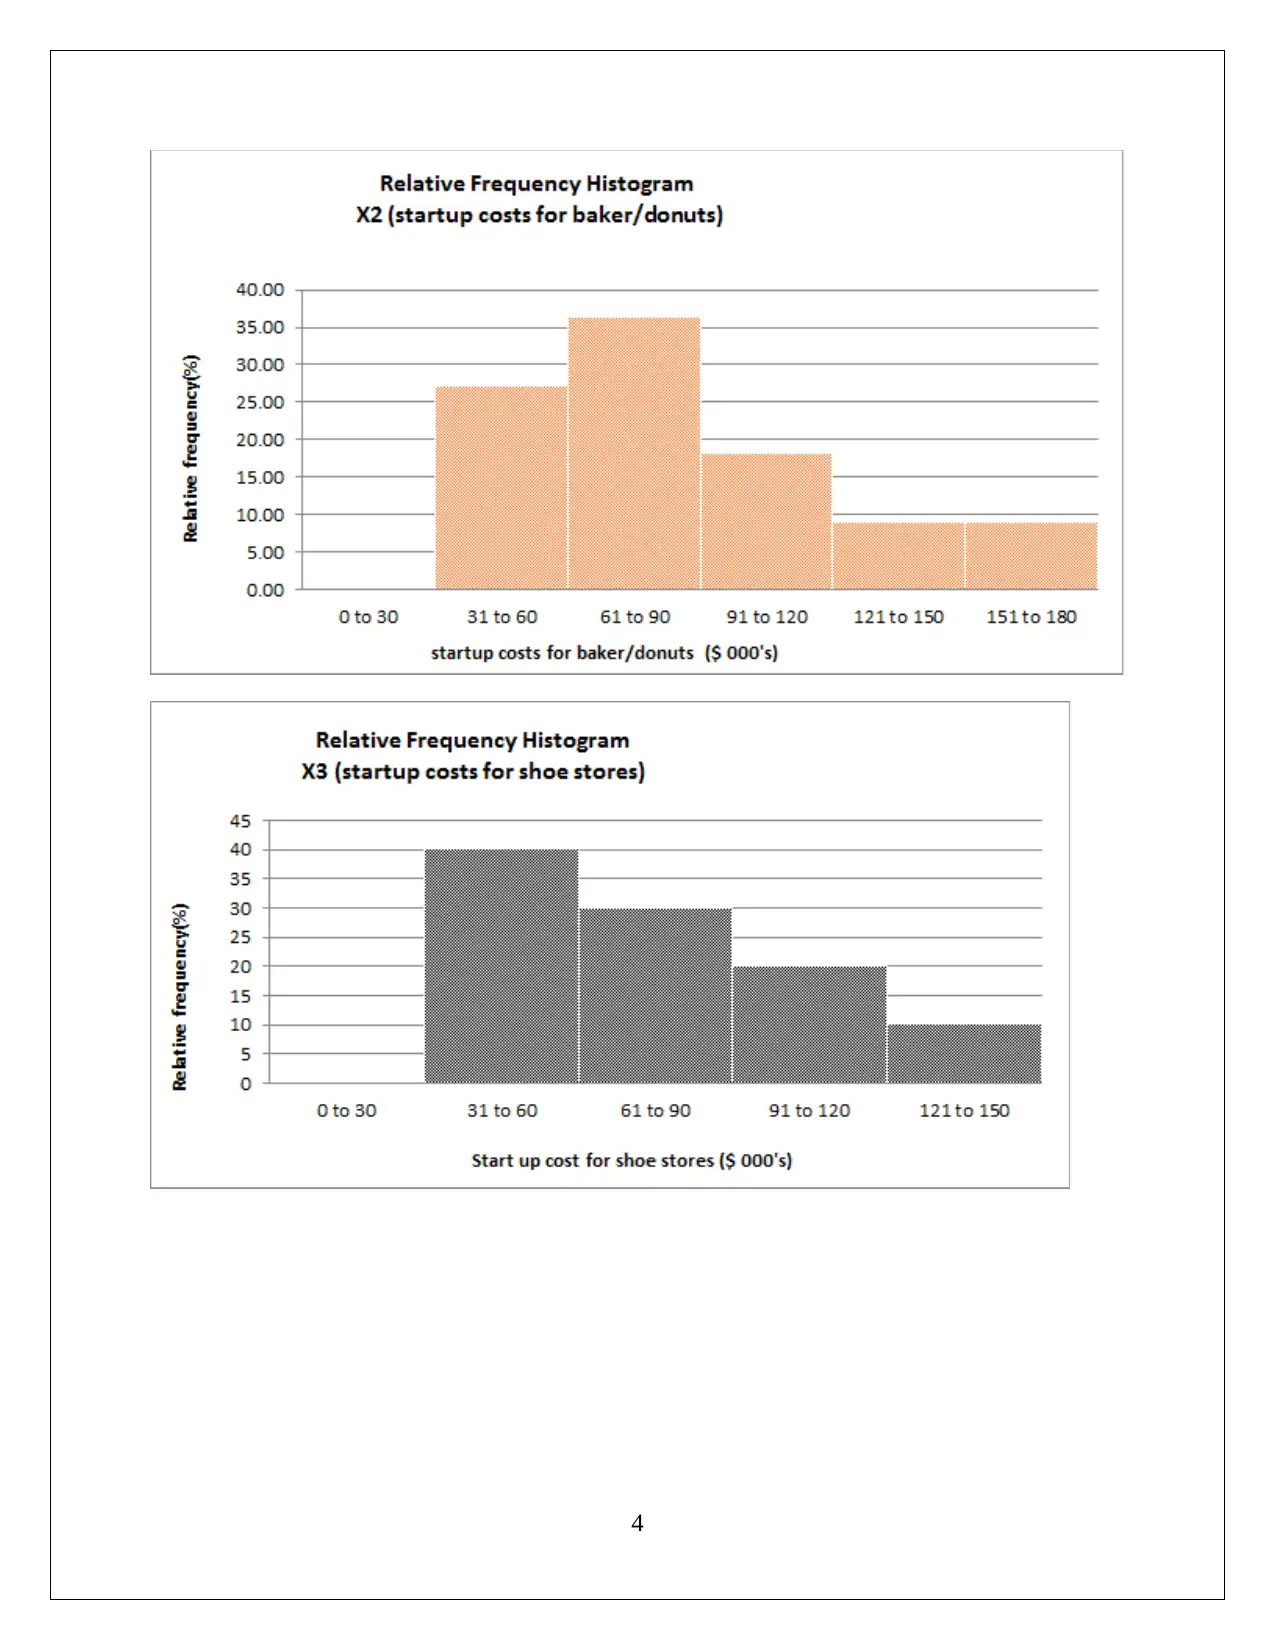
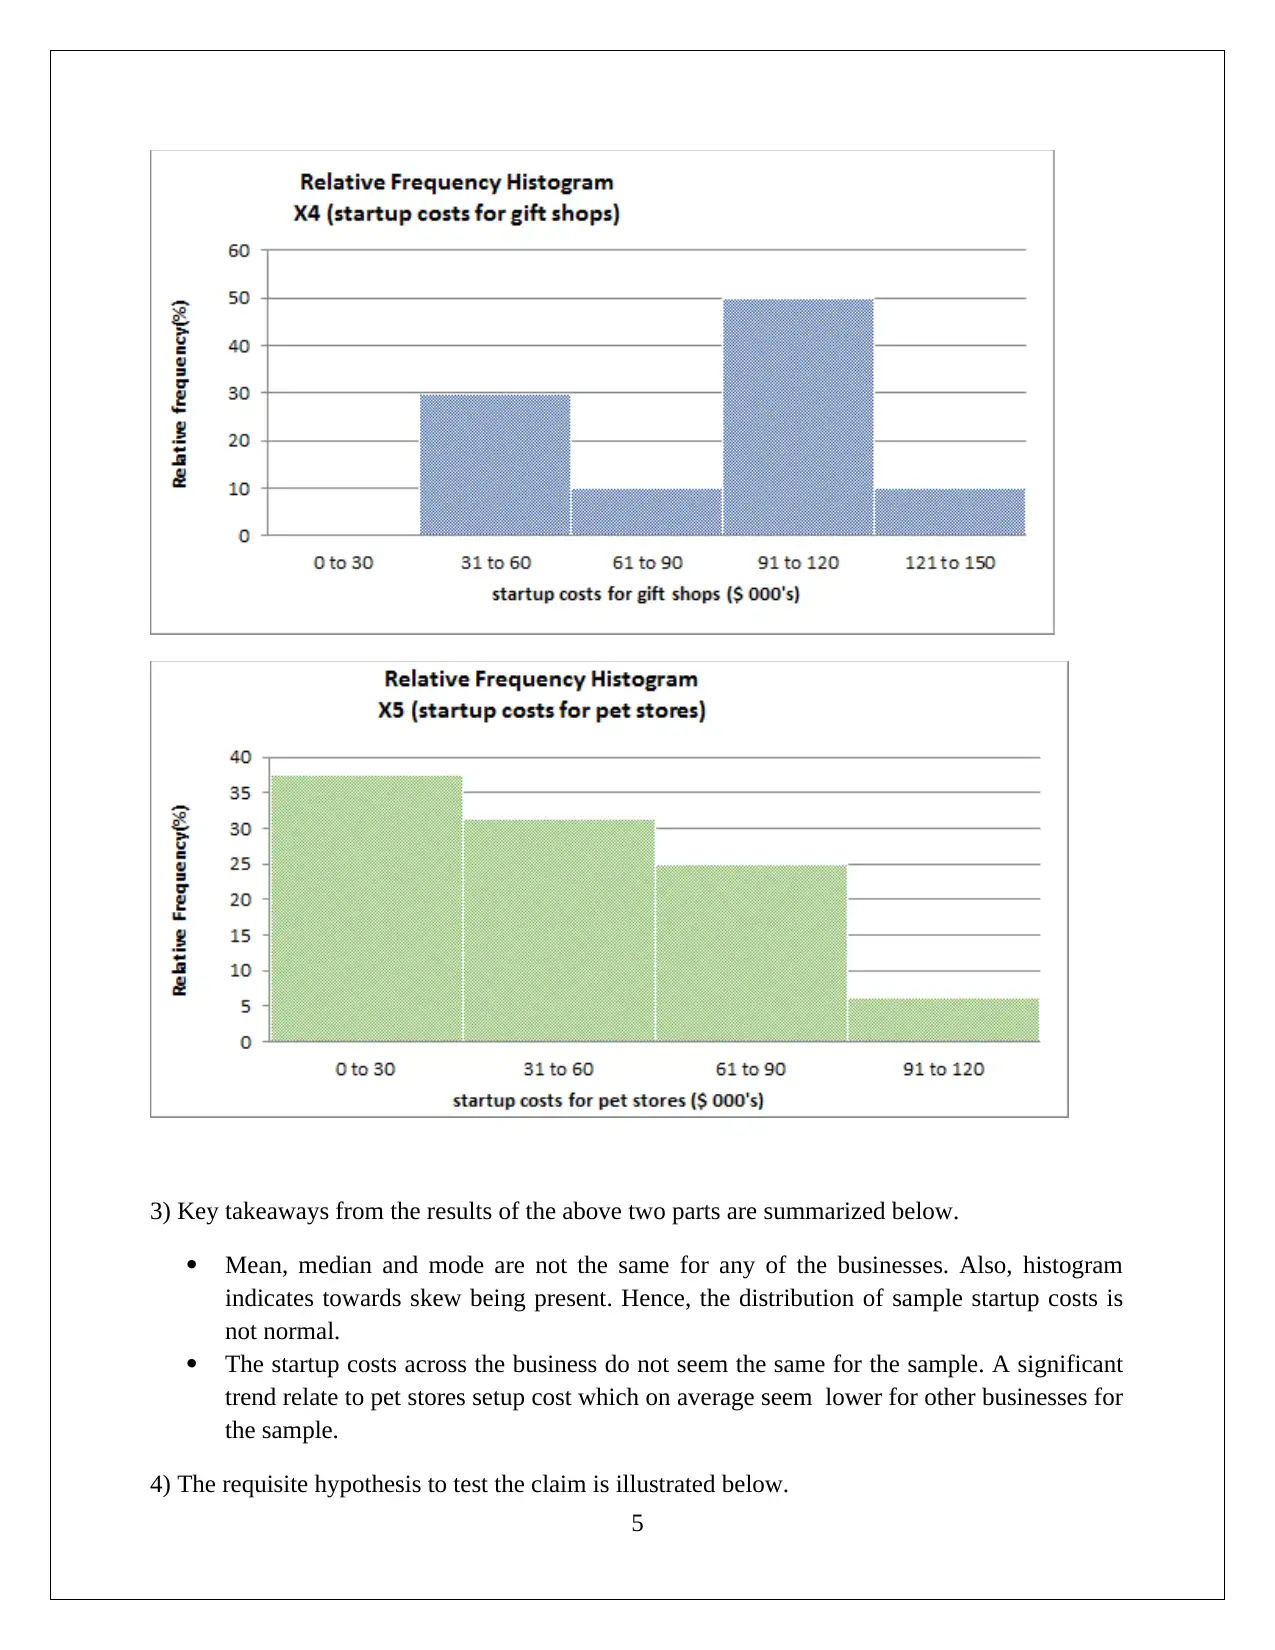
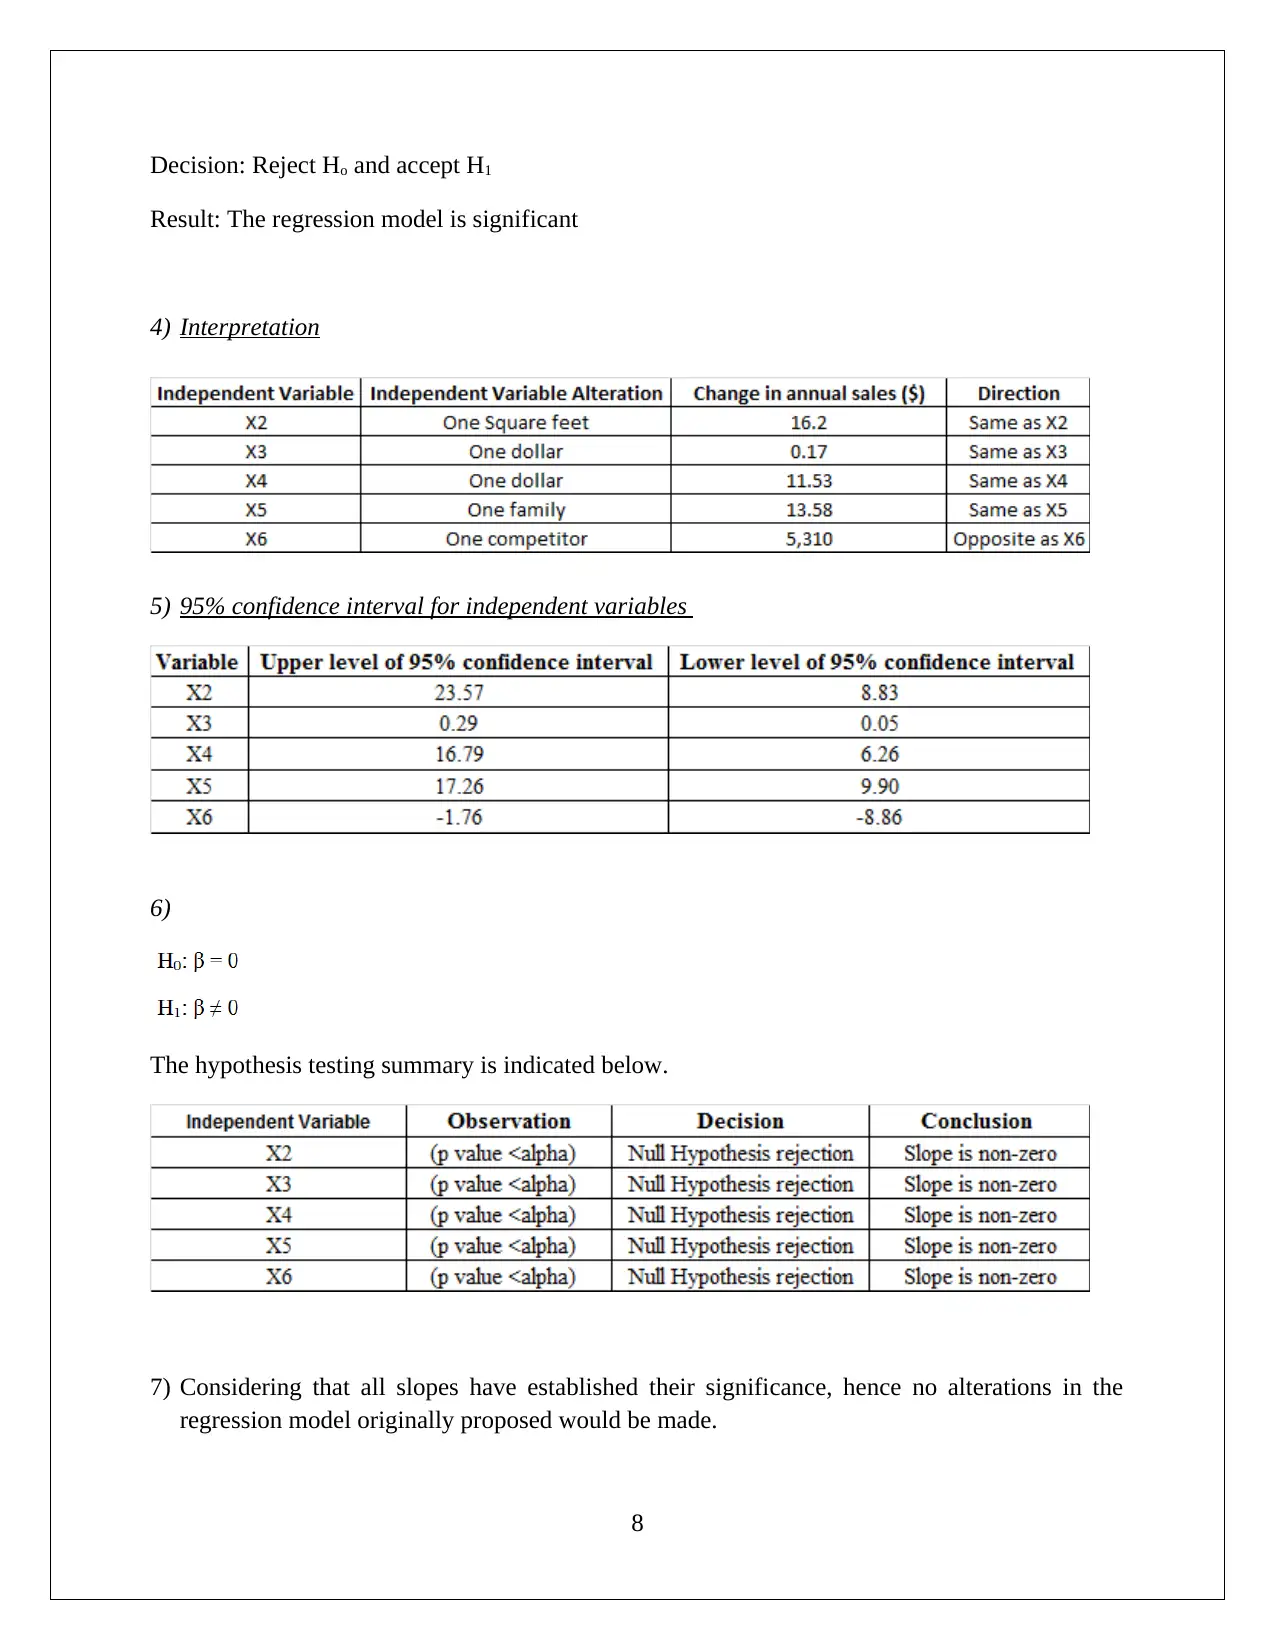
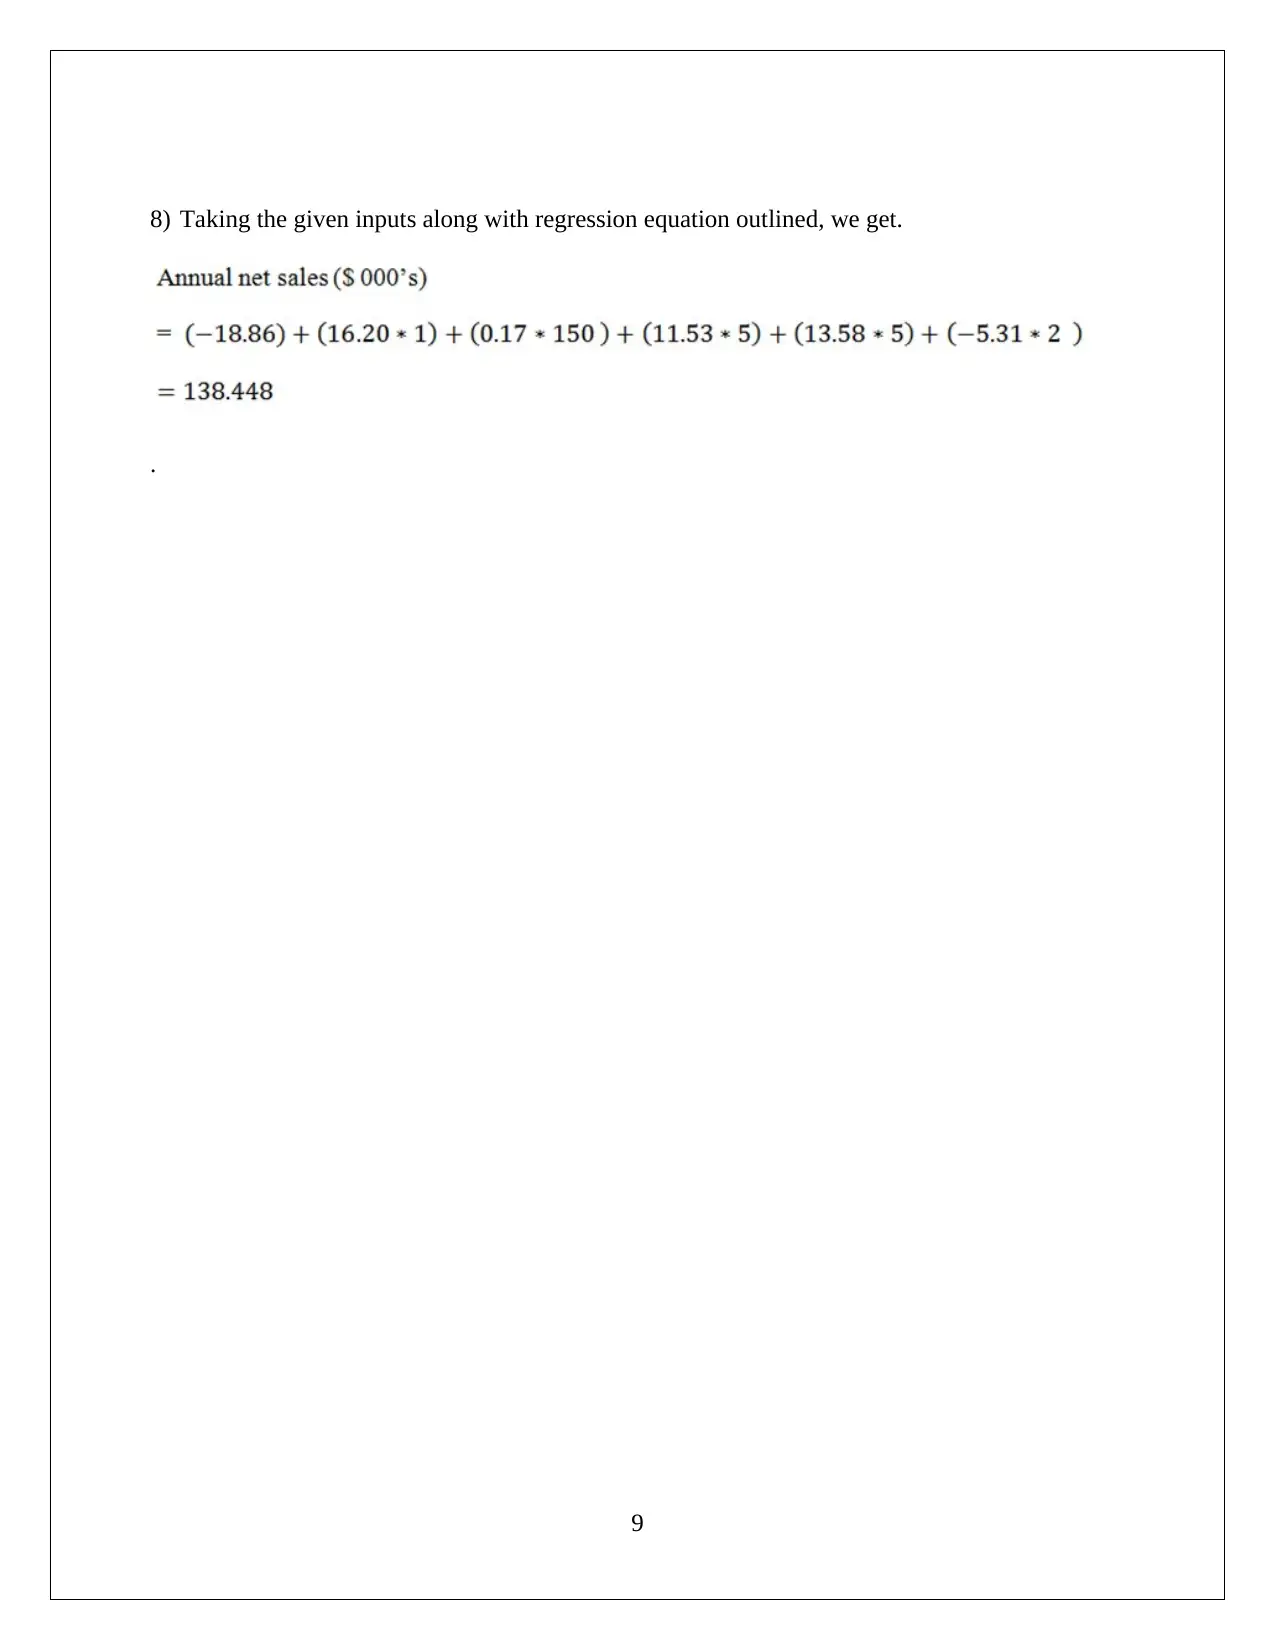
This report presents a statistical analysis of startup costs, incorporating regression analysis and hypothesis testing. The assignment begins with an examination of frequency and relative frequency distributions for different business types, constructing a histogram for visualization. The analysis reveals that the distribution of startup costs is not normal, and there are significant variations across different businesses. The report then conducts hypothesis testing using ANOVA to determine if there are significant differences in startup costs. Finally, a regression model is developed and analyzed, with the results indicating a strong fit. The report concludes with an interpretation of the regression results, including a 95% confidence interval for independent variables and a summary of hypothesis testing outcomes, highlighting the significance of the model and its variables.
Document Page
Statistics
HI6007
Student id
[Pick the date]
tabler-icon-diamond-filled.svg

Paraphrase This Document

Need a fresh take? Get an instant paraphrase of this document with our AI Paraphraser
Document Page
Task 1
1. For given startup costs variable, the requisite parameters are captured below.
1
Document Page
2. (a) Class range is considering as 0 to 30 for frequency and relative frequency distribution for
the business type
2
Document Page
(b) Histogram (for relative frequency of variables)
3
tabler-icon-diamond-filled.svg

Paraphrase This Document

Need a fresh take? Get an instant paraphrase of this document with our AI Paraphraser
Document Page
4
Document Page
3) Key takeaways from the results of the above two parts are summarized below.
Mean, median and mode are not the same for any of the businesses. Also, histogram
indicates towards skew being present. Hence, the distribution of sample startup costs is
not normal.
The startup costs across the business do not seem the same for the sample. A significant
trend relate to pet stores setup cost which on average seem lower for other businesses for
the sample.
4) The requisite hypothesis to test the claim is illustrated below.
5
Document Page
H0: Mean starting costs do not differ in a statistically significant manner
H1: Mean starting costs do differ in a statistically significant manner
Relevant Test: ANOVA single factor since variables count exceeds two
EXCEL Output
Observation: The F test yields a p value of 0.02 which is lower than α.
Decision: Reject H0
Conclusion: Across business, there seems to be a significant variation in the startup costs.
TASK 2
1) MS Excel – Regression Output
6
tabler-icon-diamond-filled.svg

Paraphrase This Document

Need a fresh take? Get an instant paraphrase of this document with our AI Paraphraser
Document Page
The equation for regression is captured as follows.
2) The regression output clearly suggests that R2 has a value of 0.9932 and hence the model
represents a good fit since more than 99% of the possible variations in the net annual sales can
be offered explanation based on respective changes in the considered independent variables.
3) Testing of hypothesis
Null Hypothesis: β for each independent variable is zero.
Alternative Hypothesis: β for minimum one independent variable is non-zero.
Relevant MS- Excel Ouput
The above table reflects p value at 0.00 is less than applicable significance level.
7
Document Page
Decision: Reject Ho and accept H1
Result: The regression model is significant
4) Interpretation
5) 95% confidence interval for independent variables
6)
The hypothesis testing summary is indicated below.
7) Considering that all slopes have established their significance, hence no alterations in the
regression model originally proposed would be made.
8
Document Page
8) Taking the given inputs along with regression equation outlined, we get.
.
9
chevron_up_icon
1 out of 10
circle_padding
hide_on_mobile
zoom_out_icon
[object Object]