Analysis of Startup Costs and Regression for Business Sales
VerifiedAdded on 2020/04/01
|10
|425
|151
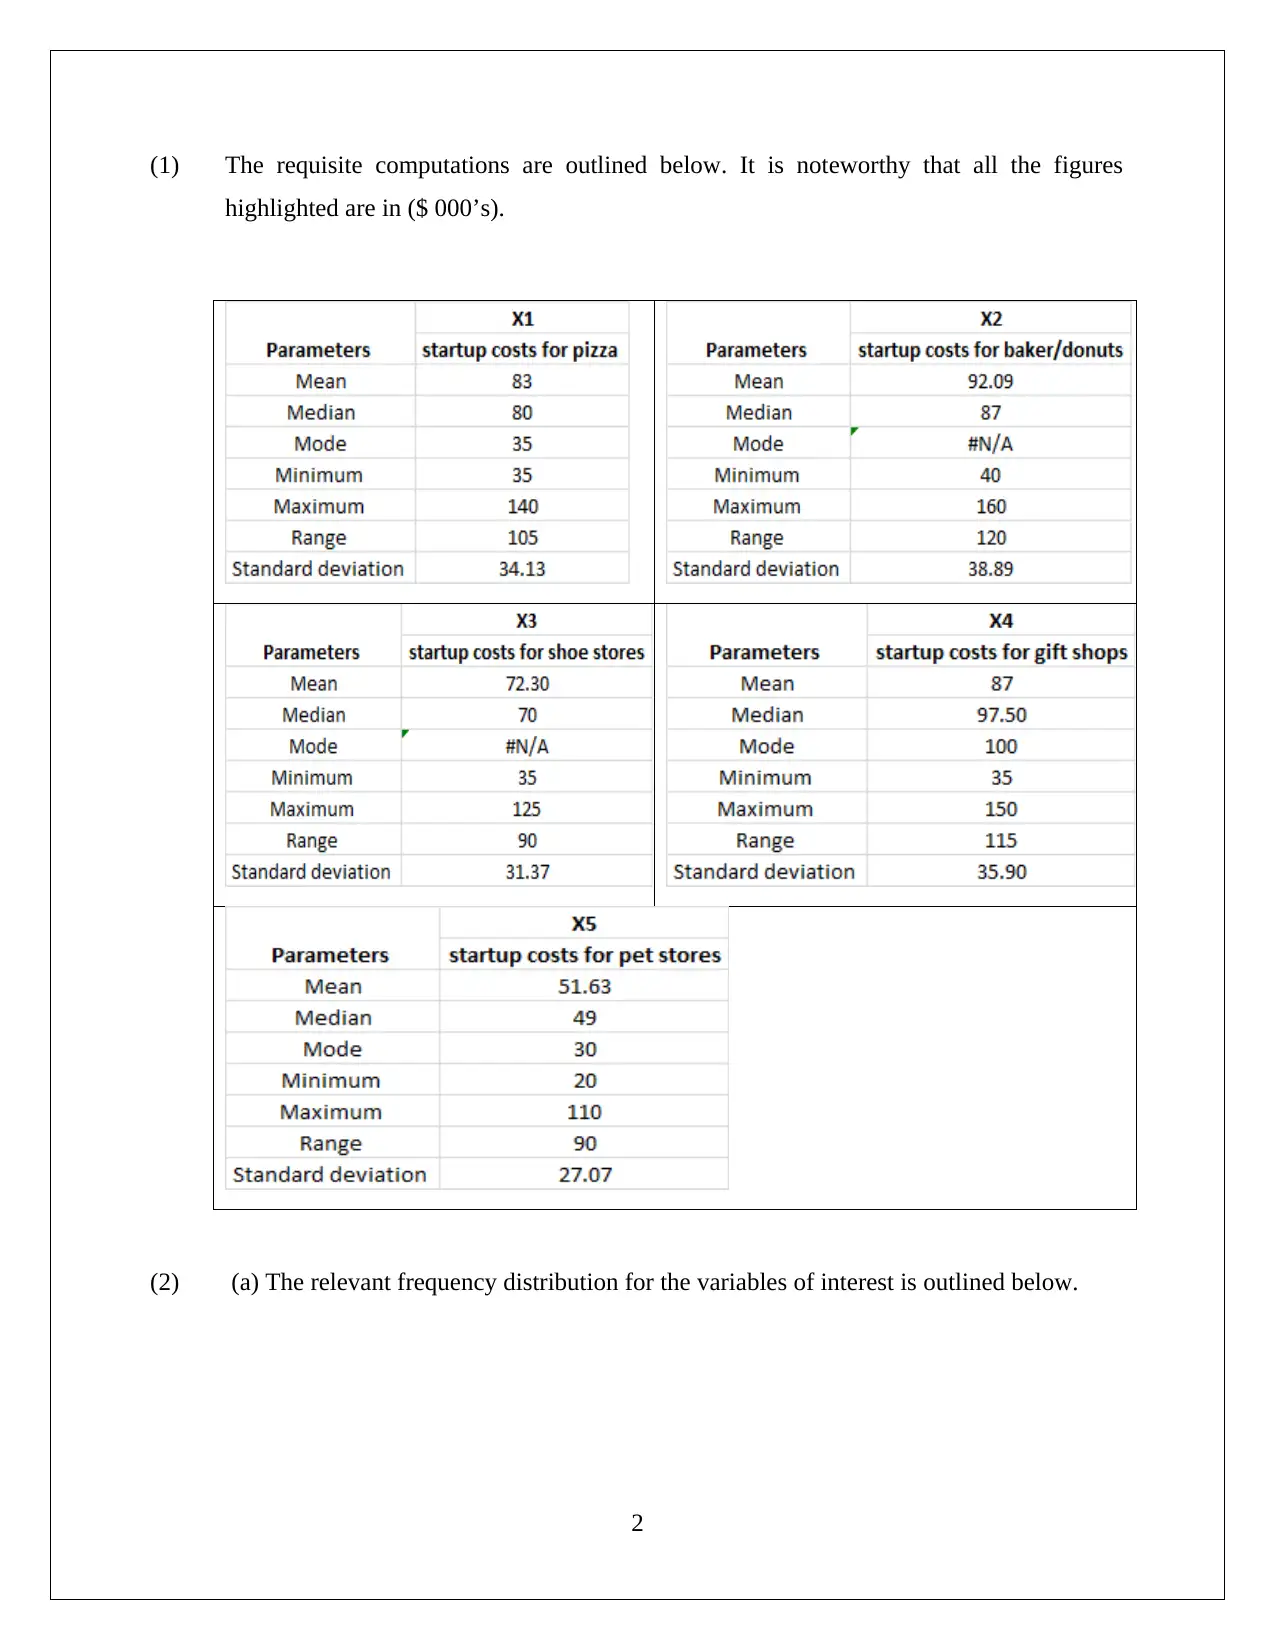
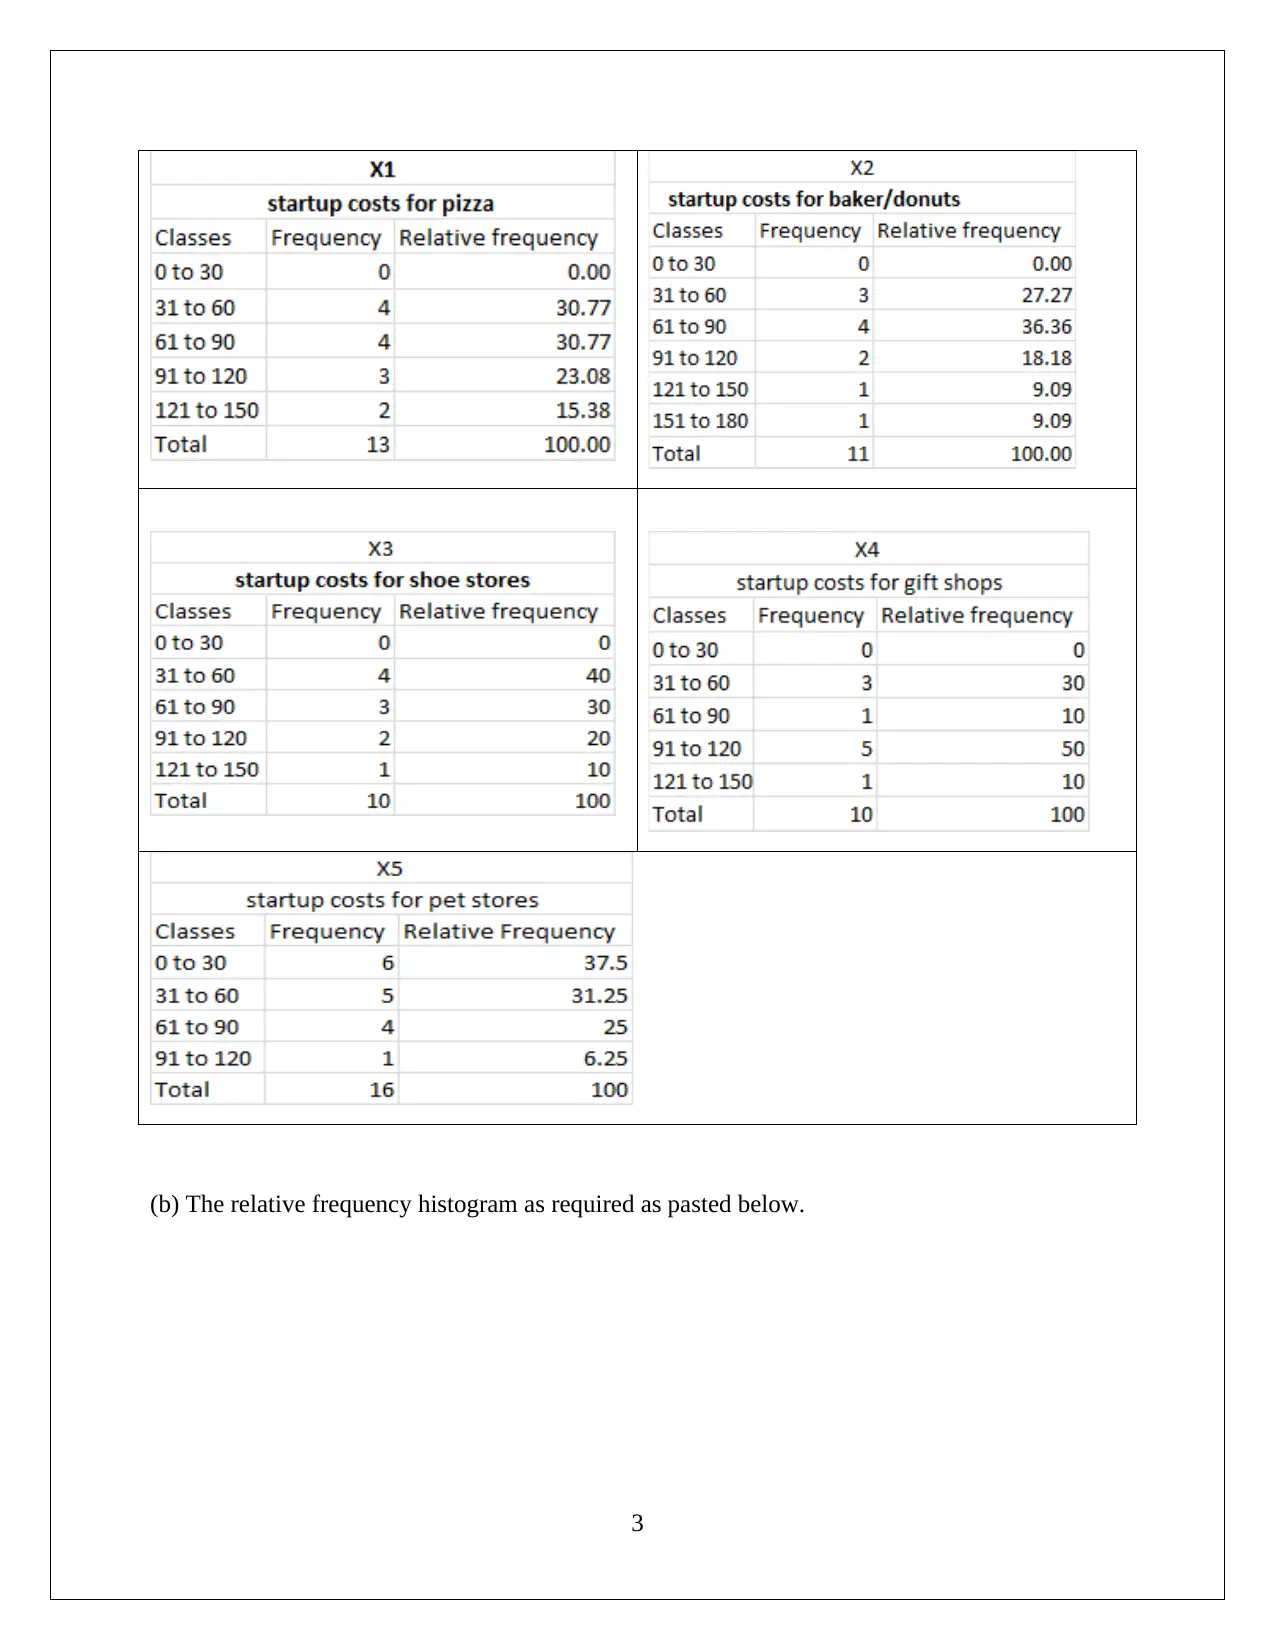
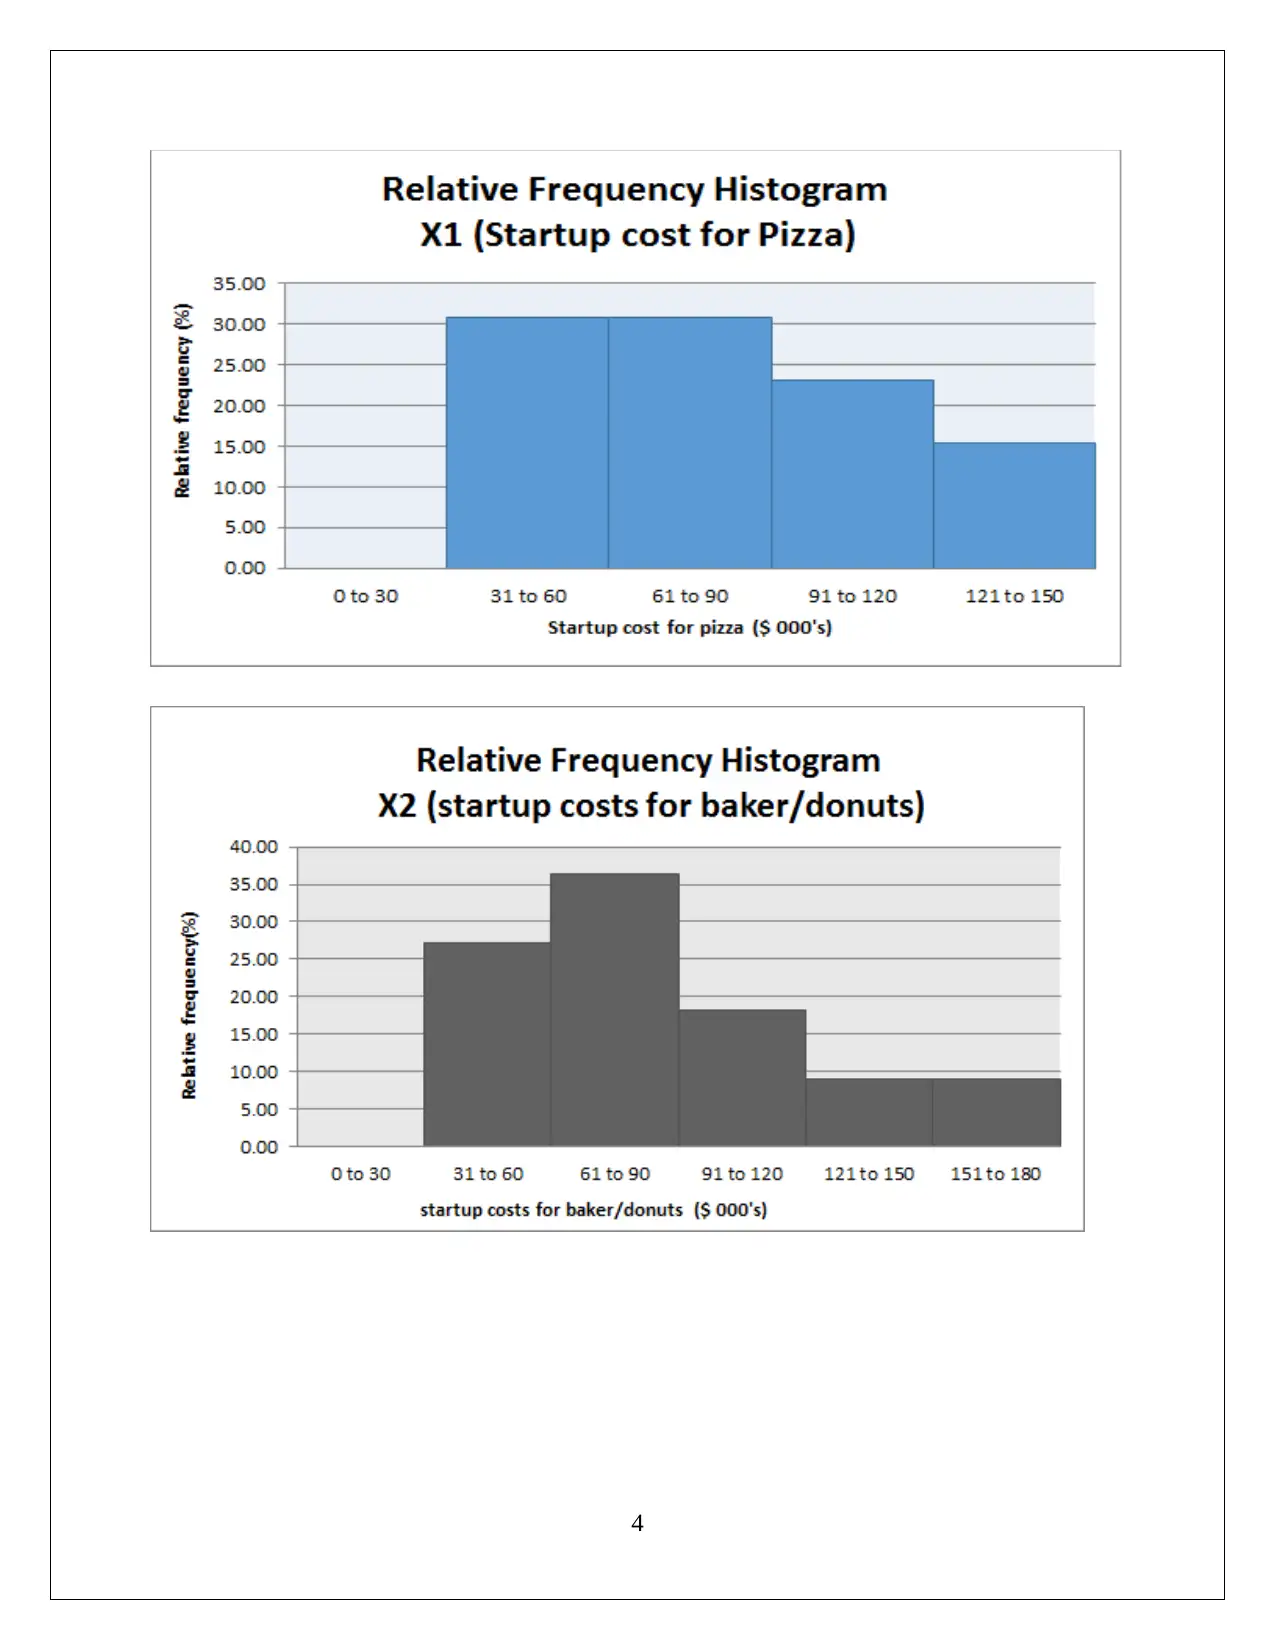
Homework Assignment
AI Summary
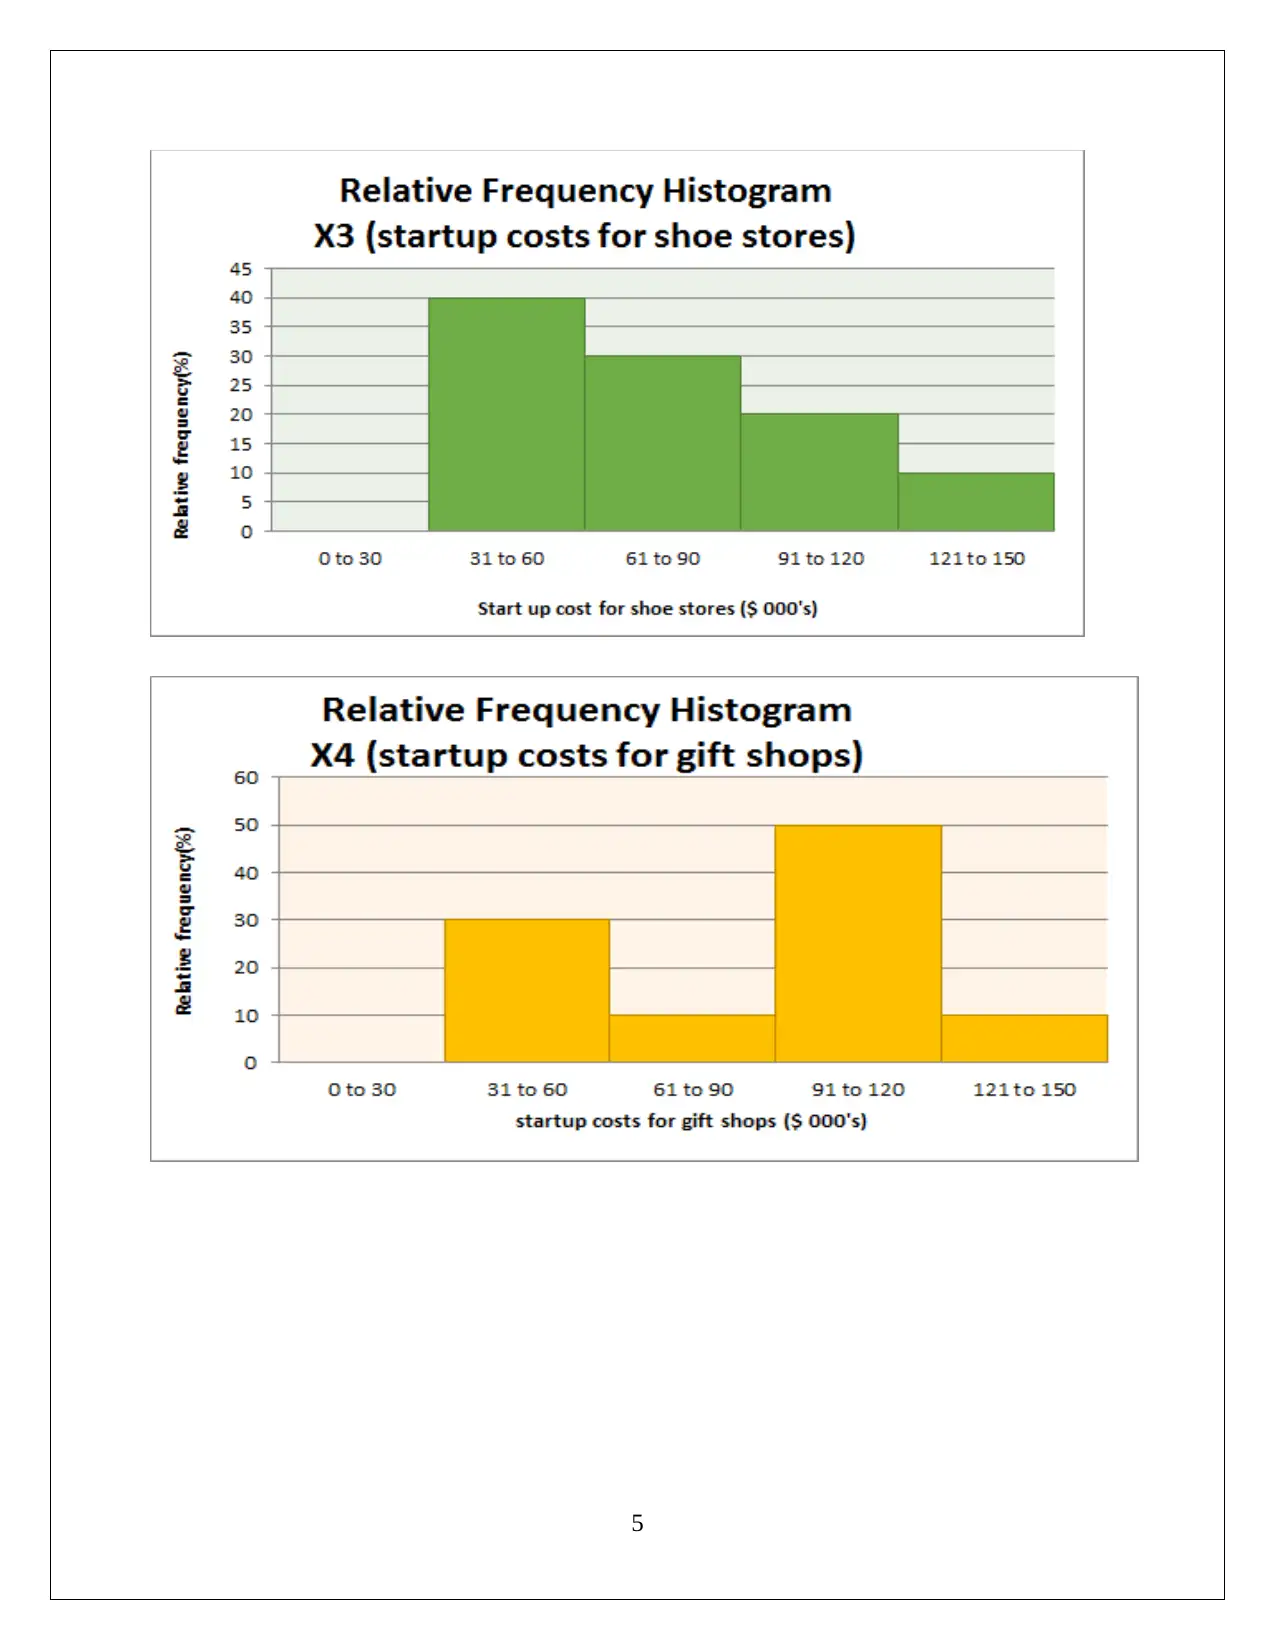
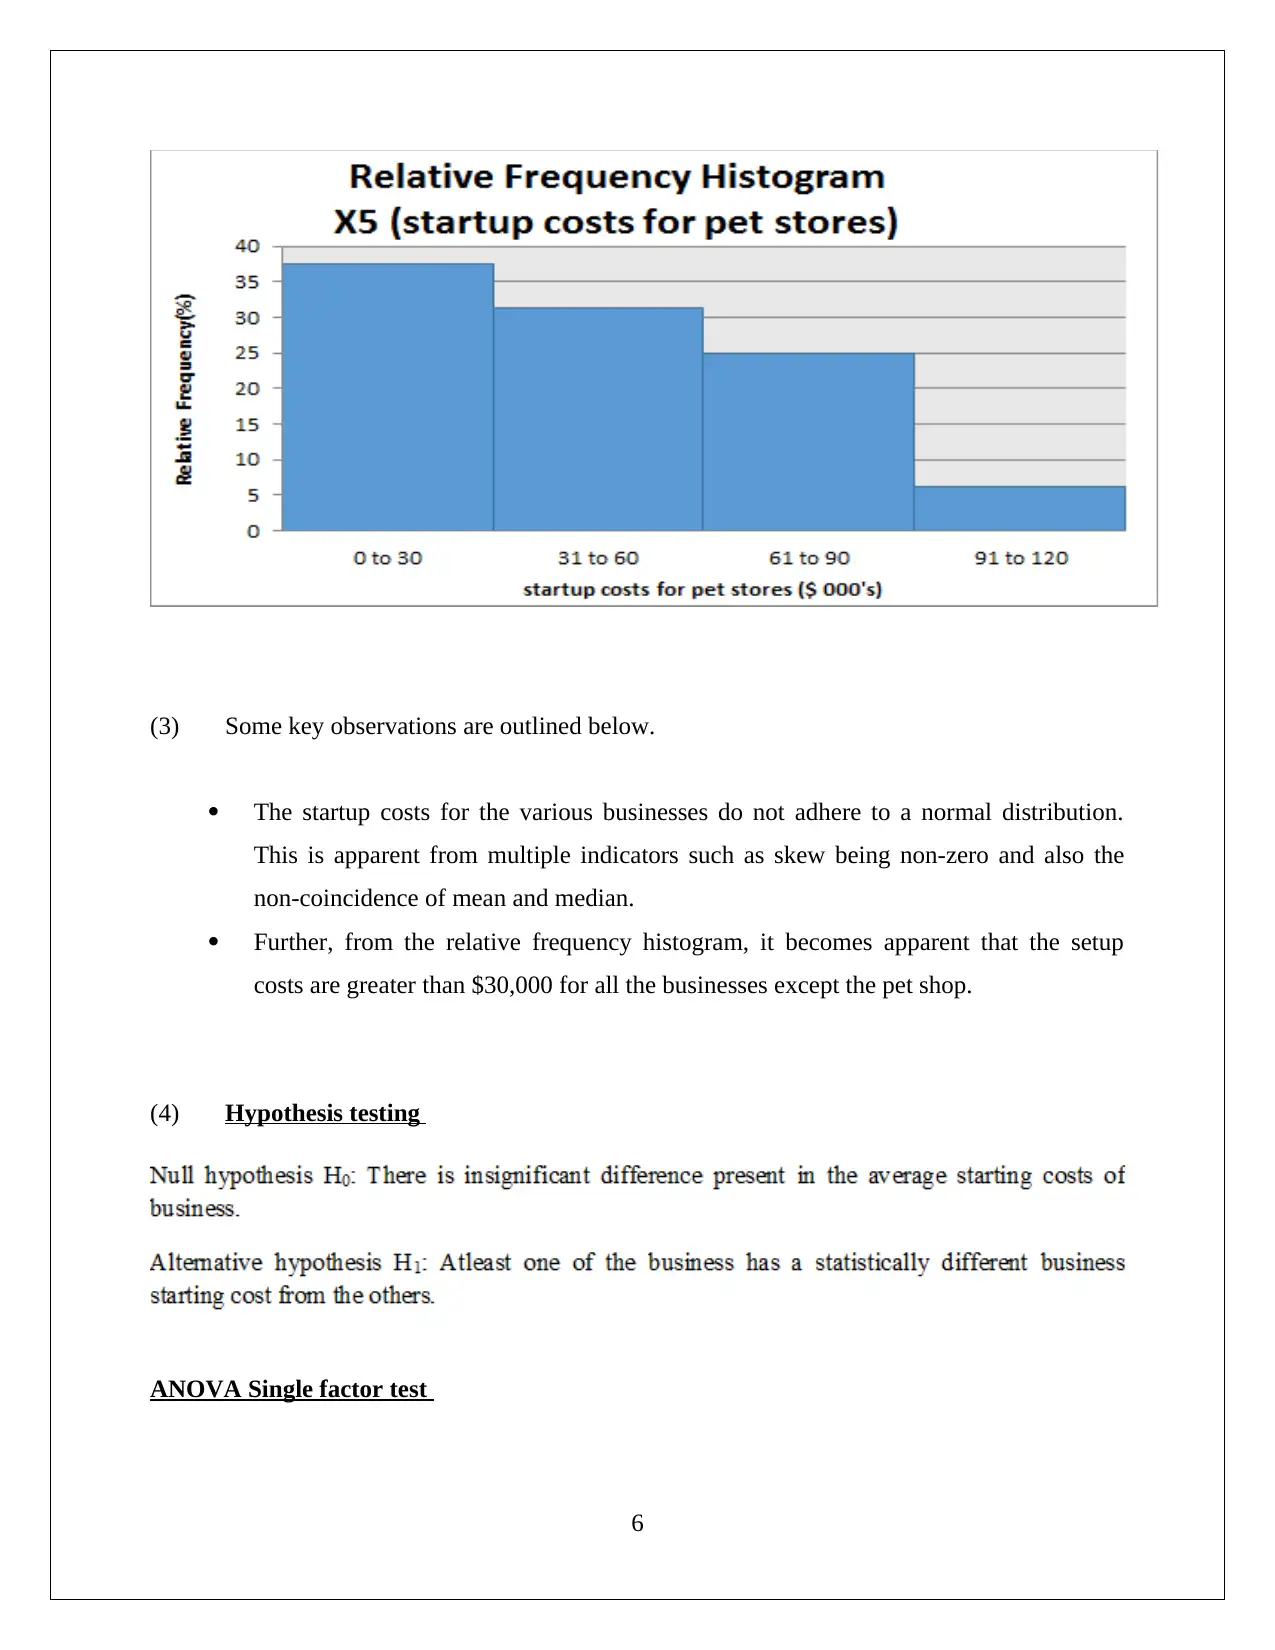
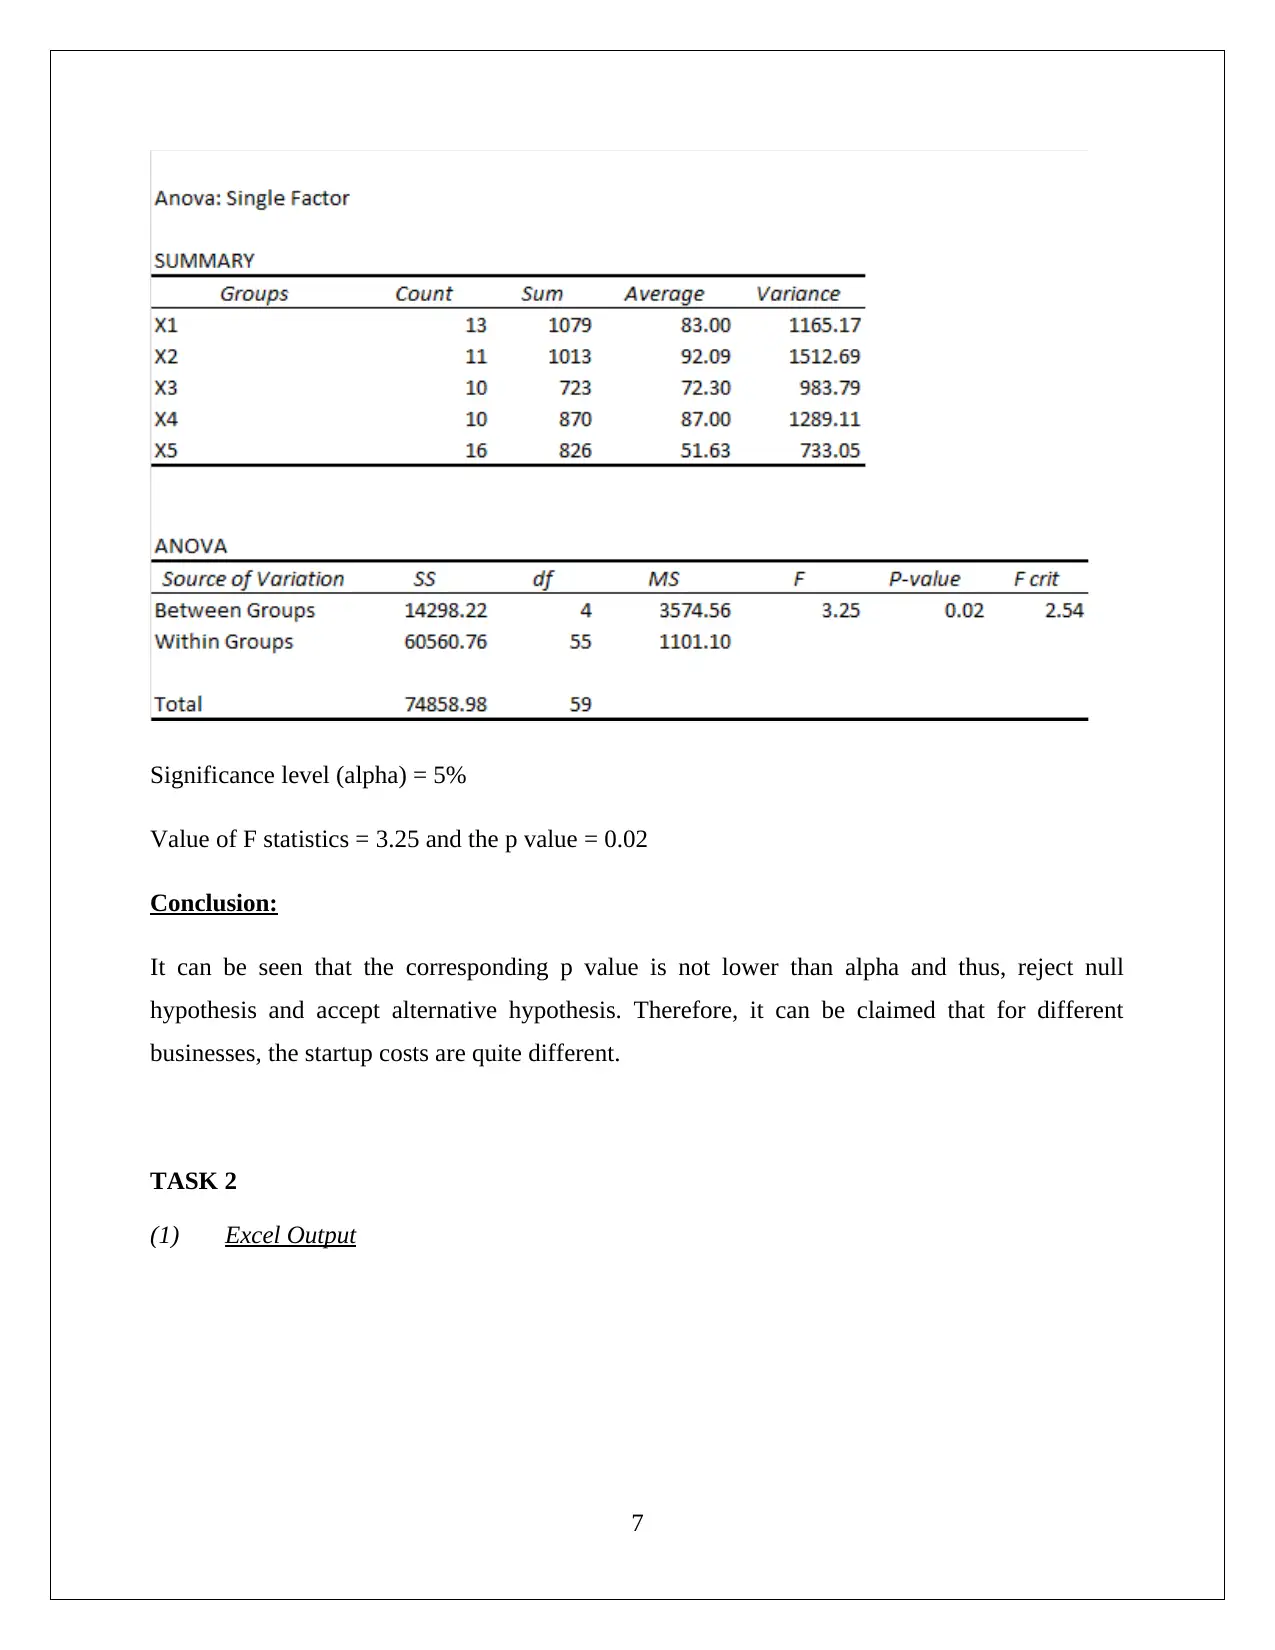
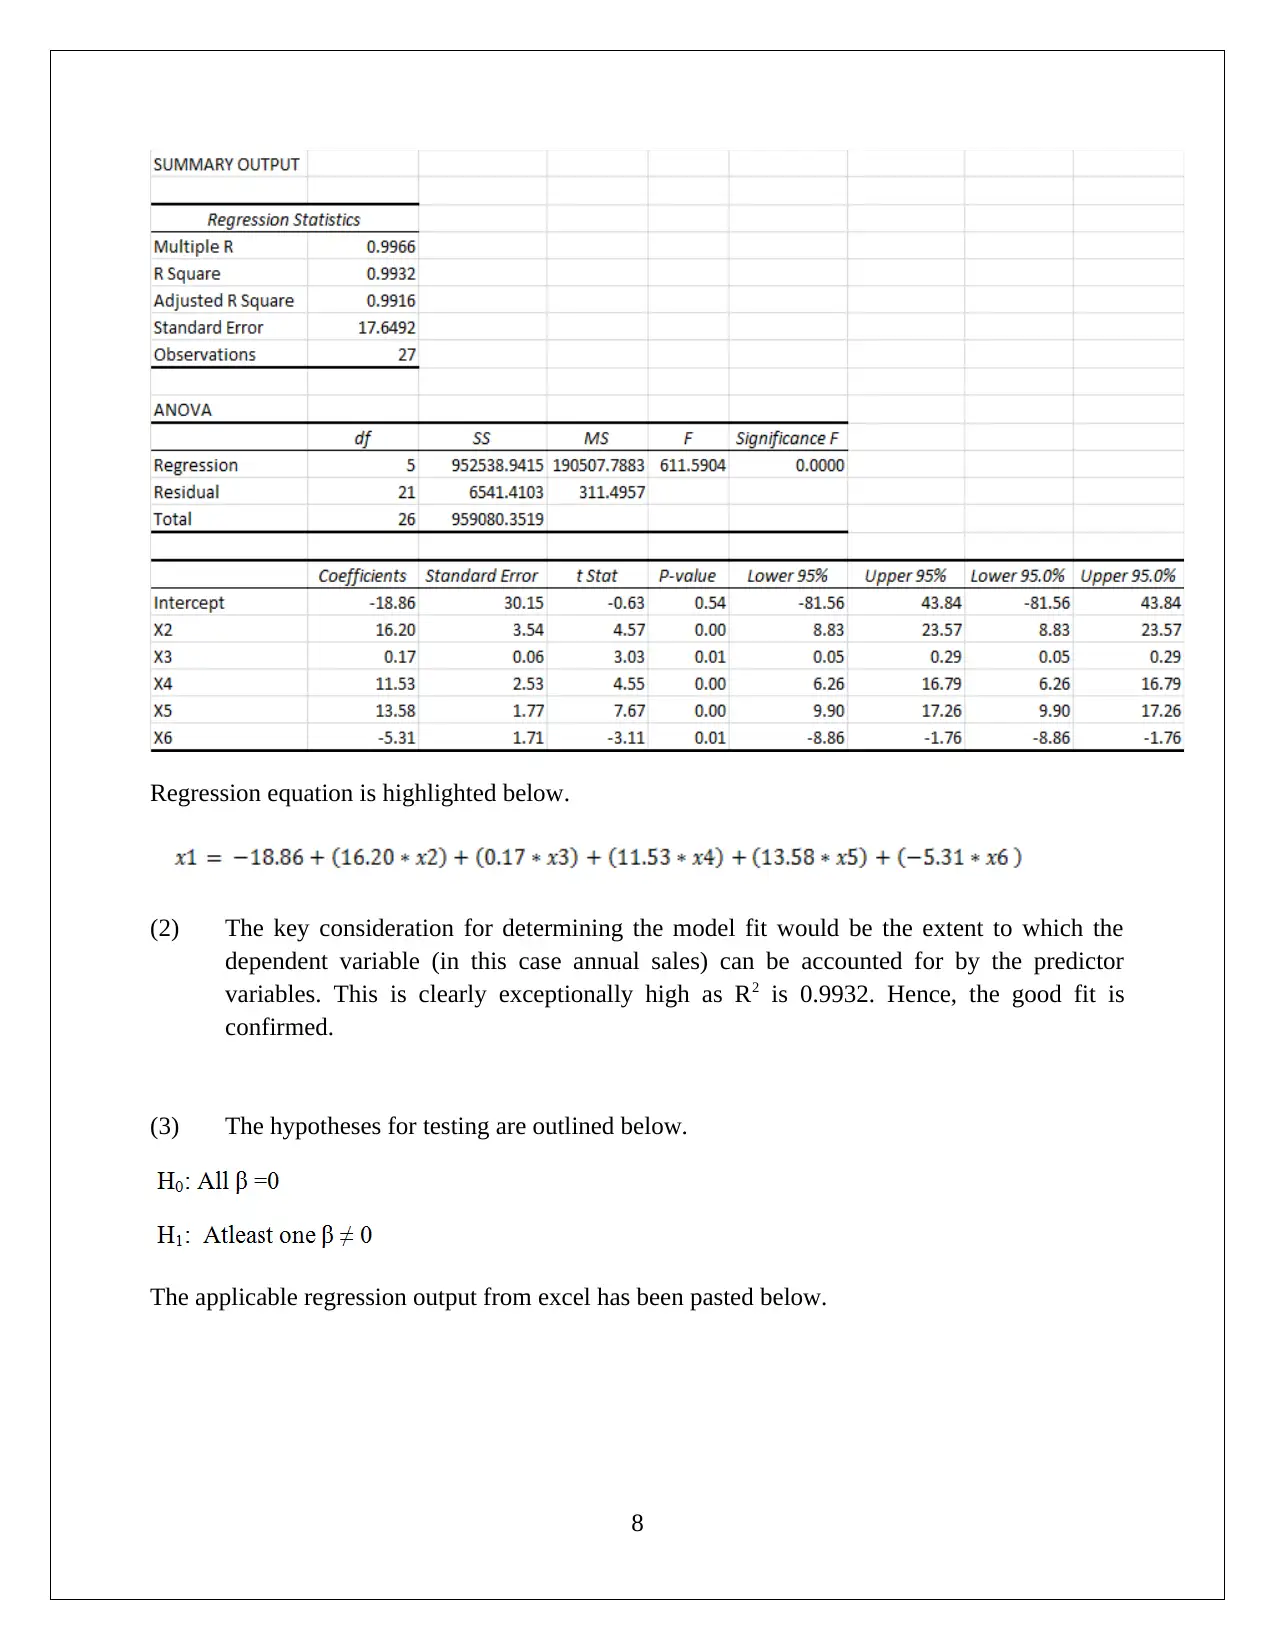
This assignment focuses on the statistical evaluation of business startup costs and their impact on annual sales using various statistical tools such as frequency distributions, relative frequency histograms, and hypothesis testing with ANOVA. It observes that startup costs do not follow a normal distribution based on skewness and median-matching criteria. The analysis includes regression modeling to predict annual sales, demonstrating high model fit indicated by an R2 value of 0.9932, and significant predictor variables confirmed via p-values. Through hypothesis testing and ANOVA, the assignment concludes that startup costs vary significantly across different businesses.
1 out of 10
Related Documents


Your All-in-One AI-Powered Toolkit for Academic Success.
+13062052269
info@desklib.com
Available 24*7 on WhatsApp / Email
![[object Object]](/_next/static/media/star-bottom.7253800d.svg)
Copyright © 2020–2026 A2Z Services. All Rights Reserved. Developed and managed by ZUCOL.